THE DIGITAL CAMERA AS A GPS COMPASS:
LOCATION MATCHING USING POINT CLOUDS
Masafumi Nakagawa*, Daisuke Kato, Hirotaka Endo, Hiroshi Itaya, Kenta Ochiai, Anna Nakanishi
Shibaura Institute of Technology, 3-7-5, Toyosu, Koto-ku, Tokyo, 135-8548, Japan - [email protected]
Commission IV, WG IV/2
KEY WORDS: Seamless positioning, Point-cloud, Image-based GIS, Panorama image, Image matching, Camera calibration
ABSTRACT:
We focus on the potential of a camera to act as a location sensor, assisting other location sensors to improve positioning accuracy. A camera is installed in almost all mobile devices. Moreover, the camera can be used as a location sensor without additional transmitters or receivers. However, if the camera is used as a location sensor, reliable maps will be required. Although there are some location-matching approaches that use maps, the success rate of location detection depends on the representation of a 3-D model and its information content. Compared with a model representation based on Computer-Aided Design (CAD), a point-cloud representation is more photorealistic. We therefore focus on point-cloud data being used for reliable maps. Our proposed location-matching methodology is based on image location-matching using images from a digital camera and panoramic images generated from a massive point-cloud in an image-based Geographic Information System (GIS). We conducted experiments in location matching using a digital camera to supply the input data for location detection and a point cloud taken from a terrestrial laser scanner. We have confirmed that our approach can detect locations using a digital camera that is restricted to horizontal movement.
1. INTRODUCTION
Recently, 3-D data-acquisition techniques and seamless positioning techniques in indoor and outdoor environments have become necessary for the construction and maintenance of facilities such as roads, bridges, tunnels, and public buildings. Laser scanning is one of these 3-D data-acquisition techniques. A laser scanner can acquire a 3-D point cloud by measuring the distance to a surface for a range of scanning angles. Moreover, a calibrated digital camera with a laser scanner can be used to acquire color information to add to the point-cloud data. Massive point-cloud data taken from terrestrial laser scanners are used for various visualization and 3-D modeling applications such as GIS data acquisition in urban areas and environmental investigations.
For many fields such as navigation, disaster relief, and construction automation, the Global Positioning System (GPS) is used to identify sensor locations. Although the GPS is a convenient system, it is restricted to outdoor environments. However, a seamless positioning technique for both indoor and outdoor environments is required to obtain sensor locations. Currently, mobile devices have many location sensors such as Radio Frequency Identification (RFID) tags, Bluetooth, and wireless LAN [1]. Practical issues with the above systems for facility monitoring are accuracy requirements and hardware installations around indoor-outdoor environments in urban areas. Magnetic direction sensors can acquire directions directly. However, the magnetic field is affected by metallic materials such as iron frames in indoor environments. In addition, although the simultaneous localization and mapping technique [2, 3], based on laser scanning, can achieve accurate sensor localization, laser scanners are too large to mount on mobile devices in their current state of development. Therefore, we focus on the potential of a camera to act as a location sensor, assisting other location sensors to improve positioning accuracy.
A camera is installed in almost all mobile devices. Moreover, the camera can be used without the need for transmitters or receivers.
However, for a camera to be used as a location sensor, reliable maps will be required. Although there are some location-matching approaches that use maps such as 3-D Computer-Aided Design (CAD) models and image data sets, the success rate of location detection depends on the representation of 3-D model and its information content. In addition, estimation of the location as the external orientation parameters of the camera requires the matching of corresponding points in camera images and the 3-D model. Corresponding-point detection is easy in manual processing. However, corresponding-point detection is not simple in fully automated approaches, because the features are inherently different (e.g. edges in images and boundaries in 3-D models).
Compared with a model representation based on a Triangulated Irregular Network (TIN) or on CAD, a point-cloud representation is more photorealistic. Moreover, the rendered result of a massive point cloud can be used as a panoramic image. We therefore focus on massive point-cloud data for use in reliable maps. Our proposed location-matching methodology is based on image matching using an image taken from a camera and panoramic images generated from a massive point cloud in an image-based GIS.
Our development aims for 10 cm accuracy to assist with existing indoor positioning techniques. When facility information for construction and maintenance is geocoded onto maps, higher accuracy and higher spatial resolution are required. We therefore describe fine location matching in this paper. We then develop this matching approach to confirm that a camera can be used as a location sensor in a fully automated procedure. Finally, we present experimental results that confirm the validity of our approach.
2. METHODOLOGY
The processing flow of our method for providing location data is shown in Figure 1 and described as follows. First, a template image is generated using a calibrated camera image. Second, photorealistic panoramic images from various viewpoints are prepared as cloud images by a rendering of massive point-cloud data. Third, the image-matching process uses the template image with panoramic images as base images.
Finally, the location of the camera capture is detected by the selection of a matched panoramic image from all the panoramic images. In addition, the direction of the camera capture is detected from a matched position on the matched panoramic image. The spatial resolution of location matching depends mainly on the spatial resolution of arbitrary viewpoints in the panoramic image generation, and the spatial angle resolution in location matching depends mainly on the resolution of the generated panoramic image.
Figure 1. Processing flow
2.1 Point-cloud rendering
Massive point-cloud data are well represented in visualization techniques. However, viewpoint translation in point-cloud rendering reduces the visualization quality because of noticeable occlusion exposure and a noticeably uneven point distribution. Although the point cloud preserves accurate 3-D coordinate values, the phenomenon of transparent far points existing among the near points reduces the visualization quality for users.
Splat-based ray tracing [4] is a methodology for improving the visualization quality by the generation of a photorealistic curved surface on a panoramic view using the normal vectors from point-cloud data. A problem is the substantial time required for surface generation in the 3-D workspace. Furthermore, the curved-surface description is inefficient when representing urban and natural objects in the GIS data.
An advantage of 3-D point-cloud data is that it allows accurate display from an arbitrary viewpoint. By contrast, panoramic imagery has the advantage of appearing more attractive while using fewer data. In addition, panoramic image georeference [5] and distance-value-added panoramic image processing [6] show that both advantages can be combined for 3-D GIS visualization. We therefore focus on the possibility that these advantages can be combined by a point-cloud projection into panorama space. In particular, we consider that a simpler filtering algorithm will be important for achieving high-volume of point-cloud processing at high speed. We have therefore developed a point-based rendering application with a simpler filtering algorithm to
generate photorealistic panoramic images with arbitrary viewpoints, which we call LiDAR VR data [7, 8].
The processing flow of our methodology in this research is described below. First, sensors acquire a point cloud with additional color data such as RGB data or intensity data. The sensor position is defined as an origin point in a 3-D workspace. If color data cannot be acquired, distance values are attached to a color index. We can therefore use a laser scanner, a stereo camera, or a time-of-flight camera. Second, a LiDAR VR image from the simulated viewpoint is generated using the point cloud. Finally, the generated LiDAR VR image is filtered to generate missing points in the rendered result using distance values between the viewpoint and objects.
An example of point-cloud rendering is shown in Figure 2.
Figure 2. Part of a panoramic image in which the left image is the result after a viewpoint translation of 6 m the sensor point
and the right image is the result after filtering
Panoramic image generation using the point cloud
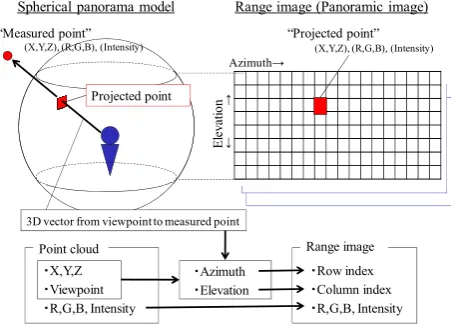
First, the colored point cloud is projected from 3-D space to panorama space. This transformation simplifies viewpoint translation, filtering, and point-cloud browsing. The LiDAR VR data comprise a panorama model and range data. The panorama space can be a cylindrical model, a hemispherical model, or a cubic model. Here, a spherical model is described. The measured point data are projected onto the spherical surface, and can be represented as range data as shown in Figure 3. The range data can preserve measured point data such as X, Y, Z, R, G, B, and intensity data in the panorama space in a multilayer style. Azimuth and elevation angles from the viewpoint to the measured points can be calculated using 3-D vectors generated from the view position and the measured points. When azimuth angles and elevation angles are converted to column counts and row counts in the range data with adequate spatial angle resolution, a spherical panoramic image can be generated from the point cloud.
Figure 3. LiDAR VR data comprising a spherical panorama (left side of the figure) and range data (right side of the figure) 任意視点球面画像
任意視点球面画像 任意視点球面画像
任意視点座標値 任意視点座標値 任意視点座標値
Camera image
Lens distortion
Image projection
Template matching
Matching point in image
Colored point cloud
Point-cloud rendering
Matched point-cloud image
Conversion from pixel to angle Translation reference Template generation
Viewpoint parameters
Point-cloud image
Matching results
Camera rotation parameters Camera translation parameters Input data
Output data
“Measured point”
Azimuthĺ
Ĺ
Ļ
Spherical panorama model Range image (Panoramic image)
“Projected point”
(X,Y,Z), (R,G,B), (Intensity)
E
le
v
at
io
n
Projected point
3D vector from viewpoint to measured point
(X,Y,Z), (R,G,B), (Intensity)
・Row index
Range image
・Column index
Point cloud
・Azimuth ・X,Y,Z
・Viewpoint ・Elevation
・R,G,B, Intensity ・R,G,B, Intensity
Based on this spherical panorama, the range data are generated using the point cloud with a translated viewpoint, as shown in Figure 4. When the points from P1 to P10 are projected into a panorama space generated from a viewpoint Xo, these points are arranged continuously from P1 to P10 in the range data. The azimuth or elevation angle from viewpoint Xo to measured point P1 is denoted by Ro. When the same scene is captured from a different viewpoint Xt, the angle from the viewpoint Xt to the measured point P1 is denoted by Rt. The position of the projected point in the range data moves according to the change in angle from Ro to Rt.
Figure 4. Point distribution calculated by viewpoint translation in the range data, occlusion detection using the point cloud, and
point-cloud interpolation using distance information
Filtering using distance values between a viewpoint and measured points
Three types of filtering are executed after the viewpoint translation, as shown in Figure 3. The first filtering is an overwriting of occluded points. When the viewpoint is translated to Xt, the projected point P1 becomes an occluded point behind P2. Therefore, P1 is overwritten by P2.
The second filtering is the generation of new points in no-data space. This occurs when the viewpoint is translated to Xt and a no-data space exists between the projected points P3 and P4. For exampl, Figure 2 shows Pnew1 being generated.
The third filtering is the detection of occluded points and the generation of new points instead of detected occluded points. When the viewpoint is translated to Xt, the point P8 exists between P9 and P10 after the first filtering. However, the actual point P8 should be occluded because the point P8 exists behind the real surface. Therefore, the occluded point P8 should be given a new distance value Pnew2, calculated by interpolation
processing using the distance values of points P9 and P10. In addition, new points are generated using a pixel-selectable averaging filter developed in our research as follows.
Pixel-selectable averaging filter
In general, when an image is transformed, each pixel in the image has its color data resampled by using the pixel values around it. Points projected into the panorama space are also processed using a similar technique to improve the quality of the range data. However, general resampling techniques such as nearest interpolation reduce the quality of the range data because valid, erroneous, and missing data are blended in the resampling. Therefore, a focused pixel-selectable averaging
filter is applied to this problem. The filter processing uses only valid pixels around a pixel in the resampling. This processing is equivalent to missing-point regeneration, without reducing geometrical accuracy, to give a uniform smoothing effect. The process flow for the pixel-selectable averaging filter is described as follows. First, the data are checked to see whether valid points exist. Second, the number of valid pixels in the block is counted. Third, after these point-extraction steps, a search range for distances is given to extract valid points. The start value of the search range is the distance from the viewpoint to the nearest point found among the extracted points, with the end value being the start value plus a defined distance parameter. All valid points in the block within the search range are then extracted. The defined distance parameter depends on the continuity of the points in the point cloud. Finally, an average distance value from the viewpoint to the valid points is calculated. The focus point value is then overwritten by the average value. However, if the focus point has a distance value within the search range, the point is defined approximately as the nearest surface point, and the overwriting processing is not performed in this case. This processing sequence is applied to all points.
2.2 Camera image projection onto the point-cloud image
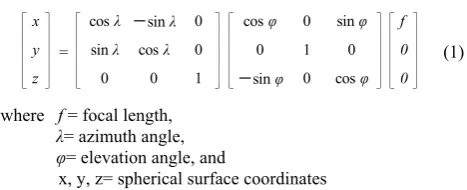
Azimuth and elevation angles are used as coordinate values in the panoramic image generated from the point cloud. Azimuth and elevation angles for the camera image can be calculated directory, based on the projection from camera coordinates to panorama coordinates using the rectified camera image after camera calibration. However, in general, the spatial resolution of a camera is higher than that for laser data. Therefore, a procedure based on the projection from panorama coordinates to camera coordinates can reduce the processing time. Image coordinates in a camera image are converted to azimuth and elevation angles, as shown in Figure 5.
Figure 5. Camera image projection onto a spherical surface
In addition, the spherical surface coordinates can be expressed as
(1)
where f = focal length, λ= azimuth angle, φ= elevation angle, and
x, y, z= spherical surface coordinates
Moreover, y and z in these spherical surface coordinates are multiplied by a ratio of x and the focal length of the camera. The calculated y and z are then converted to image coordinates in the panoramic image using camera rotation angles and a principal point taken from the camera calibration parameters.
x
Rectified camera image plane
Spherical surface λ, φ
P(x, y, z)
Focal length of camera
Principal point
Generate a new point Pnew1
P4
Delete occluded points and Generate a new point Pnew2
Real surface
3. EXPERIMENT
We conducted experiments on location matching using a digital camera and a point cloud in a gymnasium, which acted as a large indoor test field. First, we acquired digital camera images as input data for location detection and a point cloud as a reference map. Next, we applied image matching to estimate the three-degrees-of-freedom (3-DOF) parameters. Three kinds of parameter estimation were conducted in our experiments. Because horizontal position and azimuth angle are the essential parameters in general navigation applications, we therefore focused on estimating the camera position (X, Y) and the camera azimuth angle as the 3-DOF parameters.
3.1 Data acquisition
We used a digital camera to supply the input data for location detection and a point cloud taken from a terrestrial laser scanner.
Digital camera mounted on total station
We acquired the camera images (3648 × 2736 pixels) using a SONY DSC-HX5V. We installed the camera on a total station (SOKKIA SET550 RXS) to capture images in 12 directions at intervals 30° in the horizontal plane, as shown in Figure 6.
Figure 6. Digital camera mounted on total station
The 12 images were projected onto the spherical coordinate space with a 0.20° angle resolution after camera calibration, giving 12 images of 360 × 300 pixels each, as shown in Figure 7.
Figure 7. Projected camera images
Terrestrial laser scanner
We prepared a point cloud taken from a terrestrial laser scanner (RIEGL VZ-400). This scanner can acquire panoramic distance data and corresponding color data over 360°horizontally. The scanner was placed at two points. The distance between the two points was approximately 15 m. The camera mounted on the total station was placed on the line between the two points, as shown in Figure 8. The input laser-scanner data set comprised 7,000,000 points in total after 3 cm3 spatial filtering.
Figure 8. Sensor arrangement
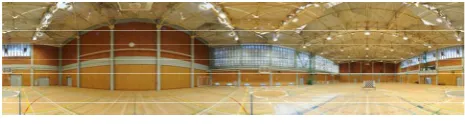
The color points measured by the laser scanner were then rendered onto a spherical space with an arbitrary viewpoint. Figure 9 shows a rendered panoramic image (1800 × 450 pixels) with 0.20° angle resolution. The average processing time for the panoramic image conversion and iterative filtering (three iterations) using parallel C programming was 0.33 s for one-shot generation of multiple viewpoints without file I/O. The processing involved an Intel Core i7 2.80 GHz processor using eight-thread execution.
Figure 9. Rendered panoramic image using a point cloud
3.2 Image matching
We estimated the azimuth angle and the horizontal position (X, Y) of the camera via template matching in this experiment. We applied a template-matching approach based on the sum of absolute difference to achieve simple processing of the camera image and panoramic images in our image matching. Camera images were used directly as template images and panoramic images from the point cloud were used as reference images. The camera was set perpendicular to the line from the laser reflector on the floor. The relative height of the camera position from the reflector was measured with a tape measure. The 3-D position of the reflector was measured with the laser scanner. In this way, the height value of the camera position was acquired. The camera was set horizontally using the tripod in the total station. The horizontal search line in the panoramic image was therefore given by an elevation angle (0°). The search interval in the panoramic image was one pixel. The search range in the panoramic image was therefore from 0.20° to 360.00° at intervals of 0.20° horizontally and the number of search points was 1,800 points per panoramic image.
These estimations were conducted over a wide spatial range (10 m at 50 cm spatial resolution) and a narrow spatial range (1 m at 5 cm spatial resolution). The number of arbitrary viewpoints was therefore 21 × 21 = 441 points.
As a result, we generated 12 template images from the camera images and 441 panoramic images from arbitrary viewpoints for our template matching. The experiment therefore provided 12 estimation results taken from each matching point and detected from 1800 × 441 = 73,800 candidates.
The average processing time for the matching-point detection in the template matching via single-thread C programming was 363.90 s using Intel Core i7 2.80 GHz processor.
SONY DSC-HX5V
SOKKIA SET550 RXS Digital camera
Total station
Total station
Laser scanner
Image 01
Image 05
Image 09
Image 02
Image 06
Image 10
Image 03
Image 07
Image 11
Image 04
Image 08
Image 12
3.3 Results
Three kinds of parameter estimation were conducted in our experiment. First, azimuth angles for the digital camera were estimated with a given viewpoint taken from the laser scanner. Second, the X and Y positions of the digital camera were estimated for given azimuth angles taken from the total station. Finally, both the positions and azimuth angles (3-DOF) of the digital camera were estimated. These estimations were conducted for both a wide spatial range (10 m) and a narrow spatial range (1 m).
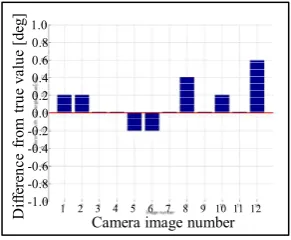
3.3.1 Azimuth angle estimation: Azimuth angles for the digital camera were estimated using each matching point detected from 1,800 candidates, as shown in Figure 10. The horizontal axis refers to the camera image numbers described in Figure 7. The vertical axis indicates differences from the true value measured by the total station.
Figure 10. Estimated azimuth angle
3.3.2 Camera position estimation: The X and Y positions for the digital camera were estimated using each matching point detected from 441 candidates. Figures 11 and 12 show results for the wide and narrow spatial range, respectively. The horizontal axis refers to the camera image numbers. The vertical axis indicates horizontal distances from the true value measured with the laser scanner.
Figure 11. Estimated camera position (wide range)
Figure 12. Estimated camera position (narrow range)
3.3.3 The 3-DOF estimation: Azimuth angles and positions for the digital camera were estimated using each matching point detected from 73,800 candidates. Figures 13 and 14 show the results for the wide spatial range, with Figures 15 and 16 showing the results for the narrow spatial range. The horizontal axis refers to the camera image numbers. The vertical axes in Figures 13 and 15 indicate horizontal distances from the true value measured with the laser scanner. The vertical axes in Figures 14 and 16 indicate differences from the true value measured with the total station.
Figure 13. Estimated azimuth angles in the 3-DOF (wide range)
Figure 14. Estimated camera positions in the 3-DOF (wide range)
Figure 15. Estimated azimuth angles in the 3-DOF (narrow range)
Figure 16. Estimated camera positions in the 3-DOF (narrow range)
4. DISCUSSION
From the results of our experiments, we have confirmed that our approach can detect locations using a camera and a point cloud via a fully automated procedure. There are three kinds of parameter estimation results to be discussed. First, the azimuth angle estimation for given position parameters was achieved reliably to within 1.0°, as shown in Figure 10. We have therefore demonstrated that our approach can be used in an indoor space environment containing iron frames if accurate positional data exist.
Second, the X and Y camera position estimations for given azimuth angles achieved nearly 50 cm accuracy for the wide spatial range, as shown in Figure 11. The narrow spatial range result also achieved almost 30 cm accuracy, as shown in Figure 12. From these results, we suggest that our approach will assist stand-alone positioning using a GPS receiver and existing indoor positioning techniques to achieve higher positional accuracy when accurate azimuth data exist.
Finally, both the camera positions and azimuth angles (3-DOF) were estimated together. These results were less stable than the independent results because of the increase in estimated parameters. However, we have also confirmed that our approach can assist existing indoor positioning techniques to achieve higher positioning accuracy. For example, if we have indoor positioning services such as RFID tags and wireless LAN at 10 m spatial resolution, our proposed approach can improve the positional data to sub-meter accuracy. In addition, the positional data are attached to degree-ordered azimuth angles.
When we analyze our results, Figure 14 shows that the results for image numbers 9 and 11 gave large matching errors. Figure 15 also shows that image number 2 gave large matching errors. We assume that color differences between the camera images and the rendered panoramic images caused the matching errors, because the window objects in the gymnasium were regions for which the laser scanner failed to measure 3-D points. When laser-scanning failures exist, the failure points are projected as missing points from the camera into the panoramic image. Therefore, a new pixel value (color) is estimated at each missing point in the panoramic image using neighboring pixel values in this experiment. The result of the color estimation will then differ from the pixel value in the camera image. Specular reflection on the floor also caused matching errors for the same reason.
Although we detected matching points from 73,800 candidates, other data could be used in the location detection. A reduced number of candidates for matching, achieved by using initial values taken from the various sensors in a mobile device, would be an effective approach to achieving more stable matching. For example, gyro sensor data could be used as initial values for azimuth angle estimation.
Although the spatial resolution of panoramic images was 0.20°, we could process at approximately 0.01° resolution using massive point clouds before data reduction in the current state. In addition, we could apply sub-pixel image processing to achieve higher spatial resolutions for positions and azimuth angles.
Currently, there are many challenges to making our approach useful in practice. Processing-time reduction is one technical issue. Our proposed approach has achieved 3-D location matching from a 3-D data-processing problem to simple 2-D image processing. This means that graphics-processor-based computing might be an effective and low-cost solution for our procedure. We can identify three additional challenges as follows. The first challenge is location detection using a
handheld camera that includes roll, pitch, and yaw angle estimation. The second challenge is robust estimation in a changing environment. The third challenge is robust estimation when occlusion caused by moving objects such as pedestrians occur.
5. CONCLUSIONS
First, we have focused on the fact that the camera installed in mobile devices has the potential to act as a location sensor, assisting other location sensors to improve positional accuracy. We have also observed that massive point-cloud data can be used as a reliable map. Our proposed location-matching methodology is based on image matching using images from a digital camera and panoramic images generated from a massive point cloud in an image-based GIS. When facility information for construction and maintenance is geocoded onto maps, higher accuracy and higher spatial resolutions are required. In this paper, therefore, we have described fine location matching aiming for 10 cm accuracy to assist indoor positioning techniques such as RFID and wireless LAN. We have then developed a matching system to confirm that our location application can provide location information using a camera and a point cloud via a fully automated procedure. Although the current success rate for location detection was below 100%, we have confirmed that our approach can detect a location using a digital camera horizontally. We are currently improving the reliability of our location-matching procedure.
References
[1] Petri, K., Petri, M., Teemu, R., Henry, T., Kimmo, V.Hannes, W. 2004. Topics in probabilistic location estimation in wireless networks. In: Personal, Indoor and Mobile Radio Communications, 2004. PIMRC 2004. 15th IEEE International Symposium, Vol.2, pp. 1052-1056.
[2] Durrant-Whyte, H., Bailey, T. 2006. Simultaneous localization and mapping (SLAM): part I, Robotics & Automation Magazine, IEEE, Vol. 13, Issue: 2, pp. 99-110. [3] Bailey, T., Durrant-Whyte, H. 2006. Simultaneous localization and mapping (SLAM): part II, Robotics & Automation Magazine, IEEE, Vol. 13, Issue: 3, pp. 108-117. [4] Lars, L., Karsten, M. & Paul R. 2007. Splat-based Ray Tracing of Point Clouds. Journal of WSCG, Vol.15, Issue: 1-3: 51-58.
[5] Jason, D. 2000. An approach to virtual environments for visualization using linked geo-referenced panoramic imagery. Computers, Environment and Urban Systems 24, 127-152. [6] Edward, V., Sisi, Z. & Sander, D. 2005, Distance-value-added panoramic images as the base data model for 3D-GIS. Panoramic Photogrammetry Workshop.
[7] Masafumi, N., 2011. LiDAR VR generation with point-based rendering. In: The Urban Data Management Society Symposium 2011, Delft, Netherlands, Vol.XXXVIII, pp. 223-230.
[8] Masafumi, N., Satoshi, K., Anna, N., Yuta, S., 2011, A point-based rendering application with a high-speed spatial interpolation. In: The 32nd Asian Conference on Remote Sensing, Taipei, Taiwan, P_161_8-26-19.
Acknowledgement
This work is supported by Strategic Information and Communications R&D Promotion Programme (SCOPE) of the ministry of internal affairs and communications, Japan.