Hydraulic characteristics of a rectangular
mixed-cell rearing unit
Barnaby J. Watten
a,*, Dale C. Honeyfield
b,
Michael F. Schwartz
caUnited States Geological Sur6ey,Leetown Science Center,1700Leetown Road,Kearneys6ille, WV 25430,USA
bUnited States Geological Sur6ey,Research and De6elopment Laboratory,RD No.4,Box63, Wellsboro,PA16901,USA
cFreshwater Institute,P.O.Box1889,Shepherdstown,WV25443,USA
Received 29 March 2000; accepted 28 August 2000
Abstract
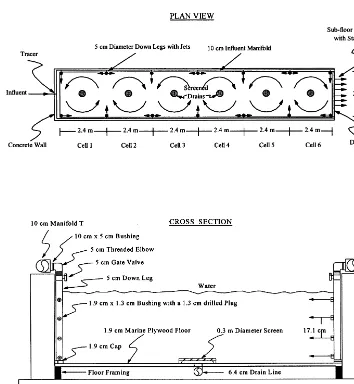
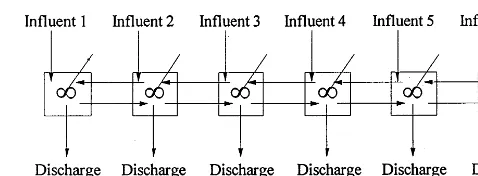
We describe a fish rearing unit modification that establishes mixed flow reactor (MFR) behavior in a rectangular vessel so as to eliminate metabolite concentration gradients, increase current velocities and improve solids scour at low water exchange rates. A standard raceway section 14.5 m long was modified to create six counter-rotating mixed cells, each 2.4 m wide by 2.4 m long. Cells receive water from vertical pipe sections extending to the tank floor and positioned in the corners of the cells. Vertical pipe sections were fabricated with jet ports that direct water into the cells tangentially to establish rotary circulation. Water exits each cell through a centrally located floor drain. Hydraulic characteristics of the tank are described based on an analysis of residence time distribution, current velocities and cell-to-cell water exchange rates. The latter was calculated based on a proposed hydraulics model and tracer concentrations established at a steady state. Vessel dispersion numbers measured with water exchange rates of 1.0 and 1.3 per hour, indicate tank performance approximates that of a MFR with the active tank volume representing 77.9 – 100% of total tank volume. Water velocities measured at 216 stations averaged 0.14, 0.12 and 0.12 m/s for the tank surface, mid-depth and near bottom regions. The benthic shear stress calculated given surface velocity was 0.04 N/m2. This was sufficient to scour and purge fecal solids produced
by 2010 kg of lake trout that averaged 44.3 cm in total length. Cell interaction was significant
www.elsevier.nl/locate/aqua-online
* Corresponding author. Tel.: +1-304-7244425; fax:+1-304-7244415. E-mail address:barnaby –[email protected] (B.J. Watten).
with cell-to-cell exchange rates averaging 3.9 times the tank inflow rate. Energy requirements of the rearing unit were kept low (1.32 m water gauge pressure; 6.7 W/m3) through use of a
large number of low velocity jets. © Published by Elsevier Science B.V.
Keywords:Rearing unit; Hydraulics; Salmonidae; Mixed flow reactor; Design; Raceway
Nomenclature
tracer concentration in effluent at time i (mg/l) Ci
tracer concentration in influent following step down (mg/l) Cmin
cell exchange rate (l/min) CER
combined pump and motor efficiency (0.7, dimensionless) e
mass tracer discharged (mg/min) MD
theoretical mean residence time, V/Q (min) t
allowable current velocity (body lengths/s) Vsafe
required scouring velocity (ft/s) Vsc
cell number (dimenionless) X
normalized tracer concentration (DC/DCmax)
Y
maximum change (negative) in tracer concentration (mg/l)
DCmax
normalized time, t/t (dimensionless)
u
variance about tc(min)
1. Introduction
Rearing unit design affects fish performance as well as system maintenance costs (Burrows and Chenoweth, 1970; Ross et al., 1995). Of particular importance is the ability of the design to circumvent problems associated with the accumulation of fecal solids or uneaten feed. Failure to remove this material can result in secondary production of ammonia, an increase in oxygen demand, and the development of suspended solids concentrations that predispose fish to bacterial gill disease and other infections (Stickney, 1979; Wickins, 1980). High water exchange rates are required for self-cleaning action in linear raceways (Westers and Pratt, 1977; Youngs and Timmons, 1991) dictating reuse of water. Water reuse promotes disease transmission as well as a gradient in dissolved oxygen and fish metabolites along the axis of the rearing unit series. Deteriorating water quality results in fish mortality and growth differences among individual rearing units and as such is undesirable (Watten and Johnson, 1990). Past attempts to improve the self-cleaning characteristics of the raceways through use of vertical baffles have been only partially successful (Boerson and Westers, 1986; Kindschi et al., 1991; Barnes et al., 1996).
Circulating rearing units such as the circular (Larmoyeux et al., 1973; Burrows and Chenoweth, 1955; Timmons et al., 1998), Swedish (Piper et al., 1982), and square types (Burley and Klapsis, 1985) are operated as mixed flow reactors designed to avoid the problems outlined above. Jetting influent water tangentially establishes a circulating flow that provides a more homogeneous water column, greater self-clean-ing action at relatively low water exchange rates, and substantial current velocities for improvements in fish performance (Burrows, 1969; Besner and Smith, 1983; Leon, 1986). Recently, a cross-flow vessel has been developed that incorporates the rectangular shape of linear raceways while providing the hydraulic characteristics of the circulating rearing units (Watten and Johnson, 1990). Water is introduced along one side of the tank and collected at floor level along the opposite side. Here, the influent is jetted across the floor to prevent the accumulation of particulate matter and to establish rotary circulation about the longitudinal axis. Field trials have been positive (Watten and Johnson, 1990; Ross et al., 1995; Ross and Watten, 1998), but tank construction costs are high. We describe an alternative method for modifying linear raceways to establish mixed flow reactor behavior. Design changes include use of screened floor drains positioned along the longitudinal axis of the tank and water jets positioned to establish a series of adjacent counter rotating mixed cells. The hydraulic characteristics of a test tank measuring 14.5 m long by 2.4 m wide are described based on an analysis of fluid residence time distribution (RTD), measure-ment of current velocities and cell-to-cell water exchange rates.
2. Tank design
vertical pipe sections extending to the tank floor and positioned in the corners of the cells. Vertical pipe sections serving two adjacent cells were constructed with eight jet ports, whereas pipe sections serving a single cell were constructed with four jet ports. The jet ports (N=76) were 6.35 mm in diameter and oriented so as to direct water into the cells tangentially to establish rotary circulation. The vertical pipe sections were coupled with 10 cm diameter influent manifolds using threaded elbows. Influent manifolds ran along the top and length of both walls of the tank. This allowed vertical pipe sections to be swung up and out of the water during fish crowding or grading operations. Influent manifolds, vertical pipe sections and jet
orifice designs were based on theoretical considerations given by Van Der Hegge Zijnen (1951), and Acrivos et al. (1959).
Water exited each cell through a centrally located floor drain measuring 6.4 cm in diameter, then was routed independently through the damboard end of the tank for final discharge. Each floor drain was covered by a screen measuring 0.3 m in diameter and constructed using perforated aluminum sheet stock. The sheet stock was fastened to a ring of plastic pipe slotted so as to fix the screen 2.5 cm above the tank floor. The water flow rate through each of the six drain lines was regulated by adjusting the height of external standpipes. Drain lines within the tank were covered by a false tank floor constructed of marine grade plywood, sealed with white epoxy paint and supported by 5×10 cm wood framing. We refer to this new design as a rectangular mixed-cell rearing unit.
3. Materials and methods
3.1.Background
Hydraulic behavior was evaluated by analysis of RTD and measurement of current directions and velocities. The RTD analysis is used to characterize nonideal flow in process reactors (Danckwerts, 1953) and requires a pulse or step change in an influent tracer (nonreactive) concentration. Monitoring the response of the effluent and developing a rectangular-coordinate plot of tracer concentration versus time estab-lishes the exit-age distribution of material flowing through the vessel. Flow anomalies can then be identified as well as the mean residence time of a fluid element (t(c) within
the vessel, the dispersion about the mean (s2) and the degree of axial dispersion or
mixing (D/mL). The group D/mL, termed the vessel dispersion number, changes in value from zero for ideal plug flow to infinity for completely mixed flow reactor behavior (Levenspiel, 1979). Regarding flow anomalies, atcless than the theoretical
retention time (t() establishes the presence of stagnant regions (SR) within the reactor. The extent of these regions expressed as a fraction of the reactors total liquid volume is:
SR=1−t(c/t( (1)
where
t(=V/Q (2)
With a step down in tracer concentration,tcands
2are defined as follows (Levenspiel,
Given tc and s
2,
D/mL is calculated by using the expression (Levenspiel, 1979):
s2
The RTD analysis was performed at a flow rate of 379 l/min (about 1 exchange/
h) with and without 2010 kg of lake trout (Sal6elinus namaycush) present in the tank. The trout averaged 44.3 cm in total length, 895 g in weight and were held in the test tank 148 days prior to the RTD runs. The RTD analysis was also performed at a flow rate of 502 l/min (about 1.3 exchanges/h) without fish present. RTD analyses were replicated three times for each set of operating conditions tested. Well water (10°C) was used in all runs. Flow rate exiting each cell was measured using a stopwatch and container of known capacity. Water line pressure (gage) was measured with a water filled u-tube manometer. RTD was identified based on a step down in tracer concentration from one steady value to another (Watten and Beck, 1987; Watten and Johnson, 1990). Chloride ion (Cl−) was used
as the nonreactive tracer. A salt (NaCl) solution was dispersed in the water supply manifold at a rate that provided about a 15 fold increase in Cl− concentration
above the average influent level of 3 mg/l. Brine flow was provided by a peristatic pump operating at a constant speed. The step down in tracer concentration was achieved by terminating brine flow allowing tank influent Cl− concentrations to
return to the normal water supply level. Samples of individual tank cell effluents were then taken concurrently at 8 min intervals using autosamplers (Model 1350 American Sigma, Medina, NY). Chloride concentrations were determined using high pressure liquid chromatography (APHA, 1989). Following data collection SR, tc, s
2, and
D/mL were calculated based on Eqs. (1) – (5).
We characterized the exchange of water between adjacent tank cells by metering brine at a fixed rate into one of four manifolds serving cell 1. Chloride levels in all cells were then measured once steady-state conditions were established. Here the water flow rate was fixed first at about 516 l/min (about 1.3 exchanges/h) and in a second test series at 370 l/min (about 1 exchange/h). Water flow and Cl− were
measured as in the RTD analyses. These tests were replicated twice. Additionally, current velocities were measured at 216 stations distributed uniformly within tank cells 4, 5 and 6 at tank surface, mid-depth, and near-bottom (30 mm above floor). The water flow rate during this test was 510 l/min (about 1.3 exchanges/h). Velocities were measured by using an electromagnetic current meter (Marsh-McBir-ney Model 201D). Corresponding energy requirements (W/m3
) for the tank were calculated using the equation:
P= Hg (Q/60 000)
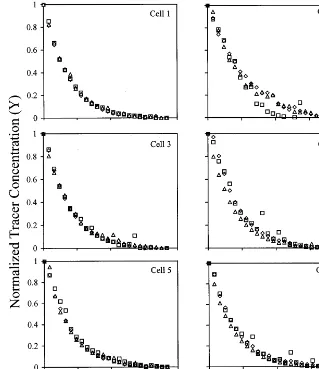
Fig. 2. Normalized tracer concentration plotted against time for the RTD analyses conducted at 1 exchange/h with lake trout present in the tank. Replicates are indicated by symbol type.
Benthic shear stress (m*), used to establish particulate matter scour potential, was calculated given mean surface velocity, water depth, surface roughness and water density (Peterson, 1999). Analysis of variance (ANOVA), Student’st and pairedt analyses were used to test for factor effects and interactions witha=0.05. Analyses
were performed using SigmaStat® 2.0 statistical software (SPSS Inc., Chicago, IL).
4. Results and discussion
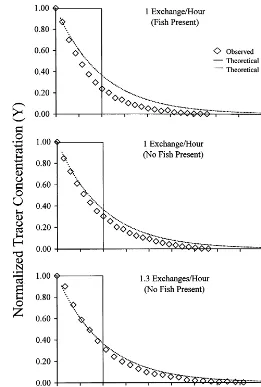
Fig. 3. Example overall tank effluent response to the step down in tracer concentration at 1 exchange/h (lake trout present), 1 exchange/h (no fish present) and at 1.3 exchanges/h (no fish present).
counter rotating mixed cells despite the absence of physical barriers along adjacent cell boundaries. With shading, lake trout distributed themselves throughout the tank volume and fecal material was purged quickly eliminating the need for manual solids removal. However, similar to raceways, periphyton and slime growth oc-curred on tank walls but growth was slow and the required cleaning frequency (every 60 – 90 days) was considered acceptable. Fig. 2 gives cell-by-cell summaries of the RTD data established at 1 exchange/h with lake trout present. Similar plots were established for all other tests conducted at 1 and 1.3 exchanges/h. Data were plotted using a normalized value of tracer concentration (DC/DC
Table 1
Residence time distribution characteristics9S.E. of the mixed cell tank conducted at 1 exchange/h (with and without lake trout present in the tank), and at 1.3 exchange/h (data represent the mean of three observationsa)
Exchange rate Variable
1 Exchange/h — 1 Exchange/h — 1.3 Exchange/h —
fish no fish no fish
49.091.0c
44.190.4b 45.690.4b
Mean residence time,tc(min.)
76.990.7b 79.791.2b 100.490.6c
Mean ratiotc/t, (%)
Mean variances2 (min2) 776.8931.4b 1200.6961.0c 863.6961.5b
19.091.2b
24.590.8c
17.690.6b
Mean ratios2/tc (min)
0.2790.01b
Mean dispersion number,D/mL 0.3990.01c 0.2990.02b
(dimensionless)
aValues in the same row processing a common letter do not differ at 95% confidence level.
In each cell, the decrease of Cl− concentration observed was described by an
exponential model (R2, 0.79 – 0.86), with good agreement among replicates.
Hy-draulic retention time based on a combined cell discharge was normalized by dividing the observed time t by the theoretical retention time t( (Eq. (2)). In tests involving fish, a conversion factor of 0.982 liters per kg biomass was used to correct the calibrated tank volume for the volume displaced by biomass (Watten and Beck, 1987). Normalizing time allows comparison of the RTD with that predicted for an ideal mixed flow or plug flow reactor (Levenspiel, 1979), i.e. in the mixed flow case the effluent tracer concentration (Y) decreases exponentially with time following a step down in influent tracer concentration:
Y=DC/DCmax=e−u (7)
where
u=Dt/t(. (8)
Conversely, in a plug flow reactor, the tracer concentration returns immediately to the influent baseline concentration at time t=t( (one complete exchange). Performance of the test tank (Fig. 3), approximates that of a mixed flow reactor and deviated substantially from the response predicted for a plug-flow reactor. Corresponding D/mL values (Table 1) ranged between 0.27 and 0.39, indicating again that substantial mixing occurs in the vessel (D/mL\0.01) but less than that expected in an ideal reactor (Levenspiel, 1979). The presence of fish at the water flow rate of 379 l/min decreased mixing as indicated by D/mL and reduced the variables t(c / t(, s2 and s
2
/ t(c (Table 1). These effects were statistically
significant (PB0.05) except for the ratio t(c / t( and in general agree with the
effects of channel catfish on tank performance described by Watten and Beck (1987). Watten and Beck hypothesized that fish influence RTD by moving in and out of stagnant regions within the reactor. This movement would act to increase the degree of interchange between adjacent regions thereby reducing the time required to purge the tracer completely from the tank. The active tank volume measured ranged from 77 to 100% of total volume with the greatest ratio occur-ring at 502 l/min. The ratios calculated are similar to those reported for two alternative mixed flow type rearing vessels (Watten and Beck, 1987; Watten and Johnson, 1990) — the cross-flow tank (73 – 87%) and the circular tank (77 – 79%). The water exchange rate effect on active tank volume was significant (PB0.01) but exchange rate did not influence the other RTD performance indicators.
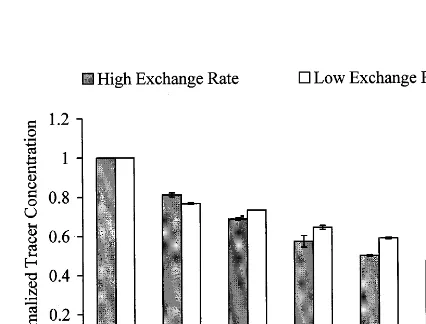
Fig. 4 gives the mean normalized Cl−
concentration in all cell effluents at steady-state when Cl−
was introduced through one of the vertical pipe segments serving cell 1. The drop in Cl− measured along the longitudinal axis of the tank
was described by an exponential model established using least-squares regression analyses:
Fig. 5. Proposed reactor model for the mixed cell rearing unit.
Fig. 5 gives the reactor model developed for the test tank based on results from RTD and Cl− profile analyses. The model proposed shows mixing within each cell
as well as that observed between adjacent cells. This model, when used with the Cl−
profile data (Fig. 4), allows calculation of cell interaction rates given that at steady-state the mass addition rate of Cl−must equal the mass discharge rate. The
mass discharge rate across all cells j (n=6) is:
MD = %
n
j=1
((Ci−Cmin)Q)j. (11)
For the test case where Cl−was introduced only into cell 1, the net flux (NF) across
the cell 1−cell 2 boundary must equal the sum of the mass discharged from cells 2 – 6. This is equivalent to
NF = MD - ((Ci - Cmin)Q)cell 1. (12)
When nozzle flow matches center drain discharge, movement of water from cell 1 into cell 2 must match, at steady state, movement from cell 2 into cell 1. Movement of water in either direction is then fixed by the Cl−concentration difference across
the cell boundary assuming the active volume of each cell is mixed:
CER = NF
(Ci−Cmin)j=1−(Ci−Cmin)j=2
. (13)
This calculation procedure was followed for each cell boundary using Cl− profile
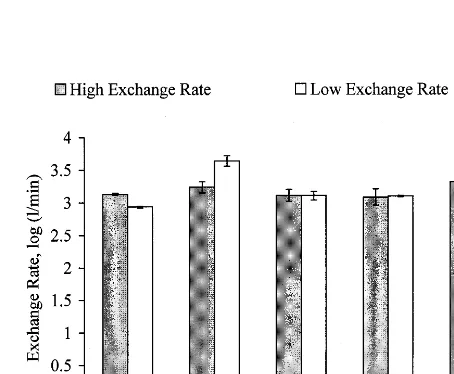
data established at both test inflow rates (Fig. 6). Calculated CER averaged 1769 and 1559 l/min at 1.0 and 1.3 exchanges/h, respectively. The effect of inflow rate on CER was not significant (P\0.05). The CER mean of all calculations (1664 l/min) indicates movement across each cell boundary exceeds tank inflow rates by a factor of 3.9.
reported in general for circular tank designs (Skybakmoen, 1989). Differences reflect, no doubt, increased drag associated with forced distortion of circulating cells within the test tanks rectangular boundaries. Nevertheless, the pressure requirement of the influent manifold was low (1.32 m gage) resulting in a favorable energy demand of 6.7 W/m3. This ratio is similar to the 7.2 W/m3calculated for the
cross-flow tank (Watten and Johnson, 1990) when operated at a similar surface velocity (0.13 m/s) and volume (20.3 m3). Both designs have minimized energy
requirements through use of a large number of uniformly distributed influent jets (Fox and Gex, 1956). Jet induced rotation within cells of the test tank provided a radial current that directed settlable solids across cell floors to center drains. Hence fecal solids released in cell 1 are not required to traverse the length of the vessel prior to removal as in the conventional plug-flow operating mode. Youngs and Timmons (1991) provide an equation that correlates particle diameter (d) and specific gravity (G) with required scouring velocity
VSC]1/2d 4/9 (G-1)1/2. (14)
This correlation is conservative given that it ignores the positive effect of fish activity on particle transport. WithVSCset equal to the tank mean of 0.13 m/s, and
using a G of 1.19 from Chen (1991), Eq. (14) predicts movement of particles less than 4.5 mm in diameter. Benthic shear stress (m*) corresponding to the mean surface velocity was 0.04 N/m2. This exceeds m* values required to move and
suspend organic matter including feed pellets (Peterson, 1999). Accordingly, feed and fecal solids produced by our lake trout (mean fish weight 895 g) did not accumulate in the test tank during the 148 day acclimation period. This character-istic provides a savings in labor requirements while also circumventing the negative
effects of solids accumulation, e.g. an increase in biochemical oxygen demand and secondary ammonia production. Beyond particle transport, current velocity plays an important role in establishing cohort performance (Ross and Watten, 1998). Forced swimming improves fish growth, disease resistance, and reduces oxygen consumption rates (Besner and Smith, 1983; Leon, 1986; Totland et al., 1987). Woodward and Smith (1985) reported forced swimming of rainbow trout at 1.5 body lengths/s lowered oxygen consumption 20.1% while fish were resting and 14.4% while swimming. Similar reductions, attributed in part to forced exercise, have been reported for tilapia (Watten and Johnson, 1990) and lake trout (Ross and Watten, 1998). Effects of exercise on oxygen consumption reflect increased white muscle activity (Nahhas et al., 1982), improvements in cardiac output and enhanced oxygen carrying capacity of the blood (Woodward and Smith, 1985). Given that dissolved oxygen is often the first environmental variable to limit production, reduced rates of oxygen consumption can increase proportionally tank production potential at a fixed water inflow rate (Westers and Pratt, 1977; Watten, 1994). Allowable current velocities (salmonids) expressed in terms of body lengths/s decrease with increasing fish length (Youngs and Timmons, 1991):
Vsafe510.56/TL0.37. (15)
Eq. (15) predicts the measured current velocity mean (0.13m/s) is safe when fish length (TL) is greater than 2 cm. While the velocity mean is about 24 times that predicted for operation in the plug-flow reactor mode, greater velocities (m/s) may be desirable with increasing TL. Application of the principles of similitude and results of early studies of jet forced circulation suggest higher velocities could be achieved through one or more of the following: (1) reduce fixed surface area− vol-ume ratios; (2) increase water exchange rate; (3) increase jet velocity; and (4) increase number of jets (Ali and Pateman, 1981; Fox and Gex, 1956; Imam et al., 1988; Sobey and Savage, 1974). It may also be desirable to substitute the test tanks floor drains with dual-drains as described by Timmons et al. (1998). Here, solids exiting the tank are concentrated in 5 – 20% of the total discharge allowing reductions in scale of solids separation equipment sensitive to hydraulic loading such as microscreens or settling basins. Further, tank construction could be simplified by combining cell discharges in one large drain running down the longitudinal axis of the vessel. This modification requires a drain diameter and orifices sized to ensure uniform collection of water from each cell.
Acknowledgements
References
Acrivos, A., Babcock, B.D., Pigford, R.L., 1959. Flow distribution in manifolds. Chem. Engng. Sci. 10, 112 – 124.
Ali, K.H.M., Pateman, D., 1981. Prediction of the circulation in reservoirs. Proc. Instm. Civ. Engrs. 2, 427 – 461.
American Public Health Association (APHA), American Water Works Association & Water Pollution Control Federation. 1989. Standard methods for the examination of water and wastewater (17th edn). American Public Health Association, New York, Section 4.2 – 4.6.
Barnes, M.E., Sayler, W.A., Cordes, R.J., 1996. Baffle usage in covered raceways. Progress. Fish-Cultur. 58, 286 – 288.
Besner, M., Smith, L.S., 1983. Modification of swimming mode and stamina in two stocks of coho salmon (Oncorhynchus kisutch) by differing levels of long-term continuous exercise. Can. J. Fish. Aquat. Sci. 40, 933 – 939.
Boerson, G., Westers, H., 1986. Waste solids control in hatchery raceways. Progress. Fish-Cultur. 48, 151 – 154.
Burley, R., Klapsis, A., 1985. Flow distribution studies in fish rearing tanks. Part 2-Analysis of hydraulic performance of 1 m square tanks. Aquacult. Engng. 4, 113 – 134.
Burrows, R.E., 1969. The influence of fingerling quality on adult salmon survivals. Trans. Am. Fish. Soc. 98, 777 – 784.
Burrows, R.E., Chenoweth, H.H., 1955. Evaluation of three types of fish rearing ponds. U.S. Fish and Wildlife Service, Research Report, Washington, DC, Report No. 39.
Burrows, R.E., Chenoweth, H.H., 1970. The rectangular circulating rearing pond. Progress. Fish-Cultur. 32, 67 – 80.
Chen, S., 1991. Theoretical and experimental investigation of foam separation applied to aquaculture, Ph.D. dissertation, Cornell University, Ithaca, New York.
Danckwerts, P.V., 1953. Continuous flow systems-distribution of residence times. Chem. Engng. Sci. 2, 1 – 18.
Fox, E., Gex, V., 1956. Single-phase blending of liquids. AIChE 4, 539 – 544.
Imam, E.H., Khalifa, A., McCorquodale, J.A., 1988. Optimal jet-mixer for shallow basins. J. Hydraul. Engng. 114, 1398 – 1415.
Kindschi, G.A., Thompson, R.G., Mendoza, A.P., 1991. Use of raceway baffles in rainbow trout culture. Progress. Fish-Cultur. 53, 97 – 101.
Larmoyeux, J.D., Piper, R.G., Chenoweth, H.H., 1973. Evaluation of circular tanks for salmonid production. Progress. Fish-Cultur. 35, 122 – 131.
Leon, K.A., 1986. Effects of exercise on feed consumption, growth, food conversion, and stamina of brook trout. Progress. Fish-Cultur. 48, 43 – 46.
Levenspiel, O., 1979. The Chemical Reactor Omnibook. Oregon State University Book Stores, Corvallis, OR.
Nahhas, R., Jones, N.W., Goldspink, G., 1982. Some aspects of sustained training of rainbow trout, Salmo gairdneriRichardson. J. Fish Biol. 20, 351 – 358.
Peterson, E.L., 1999. Benthic shear stress and sediment condition. Aquacult. Engng. 21, 85 – 111. Piper, R.G., McElwain, I.B., Orme, L.E., McCraren, J.P., Fowler, L.G., Leonard, J.R., 1982. Fish
Hatchery Management. U.S. Fish and Wildlife Service, Washington, DC.
Ross, R.M., Watten, B.J., 1998. Importance of rearing-unit design and stocking density to the behavior, growth and metabolism of lake trout (sal6elinus namaycush). Aquacult. Engng. 19, 41 – 56. Ross, R.M., Watten, B.J., Krise, W.F., DiLauro, M.N., 1995. Influence of tank design and hydraulic
loading on the behavior, growth, and metabolism of rainbow trout (Oncorhynchus mykiss). Aquacult. Engng. 14, 29 – 47.
Sobey, R.J., Savage, S.B., 1974. Jet forced circulation in water-supply reservoirs. J. Hydraul. Div. Am. Soc. Civ. Engrs. 100, 1809 – 1828.
Stickney, R.R., 1979. Principles of Warm Water Aquaculture. Wiley Interscience, New York. Timmons, M.B., Summerfelt, S.T., Vinci, B.J., 1998. Review of circular tank technology and
manage-ment. Aquacult. Engng. 18, 51 – 69.
Totland, G.K., Kryvi, H., Jodestol, K.A., Christiansen, E.N., Tangeras, A., Slinde, E., 1987. Growth and composition of the swimming muscle of adult Atlantic salmon (Salmo salarL.) during long-term sustained swimming. Aquaculture 66, 299 – 313.
Van Der Hegge Zijnen, B.G., 1951. Flow through uniformly tapped pipes. App. Sci. Res. A3, 144 – 162. Watten, B.J., 1994. Aeration and oxygenation. In: Timmons, M.B., Losordo, T.M. (Eds.), Aquaculture
Water Reuse Systems: Engineering Design and Management. Elsevier, New York, pp. 173 – 208. Watten, B.J., Beck, L.T., 1987. Comparative hydraulics of a rectangular cross-flow rearing unit.
Aquacult. Engng. 6, 127 – 140.
Watten, B.J., Johnson, R.P., 1990. Comparative hydraulics and rearing trial performance of a produc-tion scale cross-flow rearing unit. Aquacult. Engng. 9, 245 – 266.
Westers, H., Pratt, K.M., 1977. Rational design of hatcheries for intensive salmonid culture, based on metabolic characteristics. Progress. Fish-Cultur. 39, 157 – 165.
Wickins, J.F. 1980. Water quality requirements for intensive aquaculture: a review. Symposium on New Developments in the Utilization of Heated Effluents and Recirculation Systems for Intensive Aquaculture. EIFAC, 11th Session. Stavanger, Norway, 28 – 30 May, 1980.
Woodward, J.J., Smith, L.S., 1985. Exercise training and the stress response in rainbow trout,Salmo gairdneriRichardson. J. Fish Biol. 26, 435 – 447.
Youngs, W.D., Timmons, M.B., 1991. A historical perspective of raceway design. Engineering aspects of intensive aquaculture. Northeast Regional Aquacultural Engineering Service. NRAES 49, 160 – 169.
.