Aquacultural Engineering 22 (2000) 213 – 224
Biofilm characteristics as affected by sand size
and location in fluidized bed vessels
Teresa K. Nam
a, Michael B. Timmons
a,*,
Carlo D. Montemagno
a, Scott M. Tsukuda
baDepartment of Agricultural and Biological Engineering,Cornell Uni6ersity,Ithaca,NY14853,USA bFreshwater Institute,Shepherdstown,WV25443,USA
Received 5 December 1997; accepted 21 January 2000
Abstract
Biofilm structure was quantitatively analyzed to detect differences in biofilm structure due to sand size (effective diameterD10of 0.23 and 0.60 mm) and location within a fluidized-sand
filter vessel. Laser scanning confocal microscopy and 3D image analysis were used to quantify biofilm volume per unit sand area, biofilm surface area per unit sand area, and biofilm surface area per biofilm volume. Biofilms from reactor vessels using 0.60 mm sand size had thin, smoother biofilms which was attributed to higher shear environments, in contrast to the thick, rough, porous films that were measured on the 0.23 mm sand samples. The thicknesses of the biofilms in the small sand reactors were affected by their location within the reactor vessel, i.e. films from the base of the reactor in the more highly turbulent zone had thinner biofilms than films on sands that were taken from a higher less turbulent location in the reactor vessel. A major finding of this study was that biofilm surface area per biofilm volume remained fairly constant regardless of sand size and sampling location. © 2000 Elsevier Science B.V. All rights reserved.
Keywords:Biofilm structure; Fluidized sand filter; Particle size
www.elsevier.nl/locate/aqua-online
1. Introduction
Fluidized sand beds are rapidly gaining acceptance in commercial large scale aquaculture applications primarily due to their cost advantage. Since the units
* Corresponding author. Tel.: +1-607-2552801; fax:+1-607-2554080. E-mail address:[email protected] (M.B. Timmons)
consist of low cost reactor vessels, conventional plumbing components, and sands — these units can be fabricated on-site at a substantially lower cost than competing technologies (Summerfelt and Wade, 1997; Timmons and Summerfelt, 1998). Designing fluidized sand beds is very dependent upon choice of sand size as the size of the sand defines the up-flow velocity required to expand the sand bed to some pre-selected expansion percentage. Generally, Summerfelt and Wade (1997) recom-mend expansion percentages of 50% in order to ensure that the larger sands are fluidized and do not form static pools of sand at the base of the reactor vessel that can go anoxic. Other than the mechanics of reactor vessel design and overall nitrification rates achieved by fluidized sand beds, there is minimal if any informa-tion on actual biofilm structure as impacted by the choice of sand size and the associated fluidization velocities. For example, the upflow velocity required to expand a bed by 50% for an effective diameter, D10, sand size of 0.23 mm is 0.82
cm/s versus 2.94 cm/s for a D10 sand size of 0.60 mm. Clearly, the turbulence and
shearing action that the fluidized sand particles are subjected to would be dramat-ically different. Whether or not this different fluid environment and the resulting mechanical shear forces have any impact on the physical properties of the biofilm has never been described for aquaculture type waste water which is characterized by extremely low ammonia levels in contrast to municipal waste waters.
Jewell (1990) provides a lengthy discourse on biofilm structure and the impact of sand size on theoretical biomass that can be supported by a solid substrate particle. In effect, biofilm characteristics are typically reported based upon change in volume of a substrate with and without biofilm and then calculating the ‘average’ thickness of biofilms based upon changes in volume. This of course assumes that biofilm is uniform in its attachment and growth over the entire surface of the substrate particle. To our knowledge, there has been no published data that describes biofilm characteristics quantitatively as impacted by sand size and fluidization characteris-tics for low waste water strength influents such as occur in aquaculture.
We do know from previous studies that the biofilm is actually a complex structure consisting of bacterial clusters, extracellular polymers, water channels, and voids (Lawrence et al., 1991; Keevil and Walker, 1992; Korber et al., 1993; Stewart et al., 1993; de Beer et al., 1994; Wolfaardt et al., 1994; de Beer and Stoodley, 1995). It has been hypothesized that biofilm structure reflects the adaptation of unicellular organisms to physical, chemical, and communal circumstances on surfaces (Costerton et al., 1995). van Loosdrecht et al. (1997) theorized that biofilm structure is largely determined by the substrate concentration gradient at the biofilm – liquid interface and the detachment forces working on the biofilm. Jewell (1990) assumed a maximum substrate diffusion into a biofilm of 20 mm. This assumption could be dramatically tempered depending upon the actual structure of the biofilm.
215 T.K.Nam et al./Aquacultural Engineering22 (2000) 213 – 224
provide insight to how biofilm structure develops and adapts to certain environ-mental conditions within fluidized sand filters.
2. Materials and methods
2.1.Reactor set-up
Twelve experimental fluidized sand filters were constructed using clear acrylic cylinders each 2.5 m tall, 16 cm diameter. These units were operated in parallel with an established fluidized sand filter 2.5 m tall, 1.5 m diameter used as the biological filter system to culture rainbow trout in a cold water (14 – 17°C) system. A mechanical screen filter (110 mm) removed solids before wastewater treatment by biofilters. Further solids removal occurred by a second mechanical screen (80mm) following treatment by the large biofilter. Low-head oxygen units were used to maintain the culture tanks above 10 ppm at all times (see Table 1 for all influent conditions).
Six of the previously mentioned twelve reactor vessels (biofilters) were used for this experiment. Water was introduced at the bottom of the reactor vessels by a 2.54 cm SCH-40 PVC pipe located down the center of the column. Wastewater was discharged in a downward direction opposite to the direction of outflow from the vessel approximately 8 cm above a concrete cup formed into the reactor vessel cylinder that was 10.5 cm inside diameter and had an 8 cm inside cavity depth. Each experimental filter used FilterSil sand (Unimin, New Canaan, CT) with effective diameter sand sizes (D10) of 0.23 or 0.60 mm. The effective diameter is
defined as the opening size which will pass only the smallest 10% by weight of the total material (Summerfelt and Cleasby, 1996). The uniformity coefficient for sands withD100.23 and 0.60 mm were 1.8 and 1.4, respectively. Each filter containing one
Table 1
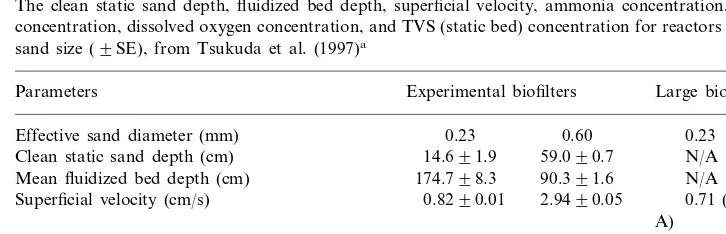
The clean static sand depth, fluidized bed depth, superficial velocity, ammonia concentration, nitrite concentration, dissolved oxygen concentration, and TVS (static bed) concentration for reactors of each sand size (9SE), from Tsukuda et al. (1997)a
Parameters Experimental biofilters Large biofilter
0.23
Effective sand diameter (mm) 0.23 0.60
N/A Clean static sand depth (cm) 14.691.9 59.090.7
90.391.6 Effluent ammonia concentration (mg/l)
0.08590.008
0.13790.012 0.02490.013 Effluent nitrite concentration (mg/l)
7.092.0 10.2890.10
6.1890.27 Effluent dissolved oxygen concentration (mg/l)
35 52190.06 189590.02 N/A Total volatile solids (mg/l static bed height)
aInfluent conditions all reactors (mg/l): 0.5590.03 ammonia; 0.06390.005 nitrite; 10.7690.10
of the two sand sizes was replicated three times, totaling six experimental columns. The large 1.5 m diameter biofilter consisted of 0.23 mmD10 sand.
2.2.Reactor operation and performance
Clean static sand depth, fluidized bed height, flow rates, and water quality measurements were reported during weeks 35 – 42 of reactor operation and are listed in Table 1. Further information on biofilter set-up, operation, and perfor-mance can be found in Tsukuda et al. (1997). Note that the intent of this paper is to focus on biofilm characteristics and not performance.
2.3.Biofilm sampling, preparation,and imaging
A one-time collection of sand samples was taken during week 35 from each of the 0.23 and 0.60 mm sand reactor vessels to compare biofilm from small and large sand reactors. Samples were taken 20.5 cm (low) and 70.5 cm (high) from the bottom of the reactor to compare biofilm from low and high locations in a biofilter. A tube attached to a syringe was lowered to each sampling location to collect particles. Samples were placed in 15 ml glass vials and immediately preserved in 3.7% methanol free ultra-pure formaldehyde (CH3OH; 16%; Polyscience,
Warring-ton, PA) with 50 mM HEPES buffer (N[2-Hydroxyethyl]piperazine-N -[2-ethane-sulfonic acid]; 99.5%; Sigma, St. Louis, MO). Pure formaldehyde was chosen since it does not cause osmotically-induced swelling and lysis and the fixative penetrates specimens rapidly (Hayat, 1981).
Several sand particles were placed on a sterile slide and rinsed with 0.1 ml of 50 mM HEPES buffer to remove excess fixatives. Samples were stained with sterile 4 mM acridine orange base (C17H19N3; 95%; Sigma, St. Louis, MO) for 5 min.
Acridine orange is a positively charged fluorescent dye that binds well to DNA and RNA. Due to its low binding specificity, acridine orange is also capable of binding to dense extracellular polymers. Samples were rinsed with a sterile 0.1 M NaCl and 50 mM HEPES buffer wash to remove excess stains.
Each biofilm particle was placed in 1 mm deep, 20 mm diameter imaging chamber (Grace Biolabs, Sunriver, OR). Anti-fading reagent DABCO was used to reduce photobleaching of acridine orange during the laser scanning confocal microscopy process. Ten microliters of 0.1 M DABCO (1,4-Diazabicyclo [2,2,2] octane; 99.9%; SIGMA, St. Louis, MO) in 50 mM HEPES buffer was applied to the particle being scanned and glycerin (CH2OHCHOHCH2OH; 99.7%; Fisher
Chemical, Springfield, NJ) was added as the mounting media. Minimal photo-bleaching was observed during the course of imaging.
217 T.K.Nam et al./Aquacultural Engineering22 (2000) 213 – 224
Laser scanning confocal microscopy was capable of producing crisp 2D images of thick specimens at various depths by rejecting out of focus information. A computer displayed the image by mapping measured fluorescence intensity to pixel brightness. Control of imaging depth was achieved by a motor-driven focusing system. A 16×, 0.50-numerical aperture oil immersion plan neofluor objective lens with a working distance of 0.22 mm provided a pixel resolution of 0.972×0.972 mm2. Each 2D image contained 768×512 pixels. A series of 2D images (ranging from 25 to 129 slices, depending on film thickness and particle size) at incremental depths of 0.98 mm were acquired for each biofilm coated particle. Therefore, stacked 2D images rendered a 3D image of biofilm with a voxel (analogous to pixel except in 3D) resolution of 0.972×0.972×0.98 mm3.
Given the thickness of biofilm covered sand particle exceeded the 0.22 mm working distance of the objective lens, the microscope imaged the upper portion of biofilm coated sand particles. Images were continually taken at deeper depths of one biofilm coated particle until the user could distinctly recognize a circular black void (sand particle) surrounded by fluorescing biofilm. No signals were detected from the sand particle since fluorescence of sand was minimal and light did not pass through the sand particle.
2.4.Image processing and analysis
All images were processed and analyzed on a SGI ONYX Workstation (Santa Clara, CA). Biofilm surface area and volume were measured for a defined sand surface and reported as biofilm volume per unit sand area and biofilm surface area per unit sand area to standardize measurements.
The sand surface area used to standardize the biofilm characterizations on a per unit area basis was determined in the last 2D slice of a 3D image where the sand particle created a distinct black void. A circle to determine area was manually drawn within the perimeter of the sand particle in the last 2D image. This circular area was the projected area of the sand surface of the biofilm analyzed. The calculated sand surface area neglected surface irregularities of the sand particle. The sand area was calculated by the sum of the number of pixels in the circular area multiplied by 0.945 mm2 (area of a pixel). Voxels directly above and within the projected area retained their original grayscale intensities whereas other voxels were set to zero to eliminate voxels representing biofilm not attached to the defined sand surface.
A program was written using IDL software (Research Systems, Boulder, CO) to determine which voxels in a 3D image represented dense slime and bacterial clusters in biofilms. The program was based on the intermean thresholding algorithm (Ridler and Calvard, 1978).
Visualiza-tion Systems, Waltham, MA) generated an isosurface connecting the surface voxels. The generated isosurface had an associated list of coordinates of vertices of a polyhedron with triangular facets which are determined by the tessellation of values of the surrounding 26 voxels (Montemagno and Gray, 1995). Summation of these triangular areas was a measure of biofilm surface area.
2.5.Statistical analysis
Analysis of variances (ANOVA) was used to detect differences in biofilm structure due to sand sizes (0.23 versus 0.60 mm) and physical location within the reactor vessel (high versus low). The biofilm characteristics of interest were volume per unit sand area, surface area per unit sand area, and surface area per biofilm volume. Analysis of variances were performed on all three parameters to detect significance due to reactor variability and depth for a particular sand size. Data from reactors of the same sand size was grouped and additional ANOVA tests were performed to detect significance of sand size on measured parameters. All tests of significance were performed at an alpha level of 0.05.
Stabilized variance is a necessary requirement for ANOVA tests. However, residual versus fitted plots of biofilm volume per unit sand area and biofilm surface area per unit sand area revealed increasing variance with increasing measurement values. Similar patterns were observed by Gjaltema et al. (1997). Snedecor and Cochran (1989) suggest using a natural log transformation as an appropriate method to stabilize variance in these cases for ANOVA tests. Residual versus fitted plots and linear normality plots of transformed data confirmed stabilized variance. No transformation was necessary with biofilm surface area per biofilm volume since raw data was normally distributed with a stabilized variance.
3. Results
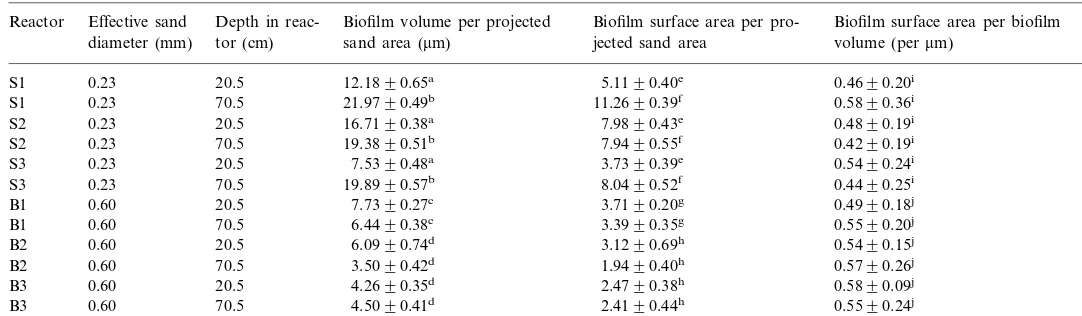
The means and standard errors of biofilm volume per unit sand area, biofilm surface area per unit sand area, and biofilm surface area per biofilm volume according to reactor, sand size, and sampling location are given in Table 2.
3.1.Effect of sand size
219
Means and standard errors of biofilm volume per projected sand area, biofilm surface area per projected sand area, and biofilm surface area per biofilm volume for small and big sand reactors at low and high column depths
Reactor Effective sand Depth in reac- Biofilm volume per projected Biofilm surface area per pro- Biofilm surface area per biofilm volume (permm)
3.2.Effect of sampling location
Biofilm volume per unit sand area (P-value 0.004) and biofilm surface area per unit sand area (P-value 0.004) were statistically different at low locations than high locations for small sand reactors. In large sand reactors, depth had no effect on biofilm volume per unit sand area (P-value 0.149) or biofilm surface area per unit sand area (P-value 0.150). Biofilm surface area per biofilm volume was not affected by sampling depth for either small (P-value 0.572) or large (P-value 0.521) sand reactors.
3.3.Effect of reactor 6ariability
For small sand reactors, biofilm volume per unit sand area (P-value 0.105), biofilm surface area per unit sand area (P-value 0.065), and biofilm surface area per biofilm volume (P-value 0.248) did not significantly vary from one replicate reactor to another. In large sand reactors, biofilm volume per unit sand area (P-value 0.002) and biofilm surface area per unit sand area (P-value 0.003) were statistically different within replicate reactors. Of the large sand reactors, samples from one reactor had slightly higher biofilm volume and surface area per unit sand area (7.09, se=0.32 versus 4.79, se=0.73 and 4.38, se=0.38mm for biofilm volume per unit sand area and 3.55, se=0.28 versus 2.53, se=0.67 and 2.44, se=0.40 for biofilm surface area per unit sand area), thereby causing a significant effect due to reactor variability. Despite these slight variations in large sand reactors, it is interesting to note that biofilm surface area per biofilm volume (P-value 0.356) did not vary significantly within replicates of large sand reactors.
4. Discussion
Zhang and Bishop (1994) measured mean pore radius of 1.7 – 2.7mm in top layers and 0.3 – 0.4 mm in bottom layers of heterotrophic biofilms. Typical sizes of prokaryotes range from 1 to 5mm (Brock et al., 1994). The microscope lens used had to balance the goals of capturing images of an area representative of the entire biofilm while maintaining a high resolution to detect intricate details within the biofilm. The field of view in our study covered a 736.8×497.7 mm2 imaging area and images had a voxel resolution of 0.93 mm3. Therefore, our technique was limited to detecting macro-pores, channels, and cell clusters while neglecting micro-pores and other smaller structures.
221 T.K.Nam et al./Aquacultural Engineering22 (2000) 213 – 224
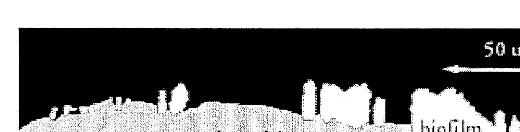
Fig. 1. Cross section of a 3D biofilm image from a small sand reactor (Deff, 0.23 mm). Sand particle in
image was manually drawn and biofilm was set to a common pixel intensity.
Fig. 2. Cross section of a 3D biofilm image from a large sand reactor (Deff, 0.60 mm). Sand particle in
image was manually drawn and biofilm was set to a common pixel intensity.
tions agreed with Zahid and Ganczarczyk (1994) and van Loosdrecht et al. (1995) who reported a decrease in biofilm roughness with thinner biofilm.
4.4.Biofilm surface area per biofilm 6olume
The magnitude of biofilm surface area per biofilm volume in small sand reactors was very similar, though statistically different, to those measured in large sand reactors (0.49, se=0.27 versus 0.55, se=0.20 permm). Furthermore, biofilm surface area per biofilm volume was not statistically different at different sampling locations for both sand size reactors. Therefore thick, rough, porous biofilms (Fig. 1) maximized biofilm surface area on a volume basis to the same degree as thinner, smoother biofilms (Fig. 2). Also, note that the biofilm thickness that can be estimated from Figs. 1 and 2 are also consistent with the 20mm thickness that Jewell (1990) assumed as the maximum depth for nutrient transport across a biofilm.
223 T.K.Nam et al./Aquacultural Engineering22 (2000) 213 – 224
4.5.Variability within replicates of large sand reactors
Our measurement technique may have been sensitive to a lack of viewing area relative to the total sand particle area for the large sands. As can be seen in Fig. 2, the sand particle is much less populated with biofilm than the smaller sands (Fig. 1). There would clearly be more variability in measurements taken on these large sands. Thus, our limited field of view may have prevented capturing images large enough to be totally representative of the entire biofilm on the particle thus contributing to the higher variability in these measurements from sand to sand measurement. The higher shear on these large sand particles would also lead to more variability in the nature of the biofilms present on individual particles and portions of the sand particles imaged. This may explain why we measured a higher biofilm volume per unit sand area and biofilm surface area per sand area measure-ments in one of the large sand reactors while we had no statistical variability among reactors in the small sand vessels.
Acknowledgements
We wish to thank Dr William Ghiorse for his helpful suggestions and his staff for instruction with epifluorescence and confocal microscopy. Additional thanks to Dr Charles McCulloch who provided invaluable advice on statistics.
References
Bouwer, E.J., 1987. Theoretical investigations of particle deposition in biofilm systems. Water Res. 21, 1489 – 1498.
Brock, T.D., Madigan, M.T., Martinko, J.M., Parker, J., 1994. Biology of Microorganisms, seventh ed. Prentice Hall, New Jersey, 909 pp.
Costerton, J.W., Lewandowski, Z., Caldwell, D.E., Korber, D.R., Lappin-Scott, H.M., 1995. Microbial biofilms. Annu. Rev. Microbiol. 49, 711 – 745.
de Beer, D., Stoodley, P., Roe, F., Lewandowski, Z., 1994. Effects of biofilm structures on oxygen distribution and mass transport. Biotech. Bioeng. 43, 1131 – 1138.
de Beer, D., Stoodley, P., 1995. Relation between the structure of an aerobic biofilm and transport phenomena. Water Sci. Technol. 32, 11 – 18.
Gjaltema, A., van Loosdrecht, M.C.M., Heijnen, J.J., 1997. Abrasion of suspended biofilm pellets in airlift reactors: Effect of particle size. Biotech. Bioeng. 55, 206 – 215.
Hayat, M.A., 1981, Fixation for Electron Microscopy. Academic Press, New York, 501 pp.
Jewell, W.J., 1990. Fundamentals and advances in expanded bed reactors for wastewater treatment. In: Tyagi, R.D., Vembu, K. (Eds.), Wastewater Treatment by Immobilized Cells. CRC Press, Florida, pp. 223 – 252 (Chapter 9).
Keevil, C.W., Walker, J.T., 1992. Nomarski DIC microscopy and image analysis of biofilms. Bin. Comput. Microbiol. 4, 93 – 95.
Korber, D.R., Lawrence, J.R., Hendry, M.J., Caldwell, D.E., 1993. Analysis of spatial variability within mot+ and mot− Pseudomonas fluorescens biofilms using representative elements. Biofouling 7,
Lawrence, J.R., Korber, D.R., Hoyle, B.D., Costerton, J.W., Caldwell, D.E., 1991. Optical sectioning of biofilms. J. Bacteriol. 173, 6558 – 6567.
Montemagno, C.D., Gray, W.G., 1995. Photoluminescent volumetric imaging: a technique for the exploration of multiphase flow and transport in porous media. Geophys. Res. Lett. 22 (4), 425 – 428. Ridler, T.W., Calvard, S., 1978. Picture thresholding using an iterative selection method. IEEE Trans.
Syst. Man. Cybern. 8, 630 – 632.
Snedecor, G.W., Cochran, W.G., 1989. Statistical Methods, eight ed. Iowa State University Press, Ames, 503 pp.
Stewart, P.S., Peyton, B.M., Drury, W.J., Murga, R., 1993. Quantitative observations of heterogeneities inPseudomonas aeruginosabiofilms. Appl. Environ. Microbiol. 59, 327 – 329.
Summerfelt, S.T., Wade, E.M., 1997. Recent advances in water treatment processes to intensify fish production in large recirculating systems. In: Timmons, M.B., Losordo, T. (Eds.), Proceedings of the Aquacultural Engineering Society Technical Sessions at the Fourth International Symposium on Tilapia in Aquaculture, 9 Nov – 12 Nov 1997, Northeast Regional Agricultural Engineering Service, Orlando, Florida, pp. 350 – 367.
Summerfelt, S.T., Cleasby, J.L., 1996. A review of hydraulics in fluidized-sand bed biological filters. Trans. ASAE. 39, 1161 – 1173.
Tsukuda, S.M., Hankins, J.A., Marshall, C.P., Summerfelt, S.T., Bullock, G.L., Sawyer, T.K., 1997. Effects of sand size on fluidized-bed biofilter performance in cold-water systems. In: Timmons, M.B., Losordo, T. (Eds.), Recent Advances in Aquacultural Engineering: Proceedings of the Aquacultural Engineering Society Technical Sessions at the Fourth International Symposium on Tilapia in Aquaculture, 9 Nov – 12 Nov 1997, Northeast Regional Agricultural Engineering Service, Orlando, Florida, pp. 368 – 380.
Timmons, M.B., Summerfelt, S.T., 1998. Application of fluidized-sand biofilters to aquaculture. In: Libey, G.S., Timmons, M.B. (Eds.), Recent Advances in Aquacultural Engineering: Proceedings of the Second International Conference on Recirculating Aquaculture, 16 July – 19 July 1998, Virginia Polytechnic Institute and State University, Roanoke, Virginia, pp. 342 – 354.
van Loosdrecht, M.C.M., Eikelboom, D., Gjaltema, A., Mulder, A., Tijhuis, L., Heijnen, J.J., 1995. Biofilm structures. Water Sci. Technol. 32, 35 – 43.
van Loosdrecht, M.C.M., Picioreanu, C., Heijnen, J.J., 1997. A more unifying hypothesis for biofilm structures. FEMS Microbiol. Ecol. 24, 181 – 183.
Wolfaardt, G.M., Lawrence, J.R., Robarts, R.D., Caldwell, S.J., Caldwell, D.E., 1994. Multicellular organization in a degradative biofilm community. Appl. Environ. Microbiol. 60, 434 – 446. Zahid, W., Ganczarczyk, J., 1994. A technique for characterization of RBC biofilm surface. Water Res.
28, 2229 – 2231.
Zhang, T.C., Bishop, P.L., 1994. Density, porosity, and pore structure of biofilms. Water Res. 28, 2267 – 2277.