* Corresponding author. Phone/ Fax +62-31- 5922427 Email address : [email protected] (G. Supriyanto)
A NOVEL METHOD OF THE HYDRIDE SEPARATION FOR THE DETERMINATION OF
ARSENIC AND ANTIMONY BY AAS
Ganden Supriyanto
a,*, and Jürgen Simon
ba
Department of Chemistry, Airlangga University Surabaya, Kampus C Unair, Jl. Mulyorejo Surabaya Indonesia
b
Institute of Chemistry, Free University of Berlin, Fabeckstrasse 34-36, 14195 Berlin Germany
Received 9 March 2006; Accepted 1 June 2006
ABSTRACT
A novel method is proposed for the hydride separation when determinining of arsenic and antimony by AAS. A chromatomembrane cell was used as preconcentration-, extraction- and separation-manifold instead of the U-tube phase separator, which is normally fitted in continuous flow vapour systems generating conventionaly the hydrides. The absorbances of the hydrides produced were measured by an atomic absorption spectrophotometer at 193.7 nm and 217.6 nm. Under optimized analytical conditions, the calibration plot for arsenic was linear from 50 to 500 ng.mL-1 (r2 = 0.9982). The precision for three subsequent measurements of 500 ng.mL-1 arsenic gave rise to a relative standard deviation of 0.4%. The detection limit was 15 ng.mL-1, which is much lower compared with that of the conventional hydride system (2000 ng.mL-1). A similar result was observed in case of antimony: the detection limit was 8 ng.mL-1 when the proposed method was applied. Consequently, the sensitivity of the novel method surpasses systems with conventional hydride generation, i.e. the precision and the acuracy increase whereas the standard deviation and the detection limit decrease. The proposed method was applied in pharmacheutial analysis and the certified As-content of a commercial product was very sufficiently confirmed.
Keywords:Chromatomembrane Cell, Hydride separation, Arsenic detection, Antimony detection, AAS
INTRODUCTION
The role of arsenic as a toxic element is well investigated. Evidence has been presented that low levels of arsenic may be easily tolerated from the human body, whereas higher concentrations are toxic. The pathological effects of oral exposure include particularly cardiovascular, dermatological, haematological, hepatic and renal illness. Arsenic can also cause cancer of the genial and urinary apparatus, the respiratory system and the skin [1]. Because of its toxicity and cumulative effect in the body, arsenic presents a health problem when it occurs in food, water and environment, even in minute amounts. In contrary, very little attention has been paid to antimony, mainly because it is not recognized as having nutritional significance and its contents in most materials are very low. Nevertheless, compounds of antimony are moderately toxic to most organisms, Sb(III) compounds being more toxic than that of Sb(V) compounds (similarly to the corresponding arsenic compounds). Exposure to antimony causes cellular damages in the lungs, heart and kidneys but the toxicity mechanisms are still not well known [2]. A number of sensitive analytical methods are available for the determination of arsenic and antimony. Some of the commonly used methods are anodic stripping voltammetry, inductively coupled plasma atomic emission spectrometry (ICP-AES), graphite-furnace
atomic absorption spectrometry (GFAAS), electrothermal atomic absorption spectrometry (ETAAS), neutron activation analysis, and hydride generation atomic absorption spectrometry (HGAAS) [3].
Hydride generation coupled with atomic absorption spectroscopy (AAS) has become one of the most powerful and well-established techniques for the determination of arsenic and antimony. Hydride generation techniques offer unique advantages including elimination of the nebulizer need on enhancement of analyte transport efficiency (approaching 100%), reduction of matrix effects and the presentation of a homogeneous vapour to the atomizer [4]. A variety of reactions have been used to convert the analyte in solution in to the hydride. Huge numbers of publications [5-9] regarding the determination of arsenic and antimony by hydride generation coupled with AAS have been published in environmental and biological field.
of their smaller dead volumes than U-tube separators [10]. Despite the higher sensitivities claimed, most of these separators show the best performance with high acid concentrations, producing large amounts of H2 at
the same time when in contact with the tetra hydroborate solution.
The lack of separation efficiency and preconcentration in conventional hydride separation systems, however, cause poor sensitivities, require higher quantities of chemicals and reagents, reduce the sampling rates and enhance the response times. Hence, the development of a novel method of hydride separation is still sought for the determination of arsenic and antimony by AAS.
Our group introduced the Chromatomembrane Cell (CMC) as a powerful device for the analyteseparation, -extraction, and –preconcentration into the flow injection analysis [11]. The CMC especially proved to be advantageous in case of analyte transfer between a liquid and a gaseous phase in combination with a preconcentration up to 1:100 if required. We recently published procedures for the automated VOC and EOX determination [12] and NO2 in ambient air in a µ-FIA
system with photometric detection [13].
The CMC consists of a rectangular block of the hydrophobic PTFE with two types of pores, micropores and macropores. Polar liquids fill the macropores whereas the micropores remain available for gases or non polar liquids only. The capillary pressure of polar liquids prevent their penetration into the micropores [14]. Micropores PTFE membranes fitted at the surface of the biporous PTFE block are used as wales barriers, so that an independent inlet and outlet of the two phases is made possible. Their independent fluxes within the biporous PTFE block are realized by the cell design and regulated by the flux rates adopted to the requirements of the analytical procedures under study.
The aim of this study was to develop a novel method for the determination of arsenic and antimony by using a chromatomembrane cell as a device for preconcentration, extraction and separation of the hydrides in continuously hydride generating system with AAS as detector. In order to evaluate the performance of the chromatomembrane cell, the proposed method was then compared with a conventionally working hydride system without using chromatomembrane cell using the same atomic absorption spectrophotometer as detector
EXPERIMENTAL SECTION
Apparatus
Atomic absorption measurements were performed with a Pye-Unicam, Model SP9 Atomic Absorption Spectrophotometer (Philips GmbH, Kassel, Germany), equipped with a heated quartz cell (1 cm i.d, 12 cm length), fitted with arsenic and antimony hollow cathode
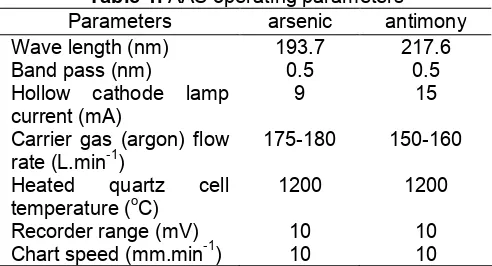
Table 1.AAS operating parameters
Parameters arsenic antimony
Wave length (nm) 193.7 217.6
Band pass (nm) 0.5 0.5
Hollow cathode lamp current (mA)
9 15
Carrier gas (argon) flow rate (L.min-1)
175-180 150-160
Heated quartz cell temperature (oC)
1200 1200
Recorder range (mV) 10 10
Chart speed (mm.min-1) 10 10
lamp and deuterium lamp for background correction, interfaced with a Pye-Unicam SP9 computer (Phillips, Germany), and connected to a PM 8252A two-line data recorder and a linear chart recorder (Phillips, Germany). A Pye-Unicam PU9060 Continuous Flow Vapour System (England) was used for generating the hydrides. A Reglo Analog MS 2/8 peristaltic pump (ISMATEC, Germany) was used for pumping sample, reagent and acid solution. Teflon tubing (0.8 mm i.d) was used for transferring sample, reagent and acid solution. A 4-holes chromatomembrane cell was used for continuous separation, extraction and preconcentration of hydrides. Table 1 lists the operating parameters used for AAS.
Reagents and chemicals
for hydride gases produced in the chromatomembrane cell.
Methods
Stabilization of the chromatomembrane cell
Stabilization of the chromatomembrane cell consists of three steps. First, polar phase (liquid) was pumped through the cell for 4-5 hours. Second, argon gas (1 bar), which corresponds to 0.3 mL. min-1, was passed through the cell for 4-5 hours. Finally, gas and liquid were passed through the cell approximately 10 hours. Stabilization has been reached, if two phases flow independently, i.e, polar phase (liquid) flows through the outlet of liquid phase (the macromembrane) and polar phase (gas) flows through the outlet of non-polar/gas phase (the micromembrane).
Flow injection procedure
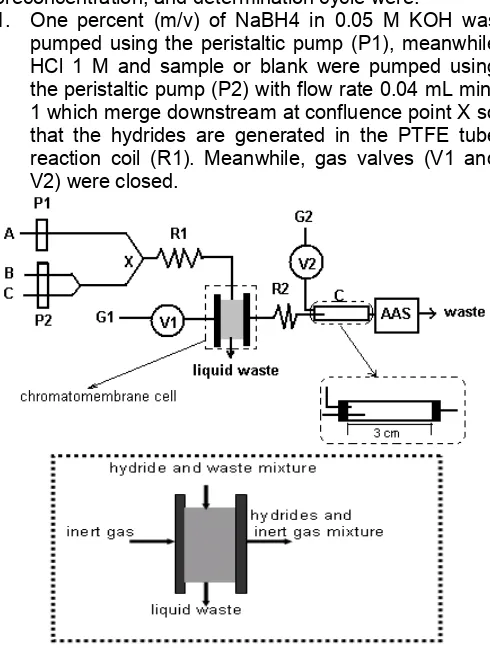
Flow injection system for atomic absorption spectrophotometeric determination of arsenic and antimony is shown in Fig 1. The sequence of steps necessary to perform a total extraction, preconcentration, and determination cycle were:
1. One percent (m/v) of NaBH4 in 0.05 M KOH was pumped using the peristaltic pump (P1), meanwhile HCl 1 M and sample or blank were pumped using the peristaltic pump (P2) with flow rate 0.04 mL min-1 which merge downstream at confluence point X so that the hydrides are generated in the PTFE tube reaction coil (R1). Meanwhile, gas valves (V1 and V2) were closed.
Fig 1.Schematic diagram of the flow injection system for atomic absorption spectrophotometric determination of arsenic and antimony. A, sample or standard solutions; B, 2% w/v NaBH4in 0.05 M KOH; C, 2 M HCl
2. The liquid phase (liquid waste) and the gas phase (the hydrides) passed through the chromatomembrane cell where extraction, preconcentration and phase separation were taken place. The hydrides flow to micromembrane and liquid phase (liquid waste) flowed through macromembrane (PTFE block).
3. The pumps (P1 and P2) were turned off and the
valve (V2) was closed. The hydride produced was
carried by argon (G1) with low flow rate for five
seconds and collected in gas collecting tube (C). The gas collecting tube was simply a glass tube with 3 cm long and 5 mm i.d.
4. The valve (V1) was closed. The, hydrides were
swept using argon (G2) with high flow rate to the
quartz cell in AAS. The signals were measured at 193.7 nm for arsenic and 217.6 nm for antimony. Nitrogen was used instead of argon on atomic absorption spectrophotometric determination of antimony.
5. The system was cleaned and stands ready for another extraction/preconcentration cycle. Step number 1 is repeated.
RESULT AND DISCUSSION
Optimization of The Selected Variables
The basic design of a hydride generation system in the experiments, with subsequent AAS detection, might be considered as four steps: First, generation of the hydride; second, collection of the hydride; third, transfer of the hydride; and fourth, atomization of the hydride. In order to increase the signal it is necessary to generate the hydride quickly or to collect it and then transfer it as quickly as possible to the atomizer. This minimizes dilution of the hydride by the carrier gas.
The efficiency of the hydride generation system strongly depends on the experimental conditions for the specific instrumental assembly. The procedure was optimised by an univariate approach, changing the parameters involved in hydride generation and detection in order to achieve the best possible analytical performance. These experimental parameters were length of reaction coil (R1), acid and
tetrahydroborate concentrations, carrier gas flow rate, and pre concentration time.
0
found that no effect of signals was observed when the length of reaction coil was varied (80-140 cm for arsenic and 10-40 cm for antimony). In all experiments 90 cm of the coil length (R2) was applied.
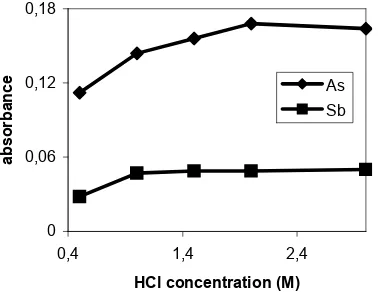
Effect of Acid Concentration
The efficiency of hydride generation of arsenic and antimony are dependent on the acidity at which the reaction is performed. In the NaBH4-acid system,
hydrochloric acid is most often used, though sulfuric acid and nitric acid are equally suitable in some instances [15]. The optimum acidity ranges appear to be dependent on the element of interest and the type of hydride generators.
The effect of acid concentration on the hydride generation was studied in the hydrochloric acid concentration range from 0.5-3 M. One hundred ng.mL-1 As (III), two minutes of preconcentration time, 1 % m/v of NaBH4 concentration, 0.04 ml min
-1
of sample, reagent,and acid flow rate, coil length (R1) 120 cm and
(R2) 90 cm, and 120-140 mL.min -1
flow rate of carrier gas were used during the experiment. Meanwhile, one minute of preconcentration time and 180-200 mL.min-1 flow rate of carrier gas were applied for Sb (III). It is apparent (Fig 2) that the profiles of the signal of As (III) and Sb (III) are similar, i.e., increase with acid concentration from 0.3 to 2 M and then relatively constant for acid concentration of 3 M. These results confirm the data obtained by Santosa [16].
Effect of Tetrahydroborate Concentration
A freshly prepared solution of NaBH4 is more
efficient and preferred for continuous flow system because introduction of a solid into reaction gives undesirable highly localized concentration. A recommended concentration range from 0.5 to 10 % m/v and stabilized by 0.1 to 2 % KOH or NaOH because NaBH4 is degraded very fast in acidic solution. The
Fig 2.Effect of acid concentration on the absorbance of arsenic
concentration of NaBH4was varied from 0.5 to 3 % m/v
and the concentration of HCl was 2 M for As (III) and 1 M for Sb (III). Meanwhile, the other parameters were fixed the same as for investigation of the effect of acid concentration.
The absorbance of As (III) increased continuously with increasing NaBH4 concentration up to 2 % m/v as
shown in Fig 3. Beyond this value, the arsine production experienced only slight variations, while Sb (III) gave a maximum absorbance at 3% m/v. Concentration of NaBH4higher than 2 % m/v offered no
practical advantages because the rapidly hydride produced and generation of H2could not be separated
from liquid phase by the chromatomembrane cell properly and the cell would be not stable. The use of relatively low concentrations of tetrahydroborate is advisable [17] that the interfering effects could be minimized.
Effect of Carrier Gas Flow Rate
Different preliminary studies were performed to evaluate the capabilities of argon and nitrogen as carrier gas to transfer produced hydrides (arsine and stibine) from the chromatomembrane cell and gas collecting tube to the atomizer. It was found that significant nonselective background absorption was observed when nitrogen was used as carrier gas for stibine. However, even with background correction, the sensitivity of the technique was very limited. Therefore, nitrogen was chosen as carrier gas for stibine.
The effect of carrier gas (argon) flow rate on arsenic determination was studied in the range 60 to 255 mL.min-1and the concentration of NaBH4 was 2%
m/v. The other parameters were fixed the same as for investigation of the effect of tetrahydroborate concentration.
The results showed that an increase in the Ar carrier flow rate up to 255 mL.min-1 results in an increase in the absorbance, above which it remained
Fig 3. Effect of NaBH4 concentration on the
0 0,05 0,1 0,15 0,2 0,25
1 1,5 2 2,5 3 3,5 4 4,5 5
preconcentration time (min)
a
b
s
o
rb
a
n
c
e
relatively constant. These results confirm the data obtained by Featherstone [18]. An optimum flow rate of 215 mL.min-1represented the best compromise between signal sensitivity and resolution of arsenic. The effect of the nitrogen flow rate as a carrier for stibine was also investigated. It is obvious that the optimum nitrogen flow rate is 150-160 mL.min-1.
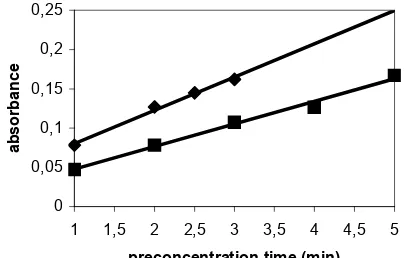
Effect of Preconcentration Time
The preconcentration time was varied from 1 to 3 minutes. The system conditions used for arsenic were coil length (R1) 120 cm, (R2) 90 cm, HCl concentration
(2M), the flow rate of samples, reagent and HCl (0.04 mL.min-1), the argon flow rate (175-180 mL.min-1and the sample concentration (100 ng.mL-1). Similar conditions were also applied for antimony, except for HCl concentration of 1 M and the nitrogen flow rate of 215 mL.min-1.
The absorbance increased linearly with increasing preconcentration time up to 3 minutes, as shown in Fig 4. Based on the shorter time for analysis point of view, the preconcentration of 1 minute was chosen for further measurements.
Analytical Performance
The analytical performance characteristics obtained of arsenic and antimony with different pre concentration time using proposed method and its
Fig 4.Effect of preconcentration time on the absorbance of arsenic()As;(∎)Sb
comparison with the conventional method are presented in Table 2. This evaluation of the method was performed using the optimum conditions determined previously.
The 3 criterion [19] was applied to ten blank measurements, giving a detection limit of 15 ng.mL-1for As (III) with one minute preconcentration time. Similarly, the detection limits for Sb (III) with one minute preconcentration time was 8 ng.mL-1. Meanwhile, the detection limit for As (III) and Sb (III) using a conventional hydride system were 2000 ng.mL
-1
and 75 ng.mL-1. That means, the proposed method has the detection limit 130 times lower for arsenic and 10 times lower for antimony than the conventional hydride system.
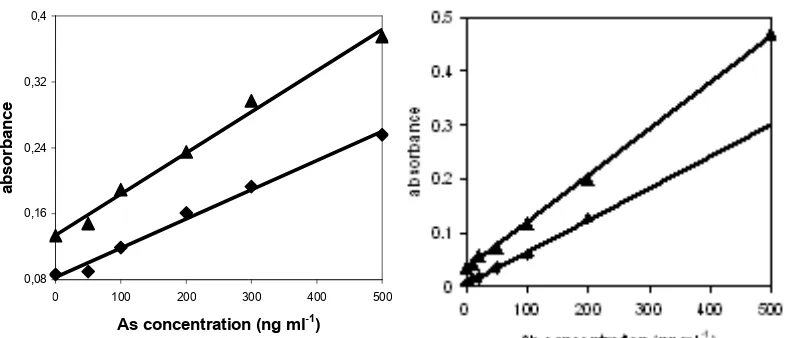
Linearity was confirmed for the concentration ranges shown in Table 2. The relative standard deviation (n = 3) was 3.3 % for 50 ng.mL-1and 0.4 % for 500 ng.mL-1of arsenic if pre concentration time of one minute was applied and significantly decreased to 0.67-1.31 % for two minutes pre concentration time which is much smaller in comparison with relative standard deviation of standard solutions using the conventional hydride system (4.54-10.48 %). This is an indication that that proposed method has a better precision. Meanwhile, the relative standard deviation (n=3) for antimony varied between 0.97-6.66 % and 0.99-4.62 % for one and two minutes preconcentration time.
Comparison between The Proposed Method, The Conventional Method and Application of the Proposed Method
In order to demonstrate the applicability of the proposed method, a comparison with conventional hydride system using U-tube liquid-gas separator (without using chromatomembrane cell) has been carried out. The results are presented in Table 2. Measurement of arsenic using the same atomic absorption spectrophotometer with conventional hydride system produced less sensitive results and less precision, which is indicated by higher detection limit and relative standard deviation.
Table 2.Analytical characteristics of the HG-AAS method
DLa(ng ml-1) RSDb(%) Equation RCc(R2) Linear range (ng.mL-1)
As (III)d 15 1.90 Y=0.0003x + 0.0865 0.9965 50-500
As (III)e - 2.08 Y=0.0005x + 0.1332 0.9915 50-500
As (III)f 2000 4.54# Y=0.0162x + 0.0034 0.9903 3-10
Sb (III)g 8 1.99 Y=0.0006x + 0.0067 0.9906 10-200
Sb (III)h - 0.99 Y=0.0009x + 0.0034 0.9988 10-500
Sb (III)i 75 1.90₤ Y=0.0003x – 0.0163 0.9944 0.1-1
a
Detection limit (3). f, iConventional method
b
Relative standard deviation at 200 ng ml-1(n=3). #Relative standard deviation at 7 µg.mL-1
cRegression coefficient ₤Relative standard deviation at 0.5 µg.mL-1 d, g
Proposed method, 1 minute pre concentration time µg.mL-1
e, h
0,08 0,16 0,24 0,32 0,4
0 100 200 300 400 500
As concentration (ng ml-1)
a
b
s
o
rb
a
n
c
e
Fig 5. Calibration graph of arsenic and antimony at optimum conditions in diferrent pre concentration time ()one minute; (▲) two minutes
By using the proposed method, 50 ng.mL-1 of As (III) standard solution has the mean absorbance 0.091 (n=3) for one minute pre concentration time. The similar absorbance value could be only produced by 7000 ng.mL-1(7g.mL-1) of As (III) standard solution using the conventional hydride generation method. That means, the proposed method has 140 fold more sensitive than the conventional hydride generation method. A similar bahaviour is also shown by antimony. 50 ng.mL-1Sb (III) standard solution has the mean absorbance 0.036 (n=3) that equal to the absorbance that is produced by 200 ng.mL-1 of Sb(III) standard solution using the conventional hydride generation method. For Sb(III), 4 fold more sensitive result can be reached.
The proposed method has been also successfully applied in determination of arsenic in pharmaceutical. The repeatability for five successive measurements of real sample (Arsenicum album D6) gave the concentration of 0.99 μg.mL-1from the certified value of 1μg.mL-1and presented a relative standard deviation of 0.3 %.
CONCLUSION
The proposed method, using a chromatomembrane cell as a separation, extraction and preconcentration manifolds, has been applied on determination of arsenic and antimony using continuous hydride generation system by atomic absorption spectroscopy that gives better precision and accuracy, lower relative standard deviation and detection limit and more sensitive in comparison with the conventional hydride generation system. Application of the proposed method in pharmaceutical analysis shows good reproducibility and accuracy.
REFFERENCES
1. Munoz, O., Velez, D., and Montoro, R., 1999, Analyst, 124, 601.
2. Jesus Cal-Prieto, M., Carlosena, A., Andrade, J.M., Muniategui, S., Lopez-Mahia, P., Fernandez, E., and Prada, D., 1999,J. Anal. At. Spectrom., 14, 703.
3. Shida, J., and Umeki, S., 1999,Anal. Sci., 15, 1033 4. Mota, J.P.V., Fernandez de la Campa, M.R., and Sanz-Medel, A., 1998, J. Anal. At. Spectrom., 13, 431.
5. Burguera, J.L., and Burguera, M. 1997,J. Anal. At. Spectrom., 12, 634.
6. Baranguan, M.T., Laborda, F., and Castillo, J.R., 2002,Anal. Bioanal. Chem., 374, 126.
7. Chen, S.Y., Zhang, Z.F., and Yu, H.M., 2002, Anal. Bioanal. Chem., 374, 115.
8. Cardore, S., Anjos, A.P., and Baccan, N., 1998, Analyst, 123, 1717.
9. Xiu-Ping, Y., and Zhe-Ming, N.,, 1994, Anal. Chim Acta, 291, 89.
10. Cadore S., and Baccan, N., 1997, J. Anal. At. Spectrom., 12, 637.
11. Simon, J., and Moskvin, L.N., 1999, Talanta, 49, 985.
12. Simon, J., Kirchhoff, A., and Gültzow, O., 2002, Talanta, 58, 1335.
13. Wei, Y., Oshima, M., Simon, J., and Motomizu, S., 2002,Talanta, 57, 355
14. Erxleben, H., Simon, J., Moskvin, L.N., Vladimirovna, L.O., and Nikitina, T.G., 2000, Fresenius. J. Anal. Chem., 366, 332.
15. Thompson, K.C., and Thomerson, D.R., 1974, Analyst, 99, 595.
16. Santosa, S.J., Mokudai, H. and Tanaka, S., 1997, J. Anal. At. Spectrom., 12, 409.
17. Aström, O., 1982,Anal. Chem, 54, 190.
18. Featherstone, M., Butler, E.C.V., O’Grady, B.V., and Michel, P., 1998, J. Anal. At. Spectrom., 13, 1355.