978-1-4673-4404-3/12/$31.00 ©2012 IEEE
By Train or By Car? Detecting the User’s Motion
Type through Smartphone Sensors Data
Luca Bedogni
Department of Computer Science University of Bologna
Marco Di Felice
Department of Computer ScienceUniversity of Bologna [email protected]
Luciano Bononi
Department of Computer ScienceUniversity of Bologna [email protected]
Abstract—Nowadays, the increasing popularity of smartphone devices equipped with multiple sensors (e.g. accelerometer, gy-roscope, etc) have opened several possibilities to the deployment of novel and exciting context-aware mobile applications. In this paper, we exploit one of this possibility, by investigating how to detect the user motion type through sensors data collected by a smartphone. Our study combines experimental and analytical contributions, and it is structured in three parts. First, we collected experimental data that demonstrate the existence of specific sensors data patterns associated to each motion type, and we propose methods for data analysis and features extraction. Second, we compare the performance of different supervised algorithms for motion type classification, and we demonstrate that jointly utilizing the multiple sensor inputs of a smartphone (i.e. the accelerometer and the gyroscope) can significantly improve the accuracy of the classifiers. At the same time, we analyze the impact of sampling parameters (e.g. the sampling rate) on the system performance, and the corresponding trade-off between classification accuracy and energy consumption of the device. Third, we integrate the motion type recognition algorithm into an Android application, that allows to associate a specific smartphone configuration to each detected motion type, and to provide this information at system-level to other context-aware Android applications. Experimental results demonstrate the ability of our application in detecting the user’s motion type with high accuracy, and in mitigating the classification errors caused by random data fluctuations.
I. INTRODUCTION
In these last years, context-aware computing has emerged as a revolutionary paradigm to deploy pervasive and mobile applications that are able to adapt their behaviours based on the characteristics of the environment. Starting from 2001 [1], research on Body Area Sensor Networks (BANs) and on activity pattern recognition has demonstrated the possibility to deploy wearable devices that are able to recognize everyday’s life activities (e.g. walking, running, etc), and to leverage this knowledge to enrich the users’ experiences on different application domains (e.g. health care). Nowadays, a new frontier of pervasive communication is constituted by the exploitation of the potentials offered by highly-popular devices, such as smartphones and tablets, for novel and exciting mobile applications. Compared to wearable accelerometers used on previous studies [2][3][4][5], these devices offer the advantage to provide a wide set of embedded sensors (including also: gyroscopes, magnetometers, etc), through which an accurate description of the users’ context
can be inferred, in terms of geo-localization, mobility prediction and network resources detection. In most cases, these devices have enough computational and storage capabilities to process sensor data locally, and to perform context-recognition through advanced features extraction and classification techniques [6]. Moreover, using Machine-to-Machine (M2M) communication and short-range wireless technologies, like Wi-Fi, NFC and Bluetooth, they are able to share context-related information over a network, and to autonomously cooperate with other heterogeneous devices to provide aggregated services to the end users. This scenario is also in-line with the emerging visions of Smart Spaces [7] and Internet-of-Things [8], that are deserving increasing attention from both academia and industry.
To achieve these results, in this paper we address the problem of motion type recognition with three novel contributions. First, we show some experimental results gathered from smartphone sensors for different class of motions, like driving a car, being on a train, and walking, and we demonstrate (through opportune metrics) the existence of patterns specific to each class. Second, we propose a classification methodology to recognize these features, by comparing different machine learning techniques (Random Forests, SVM, Naive Bayes). Compared to previous works on activity recognition based on accelerometer devices [4][3][5][9][10], here we show that aggregating the data from multiple sensors (e.g. accelerometer and gyroscope) can significantly enhance the accuracy of the classification process. Finally, we implement the proposed techniques on an Android application, called What Am I Doing (WAID), that performs on-line training from sensor measurements, predicts user’s motion type and exports this information as a content provider that can be accessed by other applications (e.g. the context-profile one).
The rest of the paper is organized as follows: in Section II we provide a brief-overview of the state of the art in the field of activity recognition from mobile devices. In Section III we explain how we collected data from real measurements. In Section IV we provide details of the motion type recogni-tion scheme and we show the accuracy results for different classification algorithms. In Section V we present the WAID application for the Android platform. Finally, in section VI we discuss future extensions of the work.
II. RELATED WORKS
In the last years, several works have addressed the problem of action recognition from accelerometer data produced by wearable devices [3][4][5][9][10]. Moreover, most of these works adopt the same methodology of study, i.e.: they collect accelerometer data from a large set of experiments, extract features from raw data, and utilize learning-based classification techniques to recognize the accelerometer pattern corresponding to each activity. Although a similar approach is used also in this paper, we highlight in this Section the peculiarities of our work, in terms of research goals and contributions, compared to the existing literature.
In [4][5][6][10], the authors propose learning-techniques to recognize everyday’s human activity, like walking, biking, jumping, etc. One of the most comprehensive study on feature recognition is contained in [10], where data are collected by five accelerometers placed on different parts of the body. Results in [10] demonstrate that the utilization of multiple devices might improve the accuracy of the activity recognition process. A comprehensive comparison of different classification techniques is reported in [5], where the authors show that combining classifiers through voting techniques produces the best results for the correct classification of most of the activities. Feature extraction from accelerometer data
is discussed in [3][4][11]. More specifically, in [3][4] the authors propose to extract frequency-related patterns of the accelerometer data using discrete consine transform. The same problem is also investigated in [11], where however the goal of the authors is to determine an efficient set of features that involve low computation efforts for extraction/recognition. More recently, the authors of [6] propose an original study on walking activities recognition using a smartphone. The goal of the authors is to recognise whenever a user is crossing a road, in order to produce a database of traffic lights for a specific urban environment. Differently from wearable sensor devices used in previous studies, the smartphone might not have a fixed position/orientation with respect to the user’s body, and thus a new metric (calledmagnitude) is introduced to compute the intensity of the acceleration, regardless of its direction [6].
Our work is mainly inspired by research in [6][11]. At the same time, we introduce the following key novelties: (i) we fo-cus on the problem of recognizing user’s motion type, instead of detecting user’s activity. Thus, we address a completely different problem compared to [4][5][10], since in our case we are mainly interested in detecting the characteristics of the environment rather than the user’s behaviour; (ii) we rely on data collected by smartphones, and we investigate how the combined utilization of multiple sensors (e.g. acceleration and gyroscope) might improve the accuracy of motion type recog-nition, (iii) we integrate the proposed classification technique into a mobile application for the Android platform, in order to adapt the current smartphone configuration based on the detected motion type, and at the same time to provide this information as a system service.
III. DATACOLLECTION ANDANALYSIS
In this Section, we detail the methodology used to collect sensors data from smartphone (Section III-A), and we provide evidence of the fact that different motion types might exhibit different sensor data patterns, that can be recognized by an opportune selection of classification features. To this aim, in Section III-B we describe how feature extraction was performed, while the details of the classification process are provided in Section IV.
A. Data Collection
The first step of our work consisted in collecting sensors data for different motion types. To this purpose, we developed an Android-application that allows to sample the sensor values at a fixed rater(set to 10Hz), and to save each sample on a log file. In our analysis, we considered three motion types M =
{walking(mW),moving by car(mC),moving by train(mT)}, and two sensor typesS={accelerometer(A),gyroscope(G)}. For each motion typem, and sensor type s, we built a data-set Dms containing around 72000 samples (corresponding to around 2 hours of continuous sampling). Each entry of Ds
m has the following structure:
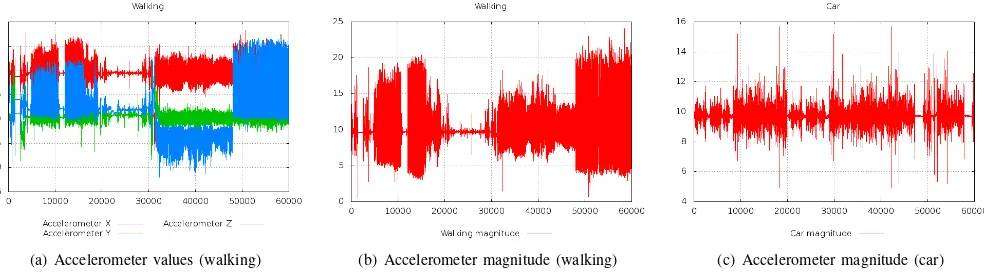
(a) Accelerometer values (walking) (b) Accelerometer magnitude (walking) (c) Accelerometer magnitude (car)
Fig. 1. The accelerometer values on thex,y,zaxes and the magnitude index for themW motion type are shown in Figures 1(a) and 1(b), respectively.
The magnitude index for themCmotion type is shown in Figure 1(c).
where t is the time-stamp of the sample, and vx,s, vy,s,
vz,s are the values of sensor s on the x, y and z axes, respectively. Each data-setDs
mwas built in anheterogeneous way, i.e. samples were collected from different people moving on different environments. Moreover, we left each user free to carry and use the device at his taste during the experiments (i.e. we did not impose fixed orientations and locations of the wearable devices like in [5][10]). This choice, while in-creasing the realism of the experiments, introduced additional complexity for the recognition purposes, since at each time instant the sensor value in each direction depends on the specific orientation of the device. This is demonstrated by Figure 1(a), where we show the accelerometer values over time (the three lines refers to the values of vx,A, vy,A and
vz,A), in a scenario where the user is walking and he is dynamically changing the current orientation of the device. It is easy to see that high fluctuations are introduced on each axis, as a consequence of the orientation changes. To overcome this problem, we combined the three values of the sensor (on the three axes) through an orientation-independent metric (called magnitude [6]), that reflects the module of the sensor vector. Like in [6], we defined the magnitude of a sensorsas follows:
magnitude(s) =|vs|=
q v2
x,s+v2y,s+v2z,s (2) Figure 1(b) shows the magnitude values for the sensor data of Figure 1(a). Conversely to the previous case, the mag-nitude values are almost stable and are not affected by the orientation changes. Moreover, in Figure 1(c) we show the magnitude values for the car motion type. Even from these raw data, it is easy to see that there are qualitative and quantitative differences between the patterns of Figure 1(b) and Figure 1(c), that motivate the utilization of techniques for motion type classification and recognition. Similar trends can also be noticed for different motion types (e.g. moving by train) and sensor types (e.g. gyroscope). These results are not shown here for space constraints.
B. Feature Extraction
After having collected the data, we divided each data-set
Dsminto consecutive non-overlapping time sequences of length
T (equal to 10 seconds in our tests). From each sequencek
we extracted the following features:
< min(s,k), max(s,k), avg(s,k), std(s,k)> (3)
where min(s,k), max(s,k), avg(s,k) and std(s,k) are respec-tively theminimumvalue,maximum value,averageand stan-dard deviation of the magnitude of sensor s during the sequence k1. In Section IV-B, we investigate the impact of the sequence length (i.e.T) on the accuracy of the classifiers. While several set of features can be used to represent a sequence, our choice is mainly motivated by the observation (supported by Figures 1(b) and 1(c)) that different motion types produce different time-behaviours of the sensor magni-tude, in terms of mean and fluctuations between the peak val-ues. Also, this choice involves much lower computational costs than frequency-based feature extraction techniques like [3][4]. We introduce here some notations used in the rest of the paper. We denote with FA
k the set of features associated to the accelerometer values on a sequence k, i.e.:
FkA={min(k,A), max(k,A), avg(k,A), std(k,A)} (4) Similarly, we represent with FG
k the set of features of the gyroscope:
FkG={min(k,G), max(k,G), avg(k,G), std(k,G)} (5) We denote withFAG
k the combined set of features using both the accelerometer and gyroscope data together:
FkAG=FkA∪FkG (6) Finally, we denote with TF the feature training-set used for the classification:
TF =
[
k
< F•
k, mk > (7)
where F•
k is the feature set extracted from sequence k (i.e.
FA
k,FkG or FkAG) andmk is the corresponding motion type.
1The indexkis a progressive counter over the total set of sequences in
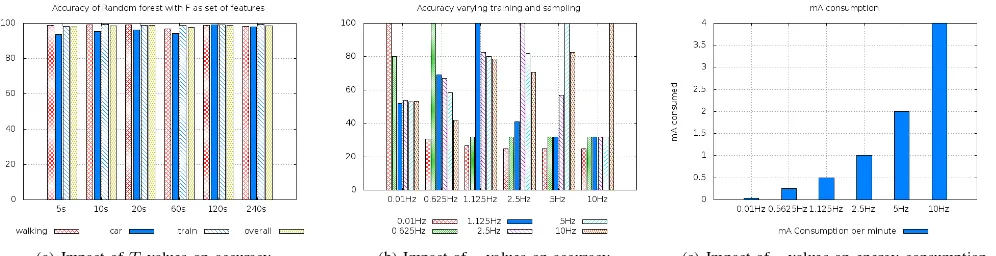
(a) Impact ofT values on accuracy (b) Impact ofrvalues on accuracy (c) Impact ofrvalues on energy consumption
Fig. 2. The accuracy of the Random Forest algorithm computed over different sequence lengths and for different sampling rates is shown in Figures 2(a) and 2(b), respectively. The energy consumption as a function of the sampling rate is shown in Figure 2(c).
IV. DATACLASSIFICATION
In this Section, we describe the algorithms used to learn pat-terns and to identify the user’s motion type. In Section IV-A, we evaluate different algorithms while in Sections IV-B we investigate the impact of different parameters on the classifi-cation accuracy.
A. Algorithm Comparison
In its general definition, a motion type classifier takes as in-put a set of featuresF•
k for a sequencekand a feature training-set TF, and produces as output a value c(F•
k, TF)∈M that represents the estimated motion type, i.e.mW,mC ormT. In our study, we consider three different classification algorithms, i.e. Random Forest [12], Support Vector Machines [13] and Naive Bayes [14].
The Random Forest algorithm was first presented in [12]. A Random Forest consists in a series ofk decision trees, where each node of the tree represents a conjunction of features, and the leafs are the output labels of the classification (in our case, mW, mC or mT). In our analysis, a Random Forest classifier is used to discover possible patterns over sub-sets of data features.
Support Vector Machines were first introduced in [13], and are widely used for classification and regression analysis. In its simplest version (i.e. binary linear classifier), a SVM maps the data points in input on a plane, separates the positive and negative instances by defining a separation gap, and classifies the new instances based on the side of the gap they fall on. Moreover, SVMs can work as non-linear classifier, using kernel methods to map the points into an hyperplane (or a set of hyperplanes) [2]. In our analysis, SVMs are used to identify possible spatial relationships over the feature sets.
Finally, Naive Bayes [14] constitute a well-known tech-nique for probabilistic-based data classification. In its sim-plest formulation, each classification hypothesis is assigned a posteriori-probability based on the observed data-set, and a maximum likelihood criteria is used to choose the best a-priori hypothesis. In our problem, Naive Bayes classifiers are
Random Forest SVM Naive Bayes walking 96.70 % 85.50 % 97.90 %
driving 94.10 % 85.50 % 56.10 % train 98.80 % 77.90 % 76.00 % overall 97.71 % 82.50 % 84.11 %
TABLE I
ACCURACY OF DIFFERENT ALGORITHMS
FA FG FAG=FA∪FG
walking 97.40 % 93.10 % 96.70 % car 62.80 % 65.90 % 94.10 % train 94.50 % 94.50 % 98.80 % overall 93.49 % 91.94 % 97.71 %
TABLE II
ACCURACY FOR DIFFERENT SETS OF FEATURES USING THERANDOM
FOREST ALGORITHM
introduced to reflect the stochastic nature of the environment where the training-set was built.
In Table I and II, we evaluated the accuracy of the three classifiers by performing a 10-fold cross validation on our training set. More specifically, Table I shows the classification accuracy2for the three algorithms described above, whenFAG
k is used as feature-set. Table II shows the classification accuracy of the Random Forest algorithm, when different feature-sets are used (i.e.FA
k ,FkG andFkAG). From the results in Tables I and II, two important considerations can be drawn. First, the Random Forest algorithm provides the average highest accu-racy (98%) among the three evaluated schemes, outperforming the SVMs (82.5%) and Naive Bayes (84.11%). This is also in accordance with the analysis in [10]. Second, although using a single sensor at a time can produce good results for a specific action (e.g. FkA for walking), the utilization of joint data features from both the sensors (i.e. FAG
k ) is shown to guarantee the best results in terms of average accuracy. This result confirms the effectiveness of our approach in jointly
utilizing the accelerometer and gyroscope data for motion type recognition. Based on these considerations, in the following we focus on the performance of Random Forest algorithm with FAG
k feature-set, and we investigate the impact of the time-sequence length T and sampling rate r on the overall accuracy.
B. Parameter Characterization
In Figure 2(a) we show the overall accuracy as a function of the time-sequence lengthT (on thex-axis) used to collect the data. From these results, it is easy to notice that the values of the time-sequence length do not affect the performance of the classification algorithm significantly, since the overall accuracy remains quite the same for the configurations with
T=5 seconds andT=240 seconds. We can thus conclude that: (i) a motion-type pattern has a limited time-duration and that (ii) the minimum value of T can be chosen (5 seconds in our analysis) in order to increase the responsiveness of the application (during motion type prediction). In Figure 2(b) we show the impact of the sensing sampling rateron the overall detection accuracy. More specifically, Figure 2(b) depicts the accuracy as a function of the training rate (on the x-axis) and of the prediction rate (i.e. of the sampling frequency used by the WAID application in predicting mode). The results in Figure 2(b) show that: (i) optimal accuracy can be achieved when training and predicting rates are the same, (ii) on average, the detection accuracy tends to increase in under-sampling conditions (i.e. prediction rate lower than the training rate), and to decrease in over-sampling conditions (i.e. prediction rate higher than the training rate) and (ii) high frequency sampling does not provide significant performance improvements, i.e. the accuracy of the classifier is almost independent by the training rate (at the conditions of using the same prediction rate). This latter result is quite important, since it allows to minimize the energy consumption of the device while collecting sensor data for training. To this aim, Figure 2(c) shows the energy consumption (in mA) introduced by the application used for data collection (described in Section III-A) as a function of the training rater, and confirms that using high sampling rates (e.g. 10 Hz) might have a significant impact on the battery life-time of the smartphone.
V. THEWAID APPLICATION
In this Section, we describe the WAID application, that includes a motion-type recognition algorithm (details in Sec-tion V-A) based on a Random-forest classifier, and a context-profiler module (details in Section V-B) to adopt the smart-phone configuration to the current motion type detected.
A. Motion Type Recognition Algorithm
The WAID application can run into two different modes: training andpredicting. In the trainingmode, the application collects sensor data samples at each sequence k, extracts the features FkAG, gets the information about the current mobility type m by the user’s feedback and then stores the
< FkAG, m > information on the feature training-set TF.
In the predicting mode, the application works similarly, i.e. it extracts the current set of features FAG
t , but then it determines the current motion type m′ based on the stored
knowledge. Finally, it loads the profile p associated to m′
(i.e.p(m′)), as detailed in Section V-B.
In predicting mode, the recognition algorithm used by WAID relies on the output of the Random Forest classifier, since this algorithm is shown to produce the highest accuracy in the previous tests. However, it also attempts to reduce the occurrence of classification errors, by considering the time-correlation among consecutive motion type predictions. To this aim, letc(FAG
k , TF)∈M the output of the classifier for the current set of features FAG
t at time t, i.e. mW, mC or mT. Similarly, let c(FAG
t , TF),c(FtAG+1, TF), ..., c(FtAG+N, TF) the answers produced by the classifier when the application runs over a period ofN sequences. If each classification answer is treated in isolation and directly returned to the application, this might produce sequences like:mC,mC,mT,mC,mC, ..., that are clearly wrong, since the user can not intermittently change its motion type in a short sampling window. To overcome this problem, we maintain an history-set (H) of the latest h
answers of the classifier, i.e:
H ={c(FtAG−h, TF), c(FtAG−h+1, TF), ..., c(FtAG, TF)} (8) The history-set is dynamically updated at each new sam-pling, and a reference answer, i.e. c(H) is computed as the motion type having more positive answers in the current history-set. Each time a new answerc(FAG
k , TF)is produced, it is compared with the reference answero(H), and in case of difference the value ofo(H)is returned to the user (instead of
c(FAG
k , TF)). The details of the WAID recognition algorithm are shown in Algorithm 1.
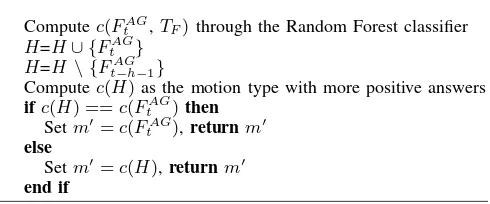
Algorithm 1: WAID Motion Type recognition algorithm
input:FtAG,TF
output: motion type m′∈M
Computec(FtAG,TF)through the Random Forest classifier
H=H∪ {FtAG} H=H \ {FtAG
−h−1}
Computec(H)as the motion type with more positive answers ifc(H) ==c(FtAG)then
Setm′=c(FtAG),returnm′ else
Setm′=c(H),returnm′ end if
An important parameter of Algorithm 1 ish, i.e. the history size. Indeed, short values ofhmight still determine classifica-tion errors due to random fluctuaclassifica-tions, while long values ofh
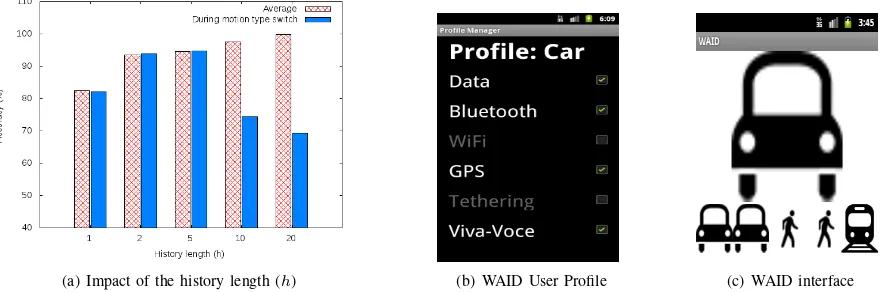
(a) Impact of the history length (h) (b) WAID User Profile (c) WAID interface
Fig. 3. The impact of the history size (h) on the accuracy is shown in Figure 3(a). The WAID user-interface: profile setting (3(b)) and predicting mode (3(c)).
accuracy of Algorithm 1 over all the length of the experiment, and the average accuracy during the motion type switch. As expected, Figure 3(a) demonstrates that the configuration with the longest value of h minimizes the occurrences of classification errors (on average). At the same time, it is easy to see that shorter values of h provides higher accuracy in proximity of the motion type switch.
B. User Interface
Figures 3(b) and 3(c) show the user-interfaces of the WAID application. At each time, the user can configure the profile associated to a specific motion type, as shown in Figure 3(b). Among the available options, the user can switch on/off the ringtones, enable/disable the state of wireless connections, and so on. In predicting mode, the WAID user interface looks like Figure 3(c). Here, an icon corresponding to the current predicted motion type is shown in evidence (i.e. the car icon in Figure 3(c)), together with an history of previous motion types (below the main icon). When the user-interface is not visible, the WAID application is still executed in background as an Android Service. Moreover, the WAID application ex-ports the motion type information via an Android Content Provider, that can be accessed by all the Android applications installed on the smartphone. As a result, the information provided by WAID can be communicated to other users in the surrounding environment through short-range wireless communication interfaces, or combined with other local sensor data for the deployment of advanced context-aware services and applications.
VI. CONCLUSIONS
In this paper, we have addressed the problem of determining the user’s motion type from smartphone sensors data. To this aim, we have evaluated different feature extraction techniques and classification algorithms, and we have demonstrated that the joint utilization of sensors data from multiple sources (i.e. accelerometer and gyroscope) can improve the accuracy of the classifier. Moreover, we have introduced an history-based recognition technique to reduce the occurrences of classifi-cation errors by exploiting the temporal correlation among
consecutive sensor readings. Finally, we have integrated the motion type recognition algorithm into an Android application, that allows to associate a smartphone profile to each motion type, and to share this information with other context-aware applications. Future works include: the support to additional actions/motions (e.g. climbing a stair) and sensor types (e.g. external sensors) and the extension to a collaborative scenario, where users’ can share their motion type information for smart-city applications deployment.
VII. ACKNOWLEDGEMENT
This research work is partially funded by the Italian MUR, the Italian Ministry of University and Scientific Research.
REFERENCES
[1] Randell, C., & Muller, H. Context awareness by analysing accelerometer data.Proc. of IEEE ISWC, Atlanta, 2000.
[2] Khan, A. M., Lee, Y. K., Lee, S. Y., Kim, T. S. Human Activity Recognition via an Accelerometer-Enabled-Smartphone Using Kernel Discriminant Analysis.Proc. of FutureTech, pp. 1-6, Busan, 2010. [3] He, Z.-yu, & Jin, L.-wen. Activity recognition from acceleration data
using AR model representation and SVM. Proc. of ICMLA, pp. 2245-2250, San Diego, 2008.
[4] He, Z., Jin, L. Activity recognition from acceleration data based on discrete consine transform and SVM.Proc. of IEEE SMC, pp. 5041-5044, San Antonio, 2009.
[5] Ravi, N., Dandekar, N., Mysore, P., Littman, M. L. (2005). Activity Recognition from Accelerometer Data.Neural Networks: 20(3), pp. 1541-1546, 2005.
[6] Bujari, A., Licar, B., Palazzi, C. E., Movement Pattern Recognition through Smartphone’s Accelerometer. Proc of IEEE DENVECT, Las Vegas, 2012.
[7] SmartSpaces Project. http://www.smartspaces.eu/home/
[8] Atzori A., Iera, A., Morabito G., The Internet of Things: A survey. Computer Networks: 54(15), pp. 2787-2805, 2010.
[9] Mannini, A., Sabatini, A. M., Machine Learning Methods for Classifying Human Physical Activities from On-body Sensors. Sensors: 10(1), pp. 1145-1175, 2010.
[10] Bao, L., Intille, S. S. Activity Recognition from User-Annotated Accel-eration Data.Pervasive Computing: 3001(1), 1-17, 2004.
[11] Casale, P., Pujol, O., Radeva, P., Human Activity Recognition from Accelerometer Data Using a Wearable Device,Proc. of IbPRIA, pp. 289-296, Gran Canaria, 2011.
[12] Breiman, L. Random forest.Machine Learning, 45(1), pp. 5-32, 2001. [13] Cortes, C., Vapnik, V. Support-vector networks. Machine Learning:
20(3), pp. 273-297, 1995.