Correspondention Author: Moch. Aziz Basari, Faculty of Economics Galuh University of Ciamis, DOI: http://dx.doi. org/10.18202jam23026332. 15.1.15
JAM
15, 1
Received, January 2017 Revised, February 2017 Accepted, March 20 17
ANALYSIS OF THE OPTIMIZATION
OF THE IMPLEMENTATION OF SERVICE MARKETING
MIX ON STUDENT’S SATISFACTION
Moch. Aziz Basari Dani Usmar Mukhtar Abdul Kader
Faculty of Economics Galuh University of Ciamis
Abstract: This study aims to analyze how much influence the marketing mix to the satisfaction of Students of the Faculty of Economics, Galuh University of Ciamis. Marketing Mix Services by combining Price (X1), Place (X2), Process (X3), People (X4) and Physical Evidence (X5) in synergy to affect student satisfaction and analyze which of the five marketing mix that most influence on student satisfaction. Methods of data collection method used in this research Field Research (observation, interviews, and questionnaires) and using a Likert scale and the determination of the sample used was accidental sampling as many as 96 samples. With the method simple and multiple linear regression. The results are partially Price (X1): 15:46%, Place (X2): 18:36%, Process (X3): 39.22%, People (X4): 36.24% and Physical Evidence (X5): 61.82%, and simultaneously at 68.09%. 31.91% influence of other variables. By using SPSS shows of the five components of marketing mix variables only place (X2) and Physical Evidence (X5) positive and significant impact on student satisfaction (Y), because the level of significance of <0.05, while the variable price (X1), process (X3) and people (X4) effect on student satisfaction (Y), but not significant. Due to the significance level above 0.05 (> 005).
Keywords: price, place, process, people, physical evidence, student satisfaction
Jurnal of Applied Management ( JAM) Volume 15 N umber 1, March 20 17
Indexed in Google Schola r
Competition between universi-ties nowadays is getting tight, not only in the domestic scope, but it also has come into global level. One of the causes is the regional autonomy that makes more and more new universi-ties springing up. Besides, the rapid development of infor-mation and communication technology makes the compe-tition between universities in the global level more real.
Galuh University of Ciamis (Unigal) is one of private universities which is facing the same challenges like other
universities. The competition between universities gives impact on the difficulty of attracting potential students, who in this case are as consumers of educational service. To overcome this problem Unigal strives to introduce and offer educational service to the society by implementing a strategic marketing mix. Today’s global era demands the Faculty of Economics to find and build a management system that is able to retain customers professionally. Jones and Sanser in Hurriyati (2005: 127 that in the era of free trade that is not protected at all, company should be able to struggle, which are loyal or satisfied customers.
value. This becomes a real action of consumers, which are influenced by psychological factors and other external factors that lead them to choose and use products or services they want.
On one occasion, students are faced with the situation where they are satisfied with the services provided by Faculty of Economics through the optimi-zation of servis marketing mix. In such condition, we can see how the attitudes of students.
Many service organizations which implement a strategy to expand its business capacity which must be adapted to the demand and the taste of consumers. Meeting the needs and desires of consumers requires a marketing concept which is called marketing mix marketing mix. According to Kotler (2000: 15), marketing mix is a combination of four essential variables of the marketing concept that can be controlled by company. Four of these variables include product, price, place and promotion, and they are commonly abbreviated to 4P. Zeithaml and Bitner in Hurriyati (2005: 48) suggest that service marketing needs expanded marketing mix for services with the addition of non-traditional marketing mix, namely process, people, and physical evidence. However, on this problem, researchers just take a few variables which are influential enough, including price, location, process, people and infrastructure. Those five varia-bles were chosen by the researchers because those variables represent two variables that are not included. Those two variables are Product and Promotion. According to the researchers, in this case, the gradua-tes will be automatically good either if those five service mixes have been implemented properly, while promotion has become a habit that has been done every year.
If the Faculty of Economics could not combine the marketing mix, as the real implication of the future, it will have an impact on the existence of Faculty of Economics itself. Students’ disbelief leads to dissatis-faction that makes lecture not run well. Therefore, the Faculty of Economics is required to predict how students will respond to the marketing strategy that is applied.
METHOD
The method that was used by the researchers was descriptive method. Descriptive method,
according A.Gima Sugiama (2008), is a research which seeks to collect data, analyze the data critically and conclude it based on the facts when the study is conducted or now.
This research was conducted at Faculty of Economics, Galuh University ofCiamis Jln. RE Martadinata No. 150 Maleber. Bargebeg Subdistrict Ciamis.
The variables observed in this study are five components of marketing mix, which are Price, Place, Process, People and Physical Evidence. Other variables observed and measured are the satisfaction of students who are studying at Faculty of Economics Unigal. The populations in this study were all active students of Faculty of Economics from all the semes-ters amounted to 1.976 people in 2015. The number of samples in this study was determined based on the formula of Slovin, cited by Umar (2005: 108), as follows:
Information: n : Size of Sample N : Size of population
e : Critical value (percentage of concession in this study due to mistake in taking sample, which still can be tolerated)
In this study, the population number of students of Faculty of Economics, Galuh University with the desired margin of error is 10%, by following the calculation above, then the result is:
n = 95.83
Based on the calculation above, with number of population amount to 1.976 students, then the size of sample obtained were 96 students (rounded from 95.83).
study by using observation, which was followed by questionnaires.
The sampling technique used in this study was accidental sampling technique, in which anyone who by chance met the researchers could be used as sample, if he/she was considered meet the criteria of data source. After that, all data was collected and tested by validity and reliability tests. Validity test is a measure that indicates the level of reliability or validity of measuring instruments (Riduwan, 2007: 109-110). To calculate the validity of the measuring instrument, used the correlation formula Pearson Product Moment (PPM) was used, namely:
Information:
r count : correlation coefficient Xi : total score of item Yi : total score (all items) n : number of respondents
PPM correlation is symbolized by r, the value of r should not be more than the value (-1
r
+1). If the value of r = -1, it means perfect negative correla-tion; r = 0 means no correlacorrela-tion; and r = 1 means that the correlation is very strong.According to Sugiyono, if the correlation of each factor is positive and the amount is 0.3 and above, thus the factor is a solid construct. To measure the validity of each item in the questionnaire, the researchers used the formula of Microsoft excel 2010, which is a measuring instrument of assessment by the formula = Correl (Array1; Array2), Array1 is item and Array2 Range is the range of Total Score each variable. Reliability test is the measurement of precision or accuracy of an instrument. According to Sugiyono (2007: 173), a reliable instrument is an instrument which if used several times to measure the same object will generate the same data. Reliability test technique used was the of Split Half technique of Spearman Brown, namely:
Information:
r1 : reliability of all instruments
rb : product moment correlation between the first and second split
It is declared reliable is the coefficient of reliabi-lity (Cronbach alpha) is above 0.7 (Sugiyono, 2004: 178). This calculation was helped by Software application of SPSS V.16.
Data Analysis Technique
The researchers used multiple regression analysis by using SPSS. Regression analysis aims to quantita-tively calculate the effect of an event change (variable X) to the other event (variable Y). To see the relation-ship between the variables, multiple regression formula was used Umar (2005: 307).
Y = a+ b1X1 + b2X2 + b3X3 + b4X4 + b5X5 + e
Information:
Y : Satisfaction of Students of Faculty of Economics a : Constant Value
X : Service Marketing Mix X1 : Price
X2 : Place X3 : Process X4 : People
X5 : PhysicalEvidence b : Regression Coefficients e : Error
The next step was calculating the coefficient of determination (r2) to determine the ability of
indepen-dent variable in explaining the depenindepen-dent variable. The amount of the coefficient of determination can be seen in R Square and, it is expressed in a percentage.
RESULTS
namely: >0.30. It can be concluded that the statement of item 1 to 8 can be considered valid and can be processed as research data. The instrument of variable of Physical Evidence meets the required criteria, namely: >0.30. It can be concluded that the statement of item 1 to 28 can be considered valid and can be processed as research data. The instrument of variable of Student Satisfaction meets the required criteria, namely: >0.30. It can be concluded that the statement of item 1 to 101 can be considered valid and can be processed as research data. Based on the results of the data processed from 96 students in Faculty of Economics Galuh University, the result of statement obtained there are Price, from the three statements, the score obtained is 993 out of 1440. It is in category of GOOD. Place, from the three state-ments, the score obtained is 1152 out of 1140. It is in category of EXCELLENT. Process, from twelve statements, the score obtained is 4421 out of 5760. It is in category of GOOD. People, from three state-ments, the score obtained is 993 out of 1440. It is in category of GOOD. Physical Evidence, from 28 state-ments, the score obtained is 9045 out of 13440. It is in category of MODERATE. Student satisfaction, from 102 statements, the score obtained is 35663 out of 48480. It is in category of GOOD
Descriptive Statistics of Average Score of
Variables
Here are the results of the calculation of the average of research variables.
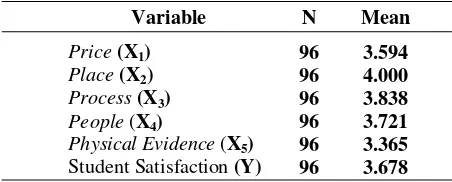
From all average scores of variables, Place is a variable that has the highest value.
Verificative Analysis
Coefficient of Determination (R
2)
The coefficient of determination (Square multiple Correlation) is the coefficient used to determine the amount of contribution of independent variables on the change of dependent variable. The contribution of Price, Place, Process, People, and Physical Evi-dence against Student Satisfaction is 0.681 or 68.09%. While the remaining, 31.91% (100% -68.09%), are other variables that affect student satisfaction but they are not examined like: Product, Promotion and Quality of Service.
From ANOVA or F test above, F count of 38.409 with probability of 0.000 is obtained. Because the probability is less than 0.05, then the model can be used to predict student satisfaction, or it can be said that Price (X1), Place (X2), Process (X3), People (X4), Physical Evidence (X5) simultaneously affect Student Satisfaction.
Significance Test of Individual Parameter (T
Test)
Here is the layout of SPSS output of significance test of individual parameter:
Table 1. Result of the Calculation of Average
Source: processed from the calculation result, 2010.
Variable N Mean
Price (X1) 96 3.594
Place (X2) 96 4.000
Process (X3) 96 3.838
People (X4) 96 3.721
Physical Evidence (X5) 96 3.365 Student Satisfaction (Y) 96 3.678
If the data in table above are compared with the criteria for the interpretation of variable condition below, it will be known the condition of each variable which is examined.
Table 2. Interpretation Criteria of Research Variables Variable Interpretation
4,21 – 5,00 Excellent
3,41 – 4,20 Good
2,61 – 3,40 Moderate
1,81 – 2,60 Fair
1,00 – 1,80 Bad
Table 3. Criteria of Research Variable
Variable Mean Criteria
Price (X1) 3.594 Good
Place (X2) 4.000 Good
Process( X3) 3.838 Good
People( X4) 3.721 Good
Physical Evidence (X5) 3.365 Moderated
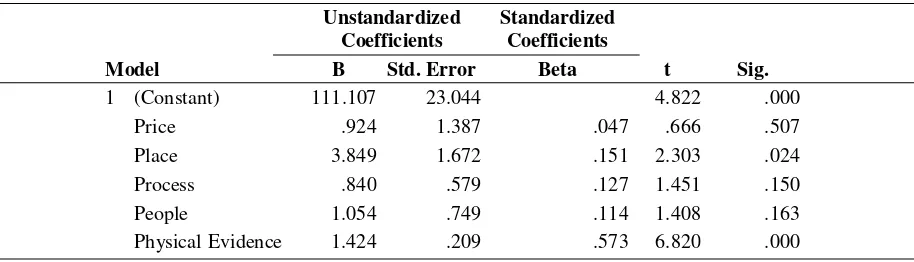
From those five independent variables, which are Service Marketing Mix, namely Price (X1) with significance probability level of 0.507, Place (X2) with significance probability level of 0.024, Process (X3) with significance probability level of 0.150, People (X4) with significance probability level of 0.163 and Physical Evidence (X5) with significance probability level of 0.000. Based on the results of data processing by using SPSS, it is shown that from those five components of service marketing mix, there are only two variables which give positive and significant im-pact on student satisfaction (Y), because the level of significance <0.05, those two variables are place (X2) and Physical Evidence (X5). While three other variables, namely price (X1), process (X3) and people (X4) influence student satisfaction (Y), but it is not significant. It is based on the results of data processing by using SPSS that the level of significance of those three variables is above 0.05 (> 005).
DISCUSSION
This study discusses how Price (X1), Place (X2), Process (X3), People (X4), Physical Evidence (X5)
give effect on Student Satisfaction at Faculty of Economics, Galuh University.
The results of this study illustrate that Student Satisfaction can be influenced by Price (X1), Place (X2), Process (X3), People (X4), Physical Evidence (X5) and can contribute data that can be used as an information for development and improvement, especially improvement in various aspects in im-proving student satisfaction at Faculty of Economics, Galuh University in the future.
Price in Faculty of Economics, Galuh University
Variable of price from 3 statement items and 96 respondents have average of 3.594, which is in the category of Good. It indicates that the determination of price or fee which should be paid to Faculty of Economics is received by the students well.
Place in Faculty of Economics
Variable of place from 3 statement items and 96 respondents have average of 4000, which is in the category of Good. It indicates that the place of Faculty
Table 4. Simultaneous Significance Test (F Test)
Note:
Predictors: (Constant), Physical Evidence, Place, Price, People, Process. Dependent Variable: Student Satisfaction.
ANOVAb
Model Sum of Squares df Mean Square F Sig.
1 Regression 104764.674 5 20952.935 38.409 .000a
Residual 49097.316 90 545.526
Total 153861.990 95
Coefficientsa
Model
Unstandardized Coefficients
Standardized Coefficients
t Sig.
B Std. Error Beta
1 (Constant) 111.107 23.044 4.822 .000
Price .924 1.387 .047 .666 .507
Place 3.849 1.672 .151 2.303 .024
Process .840 .579 .127 1.451 .150
People 1.054 .749 .114 1.408 .163
Physical Evidence 1.424 .209 .573 6.820 .000
Note:
of economics is easily accessed by students. It can be seen from the results of this study of respondents in item number 3, which are in the category of very good/ excellent, which is the statement saying that Faculty of Economics is closed to the main road and to the parking area. Other items are need to be improved.
Process in Faculty of Economics, Galuh
Uni-versity
Variable of process from 12 statement items and 96 respondents have average of 3838, which is in the category of Good. It indicates that process in Faculty of Economics has been running well and is well received by the students. Seen from the results of this study on the respondents in item No. 2,4,7 and 8, in the category of very good, namely in the statements saying that each student should get information related to lecture (Schedule, lecturer, room and time), Penalties are given to students who violate the rules set by FE Unigal and also for all students without any exception, FE Unigal provides guardian lecturer or counseling lecturer for students, FE Unigal provide scholarships for students who have good achievement or the students from underdeveloped family. Other items need to be improved.
People in Faculty of Economics, Galuh University
Variable of people from 8 statement items and 96 respondents have average of 3721, which is in the category of Good. It indicates that people in Faculty of economics are already performing their duties and function well, and it is well received by the students. Seen from the results of this study on the respondents in item No 8 is in the category of very good, saying that All Lecturers and staff always look neat and attractive. Other items need to be improved.
Physical evidence in Faculty of Economics,
Galuh University
Variable of physical evidence from 28 statement items and 96 respondents have average of 3365, which is in the category of Good. It indicates that physical evidence in Faculty of Economics is good and well received by the students. However, there
are three items that require special attention because they are in the category of Moderate, in the statement saying that classrooms has had complete, modern and attractive facilities, The number of toilets available is sufficient and the toilets are clean, and The parks and public space in Faculty of Economics are pretty good. Other items need to be improved.
Student Satisfaction in Faculty of Economics,
Galuh University
Variable of student satisfaction from 28 state-ment items and 96 respondents have average of 3678, which is in the category of Good. It indicates that the student satisfaction in Faculty of economy is already good. It can be seen from the results of research in respondents, and get response of Very Good, namely the statements saying that the ability of lecturers in presenting the material in class, Clarity in giving infor-mation of academic services (Counseling Schedule, class registration, tuition payments, Practicum, PPL, KKL, KKN etc.) Curriculum is arranged well, struc-tured and in accordance with the employment, the ability of lecturers in teaching a class, Reputation of Institute, Accreditation of study program and freedom in following the activities of student organizations.
There are also some items that should be given special attention, namely the statement saying that Security of parking lot, the security of campus at night is good, the readiness of campus in emergency situa-tion (e.g.: fire), The f parks and public space in the Faculty is nice, Cleanliness is maintained toilets. Other items need to be improved.
The Effect of Price on Student Satisfaction
Effect of Place on Student Satisfaction
Based on the results of data processing by using SPSS, it is shown that place gives positive and signifi-cant impact on student satisfaction (Y) because the level of significance <0.05. The amount of the contri-bution of independent variables (place) to the changes in the dependent variable (Student Satisfaction) is 0.184 or 18.36%. This proves that place influences Student Satisfaction. This phenomenon shows that location (Place) must be positioned easily accessible from all sides.
Effect of of Process on Student Satisfaction
Based on the results of data processing by using SPSS, it is shown that place gives positive and signifi-cant impact on student satisfaction (Y) because the level of significance < 0.05. The amount of the contri-bution of independent variable (process) to the changes in the dependent variable (Student Satisfaction) is 0.392 or 39.22%. This proves that the process influences Student Satisfaction. This phenomenon indicates that process is very important to build student satisfaction.
Effect of People on Student Satisfaction
Based on the results of data processing by using SPSS, it is shown that people give positive and significant impact on student satisfaction (Y) because the level of significance < 0.05. The amount of the contribution of independent variable (people) to the changes in the dependent variable (Student Satisfac-tion) is 0.362 or 36.24%.This proves that people influence Student Satisfaction. This phenomenon indicates that people are very important to build student satisfaction.
Effect of Physical Evidence on Student
Satis-faction
Based on the results of data processing by using SPSS, it is shown that physical evidence gives positive and significant impact on student satisfaction (Y) because the level of significance < 0.05. The amount of the contribution of independent variable (physical evidence) to the changes in the dependent variable (Student Satisfaction) is 0.618 or 61.82%. This proves
that physical evidence influences Student Satisfaction. This phenomenon indicates that physical evidence is very important to build student satisfaction.
Effect of Simultaneous Variables X1, X2, X3,
X4, X5 on Y
The amount of the contribution of independent variables, namely Price (X1), Place (X2), Process (X3), People (X4), and Physical Evidence (X5) on the changes in the dependent variable (Student Satisfaction) is 0.681 or 68.09%. Here is the layout of SPSS output:
Based on the results of data processing by using SPSS, it is shown that: from those five components of service marketing mix, there are only two variables which give positive and significant impact on student satisfaction (Y) because the level of significance <0.05, those two variables are Place (X2) and Physical Evidence (X5). While three other variables, namely price (X1), process (X3) and people (X4) gives effect on student satisfaction (Y), but it is not significant.
This proves that Price (X1), Place (X2), Process (X3), People (X4), Physical Evidence (X5) influence Student Satisfaction.
CONCLUSIONS ANS SUGGESTIONS
Conclusion
People in Faculty of Economics, Galuh University are already good, which amounted to 3721. This indicates that respondents assume that people in Faculty of Economics, Galuh University are already good. This means that the academicians have done their duties and responsibilities well. Physical Evidence in Faculty of Economics, Galuh University are already good, which amounted to 3365. This indicates that respondents assume that Physical Evidence in Faculty of Economics, Galuh University is already good. This means that the tools and equipment supporting learning and teaching activity are already good. Student Satis-faction in Faculty of Economics, Galuh University is already good, which amounted to 3678. This indicates that respondents assume that Student Satisfaction in Faculty of Economics, Galuh University is already good. This means that all components: Price, Place, Process, People, Physical Evidence are good. Based on the calculation by using SPSS, the influence of Price on Student Satisfaction is 15.46%. This pheno-menon shows that price influences Student Satisfac-tion. Based on calculation by using SPSS, the effect of Place on student satisfaction is 18.36%. This phenomenon indicates that location influences Student Satisfaction. Based on calculations by using SPSS, the influence of Process on student satisfaction amounted to 39.22%. This phenomenon indicates that process is influences student satisfaction. The influence people on the student satisfaction amounted to 36.24%. This phenomenon indicates that people influences student satisfaction. The influence of physical evidence on student satisfaction is amounted to 61.82%. This phenomenon indicates that infra-structure influences Student Satisfaction. The influence of Price (X1), Place (X2), Process (X3), People (X4), and Physical Evidence (X5) on student satisfaction amounted to 68.09%. The remaining 31.91% is influenced by other factors which are not examined.
Suggestions
Most statement items have are in good category, meaning that they can be improved at a very good level. Therefore, Faculty of Economics still main-taining the cost which is not too expensive compared to the competitor. Faculty of Economics also strives to give the best service to students, so that students
feel that the cost is in accordance with what they get.
Two items which are still possible to be improved that are statement saying that the location of Faculty of Economics is strategic, there is no traffic jam, it is located on the main road, and it is easily accessible from all directions. The items which are still possible to be improved to be excellent that are Every job/ task is always returned to the student, Time is used effectively by lecturers in the teaching process, The material is given by lecturers clearly and there is time provided for discussion and questions and answers, Supplement teaching materials (handouts, modules, etc.) are given to students to complete the materials, FE UNIGAL helps students when students face academic problems, The Head of FE UNIGAL and the staffs give time for students’ parents to consult, FE UNIGAL provides medical assistance for students who are sick, and FE UNIGAL provides insurance assistance to students who get accidental injuries.
The items that need to be improved that are Academic administration staffs are polite, prompt, friendly, thorough and accurate in providing services, Academic, finance, public and student affair staffs have the ability to serve the administration of student affairs, Students’ problems/complaint is handled by guardian lecturer or study program, Lecturers assess the exam/assignments objectively, Lecturers come in class on time, Lecturers are adequate according to their expertise, and Lecturers should have excellent competence.
lights in campus at night, Facility of computer, There are internet service and hot spot in campus, The academic guide books are complete, Facilities and comfort of the lounge area, There rooms for student organizations, Cooperative for students is quite helpful, and Existence of BI Corner Self helps students in providing reference books. FE UNIGAL must get special attention on Classrooms should have complete, modern and attractive facilities, Availability of ade-quate and clean toilets, The parks and public space in Faculty are pretty good, and Cleanliness of toilets should always be maintained.
The items that really need to be improved so that there is a change of at least become category of good and even excellent which are Security of parking lots, Security of campus at night, Readiness of cam-pus in emergency situation, The park and public space in Faculty is pretty good, and Cleanliness of toilets should always be maintained.
REFERENCES
Alma, B. 2003. Pemasaran Strategik Jasa Pendidikan. Bandung: Alfabeta.
Basu, S. 2000. Manajemen Pemasaran Modern. Yogyakarta: Liberty.
Cooper, D.R., & Schindler, P.S. 2003. Business Research Method. Eight Edition. New York: McGraw Hill. Cutlip, S.M., Center, A.H., & Broom, G.M. 2000. Effective
PR. Jakarta: Kelompok Indeks Gramedia.
Ernie Trisnawati Sule. 2014. Pengantar Manajemen Edisi ke 18. Bandung: Penerbit Prenadamedia Group.
Indrajit, E. 2006. Manajemen Perguruan Tinggi Modern. Yogyakarta: Penerbit Andi.
Jefkins, F. 1992. Public Relations.Edisi Keempat. Jakarta: Erlangga.
Kotler, P. 1996. Marketing Manajement: Analysis, Plan-ning, Implementation, and Control. (Manajemen Pemasaran).ed. 6. Jakarta: Erlangga.
Kotler, P., & Armstrong, G. 2004. Principles of Marketing. New Jersey: Prentice Hall.
Kotler, P., & Keller, K. 2009. Manajemen Pemasaran. Edisi Kedua Belas Jilid 1. Indonesia: PT Indeks.
Kotler, P. 2000. Manajemen Pemasaran. Jakarta: Erlangga. Lovelock, C., & Wright, L. 2007. Sercive Marketing and
Management. New Jersey: Prentice Hall.
Lupiyoadi, R. 2001. Manajemen Pemasaran Jasa. Jakarta: Salemba Empat.
Loudon, D., & Albert, J.D.B. 1993. Consumer Behaviour Concept and Application. Mc Grow Hill Book. Co. Robinson, W.A. 1998. Promosi Penjualan Terbaik “Seri
Pemasaran” dan Promosi.
Sugiyono. 2010. Metode Penelitian Kuantittatif dan Kualitatif R & D. Bandung: Alfabeta.
Sutisna & Pawirtra. 2001. Perilaku Konsumen dan Komunikasi Pemasar. Ban dun g: PT Remaja Rosdakarya.
Stanton, J.W. 2001. Prinsip-prinsip Pemasaran. Jilid Ketujuh. Jakarta: Penerbit Erlangga.
Tjiptono, F. 2006. Pemasaran Jasa. Malang: Banyumedia Publising.