‘Restoring Order’? Operation Murambatsvina
and the Urban Crisis in Zimbabwe
Deborah Potts
(Cities Research Group, Geography Department, King’s College, London)
Zimbabwe is experiencing a profound economic crisis, which has devastated the livelihoods of most of its urban population and created conditions of extreme poverty in its towns. Since independence, the state has generally adhered to housing policies that have made it both difficult and expensive for low-income urban residents to comply with legal housing requirements. However, in comparison to most other sub-Saharan African countries, in Zimbabwe the extent of illegal, freestanding urban housing areas has remained relatively limited, forcing many to house themselves in illegal backyard shacks within the plots of formal townships. These shacks were, to some extent, increasingly tolerated during the 1990s and early 2000s as poverty increased. Huge growth in informal employment has also accompanied the country’s urban economic crisis. In mid-2005 the Zimbabwean government embarked on a far-reaching and unprecedented campaign within its towns; Operation Murambatsvina (‘Restore Order’) was designed to eradicate ‘illegal’ housing and informal jobs, which directly affected hundreds of thousands of poor urban residents. According to the government this drastic policy was necessary to eradicate illegal housing and activities from the cities although such justifications obscure far deeper economic and political causes. This article surveys and analyses this campaign with reference to trends in incomes, employment and housing and shifts, both apparent and real, in government policy towards these. The article emphasises the injustice of enforcing urban ’order’ when the symptoms of poverty thereby tackled have been forced upon the urban poor, and not chosen by them.
Introduction
At the beginning of the 1990s, the urban population of Zimbabwe was less poor, and generally more economically and socially secure, than probably any other African urban population in sub-Saharan Africa. For a decade the trend in urban poverty levels, measured by a variety of surveys, had been downwards. Shortly after independence in 1980, a major survey of over 1,000 low-income households living in Harare’s high density areas (HDAs) found that just under a third of households had incomes below the minimum industrial wage.1 By 1991, another survey found that only 10 to 15 per cent of HDA households in the city had incomes below that particular income measure.2 The proportion below the poverty line calculated for that year had similarly decreased since the early 1980s from about 60 per cent to 25 – 30 per cent.3
ISSN 0305-7070 print; 1465-3893 online/06/020273-19
q2006The Editorial Board of the Journal of Southern African Studies DOI: 10.1080/03057070600656200 1 M.C. Hoek-Smit,Housing Demand Study, Harare, Draft Report(prepared for US Agency for International
Development, Harare, mimeo, 1982).
In addition to these income measures, there were other indicators of urban socio-economic success, relative to the rest of sub-Saharan Africa. Most male household heads were employed in the formal sector. Minimum wages for different employment categories were hardly generous, but they were not completely out of line with the costs of the most basic needs of an urban household (as is common today in sub-Saharan African cities). They were also enforced. Social services functioned relatively well and were free for many of those on very low incomes. Since the urban infrastructure also functioned, the vast majority of the urban population, whether poor or rich, had access to potable water and electricity except during the severest droughts.
By September 2003 the urban situation in Zimbabwe could hardly have been more different: 72 per cent of urban households were defined as poor; this included 51 per cent deemed to be ‘very poor’, meaning that they could not afford to buy enough food, let alone anything else.4 Within the HDAs, where the earlier surveys cited above were conducted, 77 per cent of households were poor and 57 per cent very poor. In these areas, where the majority of Zimbabwe’s urban people live, the proportion below the poverty line had thus roughly trebled in twelve years. In addition, urban water and electricity supplies were increasingly sporadic, and urban health and education services increasingly expensive. Taken together, these indices demonstrate an extraordinarily rapid decline of urban living standards so that, by 2005, they were no longer remarkable when compared to other African cities and towns and, indeed, were worse than many.
The purpose of sketching these trajectories of urban poverty in Zimbabwe is that they have been associated with the development of increasingly informalised urban employment and ‘illegal’ low-income housing solutions across the urban hierarchy and these two developments, in turn, became the prime targets of Operation Murambatsvina (‘Drive out the rubbish’ or ‘Restore Order’)5 – the ZANU-PF government’s drastic campaign which swept through the urban areas of the country from May to July 2005.6The aims of this article are, first, to outline the main features and outcomes of that campaign and, second, to examine critically the nature of urban poverty and low-income housing in contemporary Zimbabwe and the interrelationship between these and the government’s operation. This analysis is based on the extensive secondary sources on Operation Murambatsvina, which emerged almost immediately from various agencies and non-governmental organisations (NGOs), even as the campaign progressed,7on a national urban vulnerability assessment conducted in 2003,8and on 20 years of research on urban
4 Zimbabwe National Vulnerability Assessment Committee [hereafter ZNVAC] (in collaboration with the SADC FANR Vulnerability Assessment Committee), Zimbabwe: Urban Areas Food Security and Vulnerability Assessment, September 2003 (Harare, Urban Report No. 1, 2004). [www.reliefweb.int/library/documents/ 2003/govzim-zim-30sep.pdf]
5 Murambatsvina can be variously translated from chiShona. ‘Drive out the rubbish’ is one possible rendition, although the government preferred to translate it as ‘Restore Order’.
6 The campaign trickled on beyond July, but the main damage was done.
7 A. Tibaijuka,Report of the Fact-Finding Mission to Zimbabwe to Assess the Scope and Impact of Operation Murambatsvina by the UN Special Envoy on Human Settlements Issues in Zimbabwe(United Nations, 2005) [http:// www.un.org/News/dh/infocus/zimbabwe/zimbabwe_rpt.pdf]; Zimbabwe Human Rights NGO Forum (ZHNGO),
Order out of Chaos, or Chaos out of Order? A Preliminary Report on Operation “Murambatsvina”(ZHNGO, June 2005); Action Aid International in collaboration with the Combined Harare Residents’ Association [hereafter Action Aid/CHRA],A Study on the Impact of ‘Operation Murambatsvina/Restore Order’ in 26 Wards of Harare High Density Housing Areas, (July 2005) [www.sarpn.org.za/documents/d0001388/index.php]; Centre on Housing Rights and Eviction, Human Rights Watch, “Clear the Filth”: Mass Evictions and Demolitions in Zimbabwe, (backgrounder, September 2005), [http://hrw.org/backgrounder/africa/zimbabwe0905/]; Solidarity Peace Trust,
Discarding the Filth: Operation Murambatsvina: Interim Report on the Zimbabwean Government’s ‘Urban Cleansing’ and Forced Eviction Campaign, May/June 2005 [http://www.ijr.org.za/transitionaljustice/zim/sptdf]; Trocaire,Chronology of Events Since Housing Demolition, Zimbabwe[http://www.trocaire.org/international/africa/ zimbabweevents.htm]; Report to South African Council of Churches, Pastoral Visit to Zimbabwe on 10–11 July 2005 [http://www.zimbabwesituation.com/jul19_2005.html]
livelihoods, low-income housing and migrants in Harare9 and the impact of economic liberalisation on urban livelihoods throughout sub-Saharan Africa more generally.10
Operation Murambatsvina: A Tsunami
11for the Urban Poor
On 19 May, Sekesai Makwavarara, the Chair of the government-appointed Harare Commission that was running the city, announced at Harare’s Town House that the City of Harare intended to embark on Operation Murambatsvina, a programme to:
enforce by-laws to stop all forms of illegal activities. These violations of the by-laws in areas of vending, traffic control, illegal structures, touting/abuse of commuters by rank marshals,12 street-life/prostitution, vandalism of property infrastructure, stock theft, illegal cultivation, among others have led to the deterioration of standards thus negatively affecting the image of the City. The attitude of the members of the public as well as some City officials has led to a point whereby Harare has lost its glow. We are determined to bring it back.... It is not a once-off exercise but a
sustained one that will see to the clean-up of Harare.... Operation Murambatsvina is going to be
a massive exercise in the CBD and the suburbs which will see to the demolition of all illegal structures and removal of all activities at undesignated areas...
13
Amidst mounting disbelief, then horror, from most Zimbabweans and international agencies worldwide, this is precisely what the ‘City’ proceeded to do. The campaign truly was ‘massive’ – nothing on this scale in such a short duration has ever been witnessed in urban Africa, not excluding apartheid South Africa – and spread right throughout the urban hierarchy from the capital city down to small ‘growth centres’ in communal areas. The government was as good, or rather as bad, as its word: the vast majority of the informal sector enterprises and trading locations and houses (and other buildings) that were destroyed had contravened some by-law or another although, as the condemnation of the campaign mounted, many were swift to point out that some ‘legal’ buildings were being destroyed too. This was a major issue for the international media, although their focus on this was somewhat misplaced. Possibly it stemmed from a lack of appreciation that some element of ‘illegality’ in relation to, for example, building
9 D. Potts and C.C. Mutambirwa, ‘High-Density Housing in Harare: Commodification and Overcrowding’,Third World Planning Review, 13, 1 (1991), pp. 1 – 26; D. Potts and C.C. Mutambirwa, ‘Rural-Urban Linkages in Contemporary Harare: Why Migrants Need Their Land’,Journal of Southern African Studies, 16, 4 (1990), pp. 676– 96; D. Potts and C.C. Mutambirwa, “Basics are Now a Luxury”: Perceptions of ESAP’s Impact on Rural and Urban Areas in Zimbabwe’,Environment and Urbanization: Special Issue on ‘Beyond the Rural-Urban Divide’, 10, 1 (1998), pp. 55 – 76; D. Potts, ‘Urban Unemployment and Migrants in Africa: Evidence from Harare, 1985– 94’,Development and Change, 31, 4 (2000), pp. 879– 910; D. Potts, ‘“All my Hopes and Dreams are Shattered”: Urbanization and Migrancy in an Imploding Economy – Zimbabwe in the 21st century’,
Geoforum(forthcoming 2006).
10 D. Potts, ‘Urban Growth and Urban Economies in Eastern and Southern Africa: Trends and Prospects’, in D. Bryceson, and D. Potts (eds),African Urban Economies: Viability, Vitality or Vitiation of Major Cities in East and Southern Africa?(Houndmills, Basingstoke, Palgrave, 2005); D. Potts, ‘Regional Urbanization and Urban Livelihoods in the Context of Globalization’ in D. Potts, and T. Bowyer-Bower (eds), Eastern and Southern Africa: Development Challenges in a Volatile Region (Harlow, Pearsons, IBG/DARG Series, 2004), pp. 328– 68; D. Potts, ‘Counter-Urbanization on the Zambian Copperbelt? Interpretations and Implications’,Urban Studies, 42, 4 (2005), pp. 583 – 609; D. Potts, ‘Urban Lives: Adopting New Strategies and Adapting Rural Links’, in C. Rakodi (ed.),The Urban Challenge in Africa: Growth and Management of its Large Cities(Tokyo, United Nations University Press, 1997), pp. 447 – 94; D. Potts, ‘Shall we go home? Increasing Urban Poverty in African Cities and Migration Processes’,Geographical Journal, 161, 3 (1995), pp. 245– 64.
11 The operation was nicknamed Operation Tsunami by the victims, due to its speed and ferocity.
12 These are the men who control access to the ‘kombis’ (minibuses) at ‘taxi ranks’ which provide most urban people with their means of public transport.
standards is ubiquitous in low-income housing in the cities of developing countries worldwide (even when land tenure is legal), and that similar campaigns in many other countries could easily render half or more of the urban population homeless. Less charitably, it may have represented a view that poor, ‘shanty’ housing (the term most used in the television reports) somehow, regrettably, deserves demolition – a view that assumes that the occupants had some reasonable alternative and/or that their rights and needs are less important than those in legal houses. If this was the reason for the focus on the demolition of a minority of ‘legal’ housing, the logic of the opposition to the campaign was severely weakened, given that these were precisely the views expressed by the Zimbabwean government.
It soon became clear that, unlike previous operations against ‘informality’ in the urban areas which Zimbabwean authorities had mounted from time to time,14the numbersdirectlyaffected would not be in the hundreds or even thousands, but in the hundreds of thousands. The most authoritative report, produced by a special envoy from UN (Habitat), Anna Tibaijuka, estimated in July 2005 that around 650,000 to 700,000 people had lost either the basis of their livelihoods or their homes, or both. This was based on the government’s own estimates and average household size, plus information gathered from a variety of different organisations and individuals within the country. It is curious to note that the official figures were not a gross underestimate, as might have been expected, given the level of the international and local outcry. The government figures suggested that 92,460 dwelling units had been razed, leading to around 570,000 people, or 133,534 households, losing their homes; a further 98,000 were reported to have lost their informal sector livelihoods. On the one hand, this perhaps reflected the fact that the government felt it had little to lose, since it was already in such deep trouble with the international financial and human rights community and had long been cut off from most sources of all but the most pressing humanitarian aid. On the other hand, it may have reflected a belief in the ‘legitimacy’ of the operation and thus that there was no reason to hide anything.
The UN mission also endeavoured to assess knock-on impacts in terms of, for example, other livelihoods lost, which were linked to the activities of informal sector traders. The final total population affected, directly and indirectly, was estimated as 2.4 million people.15Such figures are notoriously difficult to verify, and can be subject to large errors if the assumed multipliers used are wrong. However, in the absence of better estimates, this figure, representing about a fifth of Zimbabwe’s people, is the one most widely cited in reports and analyses of Operation Murambatsvina.
A Harare-based survey, by Action Aid and the Combined Harare Residents’ Association (CHRA), covering a very large sample of 14,137 respondents from 26 affected high density (i.e. low-income) wards in the capital city, was conducted towards the end of the campaign.16The
14 Official opposition, from either the central government or city governments, to informal housing and employment in urban areas was definitely not unprecedented in Zimbabwe – it was the scale and thoroughness of Operation Murambatsvina which set it apart. Furthermore this opposition had fluctuated over time and between different forms of government, and there had been a notable downturn in the central government’senforcementof many regulations as the 1990s progressed; see A. Kamete, ‘Civil Society, Housing and Urban Governance: The Case of Urban Housing Co-operatives in Zimbabwe’, in A. Tostensen, I. Tvedten and M. Vaa (eds),Associational Life in African Cities: Popular Responses to the Urban Crisis(Uppsala, Nordiska Afrikainstitutet, 2001); A. Kamete, ‘US AID’s Private Sector Housing Programme in Urban Zimbabwe: Examining the Terrain from the Terraces’,
Environment and Urbanization,13, 1 (2001), pp. 125– 35; O. Musandu-Nyamayaro, ‘Housing Design Standards for Urban Low-Income People in Zimbabwe’, Third World Planning Review, 15, 4 (1993), pp. 329 – 54. Nonetheless, this did not represent a true change of commitment to ‘order’ by many in the government and I have argued that a prevalent official ideology of a planned and modern urban environment was one of the factors underlying the instigation of Operation Murambatsvina; see D. Potts, ‘City Life in Zimbabwe at a Time of Fear and Loathing: Urban Planning, Urban Poverty and Operation Murambatsvina’, in G. Myers and M. Murray (eds),
Cities in Contemporary Africa(Palgrave, forthcoming 2006). 15 Tibaijuka,‘Report of the Fact-Finding Mission to Zimbabwe’.
survey endeavoured to uncover the scale and extent of the impact of Operation Murambatsvina on livelihoods and shelter. The geographical coverage was admirably wide – only four of a total of 30 high density wards were unsampled, because the CHRA could not access them. These were all of Kuwadzana, Epworth and two wards of Dzivarasekwa. Kuwadzana and Dzivarasekwa, on the western edges of Harare, are very large, post-independence, planned, mainly site-and-service settlements. Epworth, to the south-east of Harare, on the other hand, was originally unplanned and the largest urban settlement of this type in the country. It was extremely badly affected despite major upgrading programmes in the 1980s and 1990s. It was thus particularly unfortunate that this settlement had to be excluded from the survey.
There are a few methodological problems with this survey which cause some difficulties when interpreting the results. The report asserted that one-third of thehomesteadsper ward were interviewed by systematic sampling and that this represented one-third ofhouseholdsin the wards. In fact, approximately 500 respondents from 500 individual households per ward were interviewed and this was significantly less than a third of the total in any high density ward, even according to the 1992 census.17There would have been further growth in the numbers since then, although subsequent population growth in Zimbabwe’s urban areas has been very much reduced, compared with the 1980s (as has national population growth). There was also considerable confusion over the term homestead, which was defined as a dwelling where one or more households could reside.18The survey stated that an average of three households were found at each homestead, but in fact this appeared to relate to theplotupon which various houses and structures, housing different households, would be built. There are reasons, therefore, to be cautious about the totalnumbersof people reported as affected by Operation Murambatsvina in Harare.19 However, given that the sampling seems to have been sound, some of the other proportional results and conclusions appear more useful (see Table 1).20
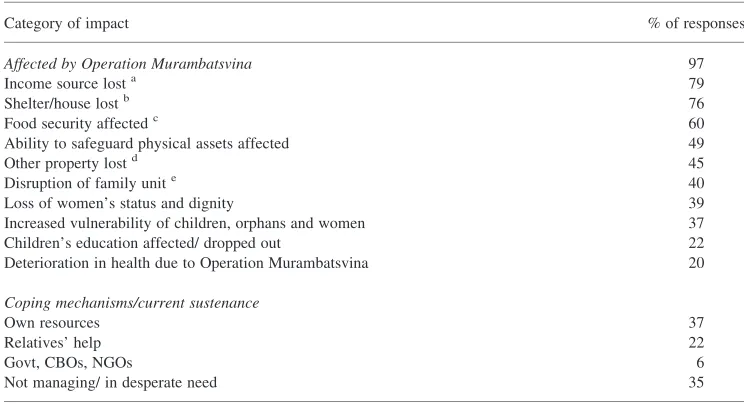
The survey found that nearly every household interviewed (97 per cent) had been negatively affected; in the vast majority of cases, at least one source of household income had declined or been lost as a result of Operation Murambatsvina. While it is not clear whether this related specifically to the primary source of household income, which was also recorded, it indicates the scale and breadth of the economic disaster visited upon urban households. In most cases it can be assumed that these income losses related to informal sector activities, which were one of the Operation’s prime targets.21 The next largest category of negative impacts (76 per cent) was losing shelter, unsurprisingly, since demolishing informal housing was the other prime purpose of the campaign. There was an element of double-counting here,
17 As an illustration, the 1992 census enumerated 9,077, 5,863, 3,072 and 6,486 households in the four wards of Mbare, the oldest colonial-era township and most densely populated of Harare’s high density areas. In other older townships, the three wards of Highfields had about 26,000 households altogether and the three wards of Glen Norah around 21,000. Even the much newer, post-independence Budiriro had almost 9,000 households. The average HDA household size used by the survey, 5.8, on the other hand, is very much higher than those reported in the census and many other surveys, which is around 4.2. See Central Statistical Office, Census 1992, Provincial Profile, Harare(Harare, Central Statistical Office, 1994).
18 Action Aid/CHRA,A Study on the Impact of “Operation Murambatsvina/Restore Order”, p. ix.
19 On the basis of various assumptions, a total of 851,434 people were reportedly affected in the Harare HDAs. This calculation did recognise that, at best, the survey’s coverage could not have exceeded one-ninth of HDA households, i.e. one-third of the three households at every thirdhomestead/plot. However, even this does not tally with the households enumerated over ten years before, during the 1992 census.
20 One final note of caution is necessary as it is not stated how interviewers decided which household on any one plot to interview, and one of the first questions was ‘When were you affected by Operation Murambatsvina?’ (rather than ‘Were you...?’) and there is nowhere on the schedule to record that they were not. Thus there may
have been an inbuilt bias to interviewing respondents who affirmed that they had been affected.
as loss of rentals was also included as a possible lost source of income. Food security was also badly affected, with most households reporting negative impacts. This could have occurred in two ways. First, the loss of incomes would have made food less affordable and, as will be seen later, many urban households would already have been struggling to feed themselves adequately. Second, the disruption of informal markets,22 tuckshops in the HDAs and informal food vendors would affect the food supplies of nearly the entire HDA population, which would have used all these to varying degrees. It is worth noting, too, that although food from off-plot urban agriculture would not have been playing much part in urban diets by the dry months of June and July, it has become an increasingly important source of many poor people’s food supplies at other times of the year, and the Operation vowed to stamp this out in the future as well. Although the government has often made this threat in the past, and frequent rounds of crop-slashing have occurred,23this has not deterred urban residents, but the violent determination of the government evidenced by Operation Murambatsvina may close off this way of ameliorating urban poverty and hunger in the future.
Various other negative impacts were also reported, as shown in Table 1. As many newspaper reports indicated, people’s health was severely compromised. There were reports of direct deaths from the demolitions or police action. Other deaths because of the cold, particularly of very vulnerable people like babies, were reported for families forced to live in the open.24The latter would not have been picked up in this survey as it covered only people on HDA plots, and not those living on waste ground or open space. Nonetheless one-fifth of those in the HDA survey had experienced negative health impacts. A particularly serious problem, discussed in a number of reports, was the inevitable increase in death rates from HIV/AIDS. Adult prevalence rates in Zimbabwe are around 25 per cent. The evictions caused by Operation Murambatsvina meant that many chronically ill HIV/AIDS sufferers were left sleeping outside or forced to move to rural areas. Dozens of home-based care and treatment programmes in urban areas were disrupted. Food security, as discussed above, has been worsened and people with HIV/AIDS are more endangered than most by poor diet. Human Rights Watch reported that one Harare care centre found that three-quarters of its volunteers, all of whom were HIV-positive, lost their homes in the Operation. In Mutare one volunteer alone reported that five of his clients had died because they had been forced to sleep outside. The longer term effects predicted include an increase in resistance to HIV drugs because people on anti-retroviral regimes, which need strict observance, will have been forced to abandon their medicines. Hundreds of extra deaths were predicted, including those of new-born and small babies.25
The Action Aid/CHRA survey in Harare also enquired about how households were coping with the aftermath of Operation Murambatsvina (see Table 1). While just over a half felt that they were managing some sort of existence with either their own resources, or the assistance of relatives, and a further very small proportion were being aided by various organisations, about a third simply said they werenotmanaging. Of these ‘desperate’ households, 76 per cent were
22 In Harare the market sites demolished included the retail vegetable market (leading to the closure of the wholesale market); Mupedzanhamo, which was the main market for secondhand clothes and traditional medicines; and Siyaso, a site where hardware and building materials were sold. See B. McGarry, ‘Wreckage of the Tsunami’, report posted to [email protected], 30 June 2005.
23 B. Mbiba, Urban Agriculture in Zimbabwe: Implications for Urban Management, Urban Economy, the Environment, Poverty and Gender (Aldershot, Avebury, 1995); D. Drakakis-Smith, T. Bowyer-Bower and D. Tevera, ‘Urban Poverty and Urban Agriculture: An Overview of Linkages in Harare’,Habitat International, 19, 2 (1995), pp. 183– 93.
24 See, for example, BBC News, ‘AU Rejects Action on Zim – South Africa “Irritated”’, 24 June 2005 [http://news. bbc.co.uk/go/pr/fr/-/1/hi/world/africa/4618341.stm]; C. Lamb, ‘Mugabe Policy Branded “New Apartheid”’,
Sunday Times, 12 June 2005;New York Times, ‘U.N. Condemns Zimbabwe for Bulldozing Urban Slums’, 23 July 2005 [http://www.nytimes.com/2005/07/23/international/africa/23nations.html?th&emc¼th].
headed by women or, even more tragically (and presumably largely due to the impact of AIDS deaths), by children. Assistance required included shelter, food and money. Unsurprisingly, the survey report ended with a strong plea to possible sources of such assistance for urgent action. A further aspect of Operation Murambatsvina, which requires brief exposition here,26is the determination of the ZANU-PF government that the people displaced by the campaign should ‘return’ to the rural areas. Such a policy assumes homogeneity of background, rural linkages and assets and long-term aspirations amongst the urban population, which is all too easily disproved, and nearly all the reports go to some length to do just that.27Given the active significance for many urban people’s livelihoods of urban-rural links in sub-Saharan Africa,28the potential forsomeurban people to go to rural areas, particularly when ‘push comes to shove’ – a horribly apt metaphor for Operation Murambatsvina – is self-evident. At the same time, when discussing this characteristic of African urbanisation, the importance of disaggregating the urban population and recognising that this isnota likely, or reasonable, option for the majority today, is also something that I would emphasise.29
Table 1.Impact of Operation Murambatsvina in Harare’s High Density Areas
Category of impact % of responses
Affected by Operation Murambatsvina 97
Income source losta 79
Shelter/house lostb 76
Food security affectedc 60
Ability to safeguard physical assets affected 49
Other property lostd 45
Disruption of family unite 40
Loss of women’s status and dignity 39
Increased vulnerability of children, orphans and women 37 Children’s education affected/ dropped out 22 Deterioration in health due to Operation Murambatsvina 20
Coping mechanisms/current sustenance
Own resources 37
Relatives’ help 22
Govt, CBOs, NGOs 6
Not managing/ in desperate need 35
Source:compiled and adapted from data in Action Aid/CHRA 2005 (see footnote 16)
Notes:
a. The questionnaire indicates this could beonesource of household income – it therefore may not be all sources or the primary source.
b. Includes tenants being evicted and landlords and landladies losing rental units as a result of demolitions. c. Many urban families were already food insecure before Operation Murambatsvina (mainly because of affordability
issues) so this must indicate an increase in this form of insecurity in many cases.
d. Including possessions destroyed in house demolitions, property seized by police, artisans and vendors selling tools and products at knockdown prices to minimise losses.
e. This mainly involved children and/or wives going to rural areas.
26 For a more detailed analysis of this aspect of the campaign see Potts, ‘City Life in Zimbabwe at a Time of Fear and Loathing’.
27 The report by the Solidarity Peace Trust, ‘Discarding the Filth’, is particularly useful in this respect, in that it provides an analysis of the perceptions and views of people displaced from Killarney in Bulawayo about the government’s drive to push them out of the city.
Furthermore,forcedmigration is a direct contravention of human rights. Having made clear the injustice of this aspect of Operation Murambatsvina, the question arises of where the people displaced have actually gone? Definitive estimates are unlikely. Early reports indicated that many who lost their houses had moved in with urban kin, although many others were living on waste ground, by the roads, or moved in to churches, from which they were yet again displaced.30It was also clear, however, that there were significant numbers who had, often reluctantly, moved out of the urban areas. One indication of this is shown in Table 1 (see the section below), whereby 40 per cent of respondents in one Harare-based survey stated that their urban-based family unit had been disrupted, mainly because a wife and/or children had gone to rural areas. Broader estimates suggested that 114,000 (20 per cent of those displaced) had gone to rural areas in the short term.31
Having elaborated on the terrifying scale, implacable thoroughness, and tragic impacts of Operation Murambatsvina, this article will now analyse the relationship between the campaign and some of the specific features of Zimbabwe’s urban housing sector, and urban employment and poverty trends. This includes an attempt to clarify some fairly common misunderstandings about these issues, some of which were apparent in the agency and media reports on Operation Murambatsvina, and also to identify elements that made action like this feasible in the Zimbabwean urban context.
Low-Income Housing Types and the Distribution of Urban Poverty
in Zimbabwe
The impression given by some media and other reports on Operation Murambatsvina was that Zimbabwe’s urban areas were characterised by informal settlements and that removing these was leading to a massive redistribution of the population, but these were somewhat misleading. Much time and emphasis was given, for example, to the wholesale destruction of settlements like Hatcliffe Extension on the northwest edge of Harare,32Porta Farm, a holding camp for many evictees from various illegal settlements in and around Harare which had itself been threatened with demolition prior to Operation Murambatsvina,33and Killarney, a long-established informal settlement in Bulawayo.
Comparisons with Pol Pot’s drive against urban people and culture were also made, but the holistic ideological nature of that terrifying policy has not been replicated in Zimbabwe, where superficially the drive was against ‘disorderly’ urbanisation, not urbanisationper se. The question therefore arises of how many people were living in the sorts of informal buildings which the Operation targeted, and why they were living there. It is always difficult to know what proportion of urban dwellers are living in different categories of settlement or dwellings in African cities, particularly when there is a mixture of ‘illegal’ structures and legal family houses within formal low-income settlements, as in Zimbabwe. However,
30 ‘Mugabe’s Demolitions Target Churches’,The Tablet, 29 July 2005 [http://www.thetablet.co.uk/cgi-bin/register. cgi/citw-past-00241].
31 Human Rights Watch, ‘Clear the Filth’, p. 32. Of the 700,000 or so estimated to be displaced, 114,000 (20 per cent) were estimated to be in the open with no shelter; 170,000 (30 per cent) with friends and family; and 170,000 (30 per cent) in churches and other temporary types of shelter.
32 Habitat International Coalition, Housing and Land Rights Network, ‘Urgent Action Appeal: 200,000 People Evicted in Two Weeks and Another Million Threatened in Zimbabwe’. Case ZIM100605, 13 June 2005; N. Dixon, ‘Zimbabwe: Mugabe’s Terror Campaign Against Workers, Urban Poor’,Green Left Weekly, 8 June 2005. [http://www.greenleft.org.au/back/2005/629/629p20.htm]; ‘Zim Deploys 3000 Riot Police to Destroy Homes’, Mail & Guardian (SA), 27 May 2005; Associated Press, ‘Zimbabwe Police Destroying Illegal Settlements’, 28 May 2005.
a national urban vulnerability assessment of over 5,000 households was conducted in September 2003. The study included carefully stratified, and proportional, coverage of different categories of settlement within the towns, and in different types of town down to mines and business centres in communal areas. It also distinguished between formal low, medium and high density areas and ‘squatter settlements’, and it provides useful guidance on the housing situation prior to Operation Murambatsvina, which can be related to the evictions and demolitions of mid-2005.
Before turning to an analysis of this survey, the definition of informal and squatter settlements requires some consideration, as do the main types of urban housing in Zimbabwe. In the mainstream housing literature, squatter settlements are defined as those with illegal
tenure. The key issue, therefore, is that the residents do not have legal rights to the land upon which their houses are built, whether that land be under capitalist, freehold forms of ownership or some form of customary tenure. Aninformalsettlement is usually one that is unplanned by, for example, the municipal or town authority.34It is therefore possible for people to have obtained the right to settle on the land from the owner or the authority controlling access, and thus not be squatters, but still to be in contravention of various urbanzoning plans. An example would be a residential settlement built on land zoned for industry, agriculture or leisure. Furthermore, nearly all former African colonies have inherited a complex paraphernalia of regulations and by-laws pertaining to, for example, building materials, room size, distance between houses and from the edge of a plot, the building of new structures on-plot and development of non-residential activities, and the availability of services such as water; they also cover regulation of trading and markets. Most of these by-laws remain on the rule books although they are, to put it mildly in the case of most African towns, honoured more in the breach than the observance. In some cases they are honoured virtuallyonlyin the breach! There are also the awkward terms ‘shanty’ and ‘slum’ which have no clear definition and tend to be defined by the eye of the beholder – one person’s shanty may be another’s wonderful, spacious opportunity to obtain some privacy and comfort for their family. In many cases, however, shanty is used loosely, to denote untidy-looking, irregular housing where unfamiliar or inferior materials, to ‘modern’ western eyes, are much in evidence (for example, corrugated iron, packing cases, wooden panels, plastic). These need not be illegal, depending on tenure arrangements and local building regulations (with which they rarely comply). Slums, again, can vary in their tenure conditions but are usually understood to have serious overcrowding and excessively poor physical conditions, which are a health hazard.
In Zimbabwe, prior to Operation Murambatsvina, urban housing types could be categorised simplistically by ‘density’. Low Density Areas (LDAs) were generally the former white areas with freehold tenure, large plots and good quality large houses. Medium Density Areas (MDAs) had smaller plots and houses, but were otherwise similar in servicing standards and so on. The low-income housing areas were termed High Density (HDAs) and included the colonial-era ‘townships’, where the house was formerly rented and built by the government or municipality, such as Mbare or Highfields in Harare or Makokoba in Bulawayo, and postcolonial site-and-service settlements like Harare’s Kuwadzana or Budiriro, and most of the units of Chitungwiza.35These houses are generally owned, or rented-to-own, on a freehold
34 To complicate matters further, in South African housing circles, uniquely, ‘informal’ is used to describe some planned and zoned residential settlements for low-income people where housing construction is based on site-and-services or, again using South African nomenclature, ‘incrementalism’. Residents then can build their own homes, or contract others, to build their houses gradually. The short- to medium-term outcome may be a highly variable physical environment with a mixture of permanent and impermanent building materials. In this article the term ‘informal’ is used in the usual sense of unplanned.
basis nowadays, most often by one of the occupants or a member of their kin, but also possibly by an absent landlord or landlady.36
Township houses are generally detached or semi-detached, small, one-storey dwellings. When completed, the newer site-and-service houses look, from the outside at least, highly formal – the most common format is a modern, detached bungalow.37In many of these houses some of the rooms would be rented out to lodger households, with the ‘owners’ taking up only a proportion of the space. This was legal.38However, on some HDA plots there were also backyard shacks. Ubiquitous in some HDAs, such as Mbare, these were built around the edge of the plot or sometimes as extensions to the main house and rented out to lodgers by the house-owner. The central ‘family’ house remained legal. Backyard shacks were not. In the HDAs it was illegal to build any such structure for occupation. In MDAs and LDAs it was not, and servants’ quarters were usually part of the original layout in the latter, but planning permission had to be obtained for any new ‘cottages’ as they tended to be called. Permission was often hard to obtain and their building was not encouraged. In some cases they were built nonetheless, in the hope that the bureaucracy was too distracted or unconcerned to take action.
There were also some free-standing squatter settlements39in urban Zimbabwe, meaning groups of houses without legal land tenure which were not within HDA plots but, as will be seen below, these were rare. In addition, there were areas of unplanned urban housing which had been subsequently legalised and upgraded.40The most significant by far was Epworth, which was just beyond Harare’s southeastern border at independence, and was subsequently incorporated into the city.41There were also a number of sites, usually on or just beyond the urban periphery, where the government had moved people from illegal sites within the city. These included Hatcliffe Extension and Porta Farm which, as already mentioned, were cleared under Operation Murambatsvina and received significant media attention. Housing co-operatives also developed as a means of assisting the financing and building of site-and-service houses.42A number of these were set up by war veteran groups. Fast-track land resettlement after 2000 provided access to some former farming land around towns, and co-operatives were often established to provide urban housing there.43 An example was Tongogara Park on White Cliff Farm near Harare, which also received media and agency scrutiny. Although many of those who had built houses in the peri-urban co-ops and government-assigned ‘holding camps’ for previous squatters had been given permission to build and could often show legal documents to prove they had a right to build on the land they were on,44the extent to which their houses complied with the many other regulations previously mentioned, was another question. Being built of breeze blocks or brick is not enough to measure up to Zimbabwe’s
36 On Rhodesian and Zimbabwean housing policy, and the mass shift to home-ownership policies and also to privatised provision of low-income housing loans, see Rakodi, Harare: Inheriting a Settler Colonial City; P. Bond,Uneven Zimbabwe. A Study of Finance, Development and Underdevelopment(Trenton and Asmara, Africa World Press, 1998); Potts and Mutambirwa, ‘High-Density Housing in Harare’; A. Musekiwa, ‘Low-Income House Development in Harare: A Historical Perspective’, in L. Zinyama, D. Tevera and S. Cumming (eds),Harare: The Growth and Problems of the City(Harare, University of Zimbabwe Publications, 1993); C. Mafico,Urban Low Income Housing in Zimbabwe(Aldershot; Brookfield, Vermont, Avebury, 1991). 37 The inside is another matter and highly variable. See Potts, ‘City Life in Zimbabwe’.
38 Nonetheless, it is not hard to imagine a determined bureaucrat pointing out that by-laws on space provision may be being breached in some houses.
39 This is another South African housing term, rarely used in other low-income housing literature but very useful in southern African circumstances in distinguishing between backyard shacks and ‘proper’ squatter settlements. 40 Upgrading means that land tenure is legalised, and services improved. The secure tenure generally encourages
people to invest and improve their homes which, for obvious reasons, they fear to do prior to this. 41 See C. Butcher, ‘Upgrading in Epworth’, in Zinyamaet al.(eds),Harare.
42 See Kamete, ‘Civil Society, Housing and Urban Governance’.
43 See N. Marongwe, ‘The Fast Track Resettlement and Urban Development Nexus: The Case for Harare’ (paper presented at Symposium on Delivering Land and Securing Rural Livelihoods: Post Independence Land Reform and Resettlement in Zimbabwe, 26 – 28 March 2003, Mont Clair, Nyanga, Zimbabwe, 2003).
urban housing standards.45Floors need to be of poured concrete, for example, and, as already described, there are a host of other regulations with which to comply. Furthermore, as the UN envoy discovered, many plots where demolitions occurred had not been serviced by the municipality and provided with water and sanitation, rendering the houses illegal even though the municipality had allocated the plots (often under central government instructions).
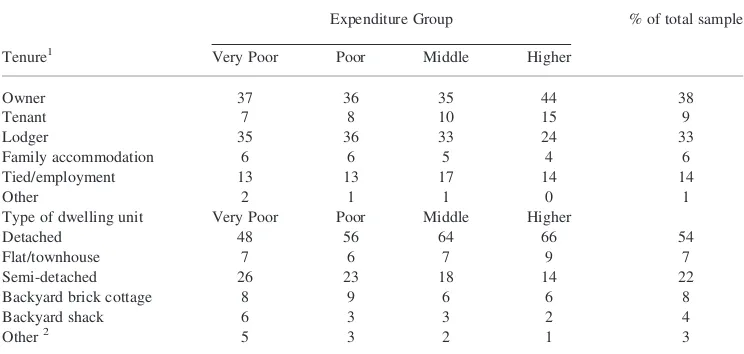
Returning to the urban vulnerability assessment conducted by the Zimbabwe National Vulnerability Assessment Committee (ZNVAC) in 2003, the results of this major sample survey on urban housing types and tenure across the country, disaggregated by income group, are shown in Tables 2 and 3. The survey did not define ‘squatter settlements’ by legality of tenure (i.e. whether the government had given formal recognition to the settlement and title deeds, as in parts of Epworth and Hatcliffe Extension), but rather by whether the settlement was ‘overcrowded’, type of structure and formality of layout. In other words, while it did not conform to the standard usage of ‘squatter’ in housing studies, preferring a definition that combined elements of popular understandings of ‘slums’ and ’shanties’, itdiddisaggregate the very free-standing settlements that were destroyed under Operation Murambatsvina, and the report specifies that this meant settlements such as Hatcliffe Extension and Porta Farm. In the analysis below, when referring to these areas, the term ‘squatter’ is used, for the sake of consistency with the report’s terminology. Within the residential areas the report did not distinguish backyard shack dwellers from residents of the ‘main’ house (see Table 1), but the sampling methodology did try to ensure that proportional coverage of these types of housing and their residents was made. Fortunately it did disaggregate income groups by types of dwelling unit, including backyard shacks, and tenure status (see Table 2).
This report thus provides useful insights into the recent distribution of Zimbabwe’s entire urban population by housing type. The final proportional sample was as shown in Table 2: with 6 per cent in peri-urban areas (presumed to have included Epworth), and only 0.8 per cent in ‘squatter camps’. In terms of residential areas (Table 1), by far the predominant type was the formal, planned HDA (although within these, there were many unplanned backyard shacks). Furthermore, the vast majority of housing types in Zimbabwe’s urban areas were detached and semi-detached houses, even prior to Operation Murambatsvina, and these accommodated around three-quarters of even the very poor and poor groups.
The urban population, according to the 2002 census and as used in the ZNVAC report, was around 3.87 million.46The results of the ZNVAC research thus suggested an urban ‘squatter’ population for the whole country of around 31,000 people only in 2003. The HDA population, including those in backyard shacks, was estimated at 2.6 million. While this appears to be an underestimation of the ‘squatters’, there is no reason to believe that the research would have tended
45 Newspaper and television reports often pointed out that ‘brick’ houses were being demolished.
46 The census data, including the urban statistics, are disputed by many. Understandably, much of this dispute arises from electoral issues. Space precludes a proper discussion of this issue here but, given known national fertility, mortality and emigration trends, the general patterns indicated in the census are nonetheless explicable and broadly consistent with expectations. All of these trends are established by demographic studies. As the national population enumerated in 2002 had grown much more slowly than in the previous decade, it has been variously argued that this was due to deliberate under-counting, especially in urban areas, to diminish the electoral roll and/or that it was due to mass emigration. The opposition estimates of emigration often run into some millions of people. In fact, these two arguments are somewhat at odds with one another as people cannot both still be in Zimbabwe and deliberately not counted, and out of the country. The fall in urban growth rates is also consistent with expectations, given the drastic decline in living standards evidenced in this article, which would discourage net in-migration and make natural increase within the cities the main element of population growth. While reports in government-dominated media must be treated with circumspection, a recent article on the census stated that the ‘bulk of the “missing millions” are missing because they were never born’; ‘Census Statistics Encouraging’,
The Herald Online, 22 August 2005 [http://www.zimbabweherald.com/index.php?id-46195&pubdate¼
particularly to neglect these areas as its purpose was to uncover poverty indices and coverage of such settlements would have been a priority. Hence, even if this was a conservative, or even very conservative, figure, it is clear that, despite the visible focus on demolitions in the freestanding ‘squatter’ areas, these contained a very small proportion of Zimbabwe’s urban people. This may seem surprising, except to those who are familiar with other sub-Saharan African countries and with Zimbabwean towns, and can take a generally comparative perspective of low-income housing. Zimbabwean towns simply were not typified by informal settlements on the scale of Kibera in Nairobi, or Ndirande in Blantyre, or the compounds of Lusaka, or Inanda in Durban, or Khayelitsha in Cape Town, or the squatter areas on the hills around Windhoek, let alone the massive informal settlements of Lagos or Kinshasa. The UN report on Operation Murambatsvina also noted the exceptionality of Zimbabwe in this respect; their own statistics estimated that in 2001 only 3.4 per cent of the urban population was living in ‘slums’ (which, as already stated, do not necessarily need to be illegal or to comprise ‘shanty’ areas), compared to 72 per cent for sub-Saharan Africa as a whole.47The reason for this is very simple: true squatters (in the tenurial sense) have nearly always been cleared away since (and, of course, before) independence; the development of large-scale, major settlements of this type was not allowed. No other African country has maintained such
continuityof official resistance to such settlements.48
If an estimate of around 600,000 people displaced from their homes by Operation Murambatsvina is of the right order of magnitude,49then one can make the following suggestions. In relation to the total urban population in 2002, 600,000 displaced accounts for about 15 per cent, or approximately one in seven. A minority would have come from freestanding squatter camps. A significant proportion could be accounted for by the demolitions in Epworth alone, which had a population of 114,000 in 2002, very much larger than the approximately 25,000 that had been upgraded and ‘legalised’ at the end of the 1980s. The major share, however, would have come from backyard shacks in formal townships. For instance, in Mbare, which had a population of about 101,000 in its four wards in 1992,50possibly the majority of its resident population lived in backyard shacks and lost their homes. There were reports of similar wholesale bulldozing, or forced deconstruction by occupants,51
Table 2. Urban poverty in Zimbabwe, 2003 by type of urban residential area (% of households)
Area Expenditure Group % of sample
Very Poor Poor Middle Higher
Low Density 27 18 21 33 14.9
Medium Density 28 23 20 30 7.1
High Density 57 20 13 10 68.4
Peri-urban 67 20 9 4 6.0
Squatter 85 5 8 3 0.8
Total Urban 51 20 14 14 100.0
Notes: excludes mine compounds and other mining areas. Numbers may not add to 100% due to rounding.
Source: Zimbabwe National Vulnerability Assessment,Zimbabwe: Urban Areas, p. 26, Table 3.2.
47 Tibaijuka,Report of the Fact-Finding Mission to Zimbabwe, p. 25.
48 See D. Potts, ‘Housing Policies in Southern Africa’, in P. Gervais-Lambony, S. Jaglin and A. Mabin (eds),La question urbaine en Afrique australe: Perspectives de recherches(Paris, Karthala, 1998), pp. 185– 213. 49 This estimate is based on a combination of government and UN figures.
50 Data from the 2002 census have not been published. Some data were available online for a while, and others have been made available to me by personal contacts. However, disaggregated data for urban wards have not yet been seen.
of backyard ‘shacks’ in other Harare townships, Bulawayo and other towns. The destruction of this housing type appears to have been national and wholesale, although it received far less attention from the media at the time. As the UN envoy reported, it was a ‘dominant’ source of housing.52However, the distribution of such housing was uneven across the urban hierarchy and within individual towns. For example, it was much rarer in Bulawayo or Kadoma than Harare, and in Kuwadzana within Harare than in the older townships.53Overall, combining backyard shacks with backyard cottages, the 2003 survey found that 12 per cent of urban households lived in such housing. However, many in the ‘brick cottages’ (see Table 2) would not have been affected by Operation Murambatsvina, as they included legal servants’ quarters in LDAs, for example. Some other LDA backyard accommodation was demolished, but this appears to have been relatively exceptional. On the other hand, some of the HDA backyard houses were also solidly built and would have been defined as ‘brick cottages’, and so these would have been demolished.
Combining the information from the UN and government estimates and from the vulnerability assessment allows some rough estimates to be made of the numbers displaced from different housing types. Assuming that everyone classified as peri-urban or squatter in Table 2 (about 7 per cent of urban households) lost their houses, we have a total of about 260,000 people. The total in the dwellings classified as backyardshacksin Table 3 would be only 155,000, but the demolitions will have also removed some of the dwellings classified as backyard brick cottages. On the assumption that half of these were demolished, the total of those affected by backyard demolitions would rise to
Table 3. Tenure and housing types in urban Zimbabwe, 2003 by income group (% of households)
Expenditure Group % of total sample
Tenure1 Very Poor Poor Middle Higher
Owner 37 36 35 44 38
Tenant 7 8 10 15 9
Lodger 35 36 33 24 33
Family accommodation 6 6 5 4 6
Tied/employment 13 13 17 14 14
Other 2 1 1 0 1
Type of dwelling unit Very Poor Poor Middle Higher
Detached 48 56 64 66 54
Flat/townhouse 7 6 7 9 7
Semi-detached 26 23 18 14 22
Backyard brick cottage 8 9 6 6 8
Backyard shack 6 3 3 2 4
Other2 5 3 2 1 3
Notes:1. Lodgers rent backyard shacks or one room or more in the main house from owners, who may or may not live on plot; tenants rent from municipalities or other institutions. Family accommodation means people living in houses owned by other family members.
2. ‘Other’ dwelling units includes traditional housing, e.g. huts made of mud bricks with thatch; mixed housing (combining ‘modern’ materials with traditional) and other types. Columns may not add to 100% due to rounding.
Source: derived from data in Zimbabwe National Vulnerability Assessment Committee,Zimbabwe: Urban Areas, p. 26, Table 3.6.2 and Fig. 3.1.4.
52 The UN report stated that in Mutare, backyard shacks accounted for 34,000 dwellings compared to 27,000 legal ones, and in Victoria Falls for 64 per cent of housing stock. However, without knowing the source of these estimates and, given a natural tendency to overestimate the impact of Operation Murambatsvina by some informants, these figures must be treated with caution. The Mutare figures, for example, suggest a total urban population far in excess of the enumerated population in 2002.
about 310,000. Together with the peri-urban and squatter totals, these approximate the numbers presumed affected. In summary, this suggests that something over half of those displaced from their houses came from backyard accommodation, mainly from within the HDAs, most of the rest from peri-urban settlements and a minority from ‘squatter’ settlements like Hatcliffe Extension and Porta Farm.
The ZNVAC survey also disaggregated the sampled urban households by income level and tenure as shown in the tables. A further remarkable feature of Zimbabwe’s urban housing was thereby made apparent: the extraordinary similarity in tenure patterns across income groups (see Table 3). The proportion of owners was only 7 per cent higher among the rich compared to the very poorest groups, while the difference between the proportion renting was a mere 3 per cent, although the very poor were more likely to be lodgers than tenants.54The high proportion of home ownership among poorer groups, including the very poor (at 37 per cent), was a legacy of the mass transfer of former rental township housing to ownership by the renters at, and since, independence, combined with subsequent low-income housing policies focusing mainly on home ownership. Even though the latter policies caused major affordability problems for the poor (especially since increasing privatisation of housing finance and the ending of maximum income limits in low-income housing projects from the beginning of the 1990s), some poor households have managed to enter this sector.55Also many of those who were ‘non-poor’ when they obtained their housing plots would have subsequently declined into poverty by the time of the survey, given the general national economic circumstances. Many of the poor, legal plot-holders/homeowners would undoubtedly have been relying on the rental income coming from backyard shacks. This would have been of huge importance to one particular sub-sector of the urban poor: the elderly who had retired and/or were no longer able to work. Female-headed households with childcare responsibilities also may rely on such income if they are lucky enough to own a houseplot, and/or may operate various informal activities from their plots.56The impact of Operation Murambatsvina on such households was disastrous. One example was provided in June 2005 by a representative of the Catholic Church in Mbare:
I visited an old couple. He is sickly and frail. They used to pay their electricity bill, water, rates etc. from the income they got from renting out a couple of rooms to lodgers. These rooms are no longer there. They have been flattened. There is only the rubble left....
57
Even those with pensions have no security under the extreme hyperinflation characteristic of Zimbabwe in the 21st century. Some public sector pensioners’ incomes had shrunk to as little as US$2 per month in real terms in 2005, for example58 – the necessity of rental income in such circumstances is self-evident. Many newspaper and other reports about Mbare indicated that occupants of the main house were faced with massively reduced incomes due to loss of rental income,59and this was confirmed by the UN report.60
54 Tenants usually rent the whole house with a formal agreement; lodgers rent one or more rooms in the house or in the backyard.
55 Potts and Mutambirwa, ‘High-Density Housing in Harare’; Rakodi,Harare: Inheriting a Settler Colonial City; N. Mutizwa-Mangiza, ‘Post-Independence Urban Low-Income Shelter Policies in Zimbabwe: A Preliminary Appraisal of Affordability’ (paper presented at the Third World Planning Seminar on Shelter, Services and the Urban Poor, University of Wales Institute of Science and Technology, Cardiff, 1985).
56 See, for example, A. Schlyter, ‘Esther’s House: One Woman’s “Home Economics” in Chitungwiza, Zimbabwe’, in D. Bryceson and D. Potts (eds), African Urban Economies: Viability, Vitality or Vitiation(Houndmills, Palgrave, 2006), pp. 254– 77.
57 Mbare Report, No. 12, 27 June 2005, ‘Discarded People’. 58 Tibaijuka,Report of the Fact-Finding Mission to Zimbabwe.
59 For example, ‘Observations at Mbare Township’, inReport to South African Council of Churches; ‘Zimbabwe Demolitions Well Planned – Mugabe’, 30 June 2005, iafrica.com. [http://iafrica.com/news/specialreport/ zimbabwe/456439.htm]
The ZNVAC survey also covered poverty levels on the basis of estimated expenditure per capita. This provided a detailed picture of the extent of urban poverty, disaggregated by tenure, type of dwelling unit, and residential area (Tables 2 and 3). Expenditure below the cost of the basic food basket at the time as reported by the Consumer Council of Zimbabwe, at about Z$33,000 in September 2003, deemed the household as very poor; expenditure below the Total Consumption Line – the food basket plus necessary expenditure on things like rent, schooling and clothes – deemed the household as poor. As cited in the introduction to this article, by 2003, 51 per cent of the urban population were very poor and a further 21 per cent poor. The PASS survey, a major nationwide poverty study conducted in 1995, put the proportion of the urban population then living below the poverty line at about 40 per cent.61 While significantly higher than the 25 – 30 per cent calculated for Harare HDA households in 1991, due to the impact of structural adjustment, by 2003 the situation was very much more serious still. In the main cities of Harare and Bulawayo, the proportional increase over the period 1995 to 2003 was even greater, from approximately 35 per cent to just over 70 per cent in Harare and from just under 40 per cent to 75 per cent in Bulawayo.
The distribution of urban poverty by residential area is shown in Table 2. Only in the LDAs was less than half the population found to be poor; even here, due mainly to on-site residence of domestic workers and gardeners who were also covered by the survey, 45 per cent of households were poor. By far the largest numbers of poor people were in the HDAs, where about four in every five households were poor or very poor by 2003. While the situation was even worse in the ‘squatter’ areas, the difference was not that great: 90 per cent compared to 78 per cent. Thus, by 2003 poverty, and very often extreme poverty, was the norm in urban Zimbabwe. It is highly significant that this survey also found food insecurity in the urban areas to be as bad as it was in rural areas, with 66 per cent of the urban population estimated to be food insecure (discounting food aid at the time, which reduced the proportion to 64 per cent) compared with 64 per cent in the rural areas.62
The Outcomes of Urban Poverty and Operation Murambatsvina
The Rise and Rise of the Informal Job Sector
The very clear indices of the depth and breadth of urban poverty in Zimbabwe by the 21st century, analysed above, are highly significant in relation to Operation Murambatsvina for they are both cause and effect of the informalisation of the urban economy and environment which the campaign targeted. As the urban economy began to decline under ESAP63in the early 1990s, accelerated downwards after the budget crisis of 1997 and then declined even more steeply after 2000, formal job opportunities in town became exceedingly scarce.64While there had never been
61 Government of Zimbabwe,1995 Poverty Assessment Study Survey (PASS)(Harare, Ministry of Public Service, Labour and Social Welfare, 1996).
62 ZNVAC,Zimbabwe: Urban Areas.
63 Economic Structural Adjustment Programme, Zimbabwe’s Structural Adjustment Programme. The acronym came also to mean to local people, ‘Ever Suffering African People’,’ Extreme Suffering for African People’ or ‘Even Sadza A Problem’.
64 It is not possible to detail here the causes and nature of this economic freefall, but see P. Bond and M. Manyanya.
Zimbabwe’s Plunge: Exhausted Nationalism, Neoliberalism and the Search for Social Justice(Scottsville, South Africa, University of Natal Press; London, Merlin; Harare, Weaver Press; 2002), P. Carmody,Tearing the Social Fabric: Neoliberalism, Deindustrialization, and the Crisis of Governance in Zimbabwe (Portsmouth, NH, Heinemann, 2001); R. Davies, ‘Memories of Underdevelopment: A Personal Interpretation of Zimbabwe’s Economic Decline’, in B. Raftopoulos and T. Savage (eds),Zimbabwe: Injustice and Political Reconciliation
enough formal jobs, even during the relatively buoyant 1980s,65the situation by the early 2000s would have been unimaginable in those times. Furthermore, even when such jobs could be found, their pay was usually so out of kilter with even the most basic costs of urban living, as inflation swiftly ate away even massive, but far too occasional, pay hikes, that they could no longer be relied upon for survival.66Thus, increasingly, urban Zimbabweans were forced into the informal sector, as self-employed entrepreneurs operating at different scales and skill levels, or as, usually poorly paid, employees of such entrepreneurs. Trading predominated, in food stuffs, in second-hand clothes, in hardware, in almost anything that could be bought and sold on the street or in market places. Offering services, from transport to hairdressing, was another informal sector possibility. None of this was new, but the depth of dependence on this sector for the costs of daily living, and its dominance as a way of life, was new in Zimbabwe (although it had long been the norm in many other African cities). This dependence was not optional, but utterly essential. From it sprang numerous ‘illegal’, unplanned trading sites and increasing levels of street trading in the central business districts of the towns. These essential economic activities, driven by urban poverty, were then made the target of Operation Murambatsvina so that, ostensibly, ‘order’ could be restored. Yet, since the structural conditions determine that the urban poor, the majority, must make a livinginformally, ‘order’ of this sort – tidy, modern, formal-sector-dominated – can never be achieved in the cities of very poor countries. The link between Operation Murambatsvina and the outcomes of urban poverty are clear, but also indicate the Operation’s ultimate pointlessness since the majority of the urban poor, who must still survive mainly on informal sector activities, remain in town because most live(d) in the formal houses of the HDAs as owners and lodgers, and in other areas like the servants’ quarters in LDAs and MDAs. The drive against informal housing will, fortunately, not have dislodged them.
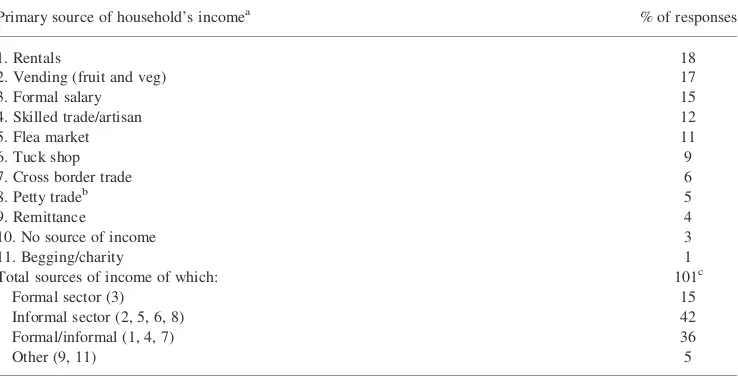
The dominance of the informal sector in people’s livelihoods in Harare by the early years of this century was demonstrated all too clearly by the Action Aid/CHRA survey of the impact of Operation Murambatsvina, which asked about sources of income prior to the campaign. Their results, with some adaptations, are shown in Table 4 and speak for themselves. Formal salaries were the main source of income in only 15 per cent of households. The informal sector was clearly dominant. Note too the importance of rentals, asthe most significant single sourceof urban household income. Not all of this would have been destroyed by Operation Murambatsvina since rentals from rooms inside the main house will have continued. House-owners immediately hiked the rents for such rooms after the demolitions, to reflect their massively increased scarcity value in the house rental market and also, presumably, to try to make up for the drastic loss of backyard shack rents where these had also pertained.
This survey also assessed urban people’s perceptions of the main shocks that had affected their livelihoods in the period of time shortly before 2003. Yet again the results were very telling of the nature of poverty in Zimbabwe’s towns, and of people’s changing expectations. By far the most important issues for the poor and very poor were related to the cost of living. Endlessly rising prices were most commonly mentioned, by over 90 per cent. The next was the cost of services (utilities) with nearly 50 per cent mentioning this, followed by school fees. Interestingly, these cost factors easily outranked unemployment. For the very poor, unemployment was mentioned by 42 per cent, and for the poor only by 32 per cent. Yet, in 1995, during the PASS survey, this had been the most significant single problem perceived by urban people. While the 2003 survey did not analyse these changes, it is possible to offer an explanation relating to shifts
65 It is recognised that insufficient formal jobs were created in the 1980s to absorb all work seekers, and that this was an economic problem. Nonetheless, the degree of dependence on, and employment in, the formal sector was extremely high for an African country at that time.
in both the nature and remuneration of employment relative to living costs over the time period in question. In 1995, after four years of structural adjustment, growth of the informal sector and declines in urban formal employment rates had both been significant. Those on formal incomes were finding it difficult to make ends meet.67Nevertheless, it is probable that in 1995 urban residents could still remember when formal employment was the route to relative urban livelihood security, and were possibly still hopeful that the economic situation might improve. By 2003 the national economic crisis was clearly of a different scale and depth and the urban poor may well have come to recognise that, even if they could get a formal job, this would not necessarily yield sufficient income to support an urban household. Moreover, people would have become increasingly used to working in the informal sector and perhaps less likely to perceive this as ‘unemployment’. In other words, by 2003, people had come to perceive that they would be poor even if they had a ‘proper’ job. Hence costs rather than a formal job had soared in the problem ranking. This analysis is indirectly supported by a survey in Harare in 2001, conducted by Chris Mutambirwa and myself, which found that recent migrants had become far more negative since 1994 about their ranking of Harare in terms of potential earnings compared to their previous place of residence (including the rural communal areas). In 1994, 81 per cent had thought that one was likely to earn more in Harare but by 2001 this had dropped to 55 per cent. The point about perceptions of unemployment is important, for there is endless reiteration in virtually every report on Zimbabwe of 70 – 80 per cent unemployment levels. This assumes that only formal urban and rural jobs are ‘employment’. This has always been a
Table 4. Sources of household income in Harare HDAs before Operation Murambatsvina
Primary source of household’s incomea % of responses
1. Rentals 18
2. Vending (fruit and veg) 17
3. Formal salary 15
4. Skilled trade/artisan 12
5. Flea market 11
6. Tuck shop 9
7. Cross border trade 6
8. Petty tradeb 5
9. Remittance 4
10. No source of income 3
11. Begging/charity 1
Total sources of income of which: 101c
Formal sector (3) 15
Informal sector (2, 5, 6, 8) 42
Formal/informal (1, 4, 7) 36
Other (9, 11) 5
Source:compiled and adapted from data in Action Aid/CHRA 2005 (see footnote 16)
Notes:The disaggregation of income sources into formal, informal and formal/informal in this table differs from the Action Aid/CHRA report’s, and is based on my own interpretation of the income sources, according to my fieldwork experience in Harare HDAs. Assigning all rentals to the informal sector, as done by the report, when some derive from rooms within the formal, legal, house, for example, is problematic. Similarly cross-border trade and skilled trades cannot be simply assigned in entirety to either sector.
a. Respondents were asked for themajorsource of their household’s income only – multiple livelihood strategies within the household were therefore not covered.
b. For example, sale of firewood, freezits (ice lollies), sweets etc. c. Does not add to 100% due to rounding
fundamentally flawed approach to the nature of work and income-earning in any poor country. It has become profoundly absurd in contemporary Zimbabwe. It has always discounted the work of rural smallholders, the largest single, and very hard-working, sector of workers in the country. Now it also discounts the majority of urban workers too! The citing of these figures serves to score political points against the Zimbabwean government, but also serves to obscure, completely, what is really occurring in employment and the livelihoods of the majority of the nation. I have analysed this issue in depth elsewhere;68suffice it to say that, in reality, the economic crisis has driven ever more people into income-generating work, and increased labour force participation rates. Unemployment, in any real sense, is a luxury few adults can afford, and scarcely any with dependants.69
The Housing Squeeze
The causes of the housing crisis which manifested itself in the backyard shacks and, to a lesser extent, in free-standing informal housing, are more complex than economic downturns and a shrinking formal sector job market alone, although these played their part. The refusal of the government to address its overly high building standards in a radical fashion has been important.70Its very slow delivery of serviced, legal land for site-and-service plots has also been significant,71although this would have been costly. When these were combined with soaring levels of urban poverty and a determined policy of preventing true squatter settlements which, in other poor countries, so often fill the gap between unaffordable, legal housing solutions and what the urban poor can actually manage, it was inevitable that backyard shacks and peri-urban housing of a semi-legal tenurial status, but less clear legality in terms of building and servicing standards, would flourish. More and more people were squeezed into the HDAs, and within them into backyard shacks because, as they were living in planned HDAs on land assigned for low-income residential housing, their illegality was relatively less than true squatting or, rather, was more ‘tolerated’. For, despite frequent threats and flurries of localised activity against backyard shacks, prior to Operation Murambatsvina this housing type was not faced with a policy response of rapid clearance in the way that freestanding informal housing was. The total eradication in 2005 of housing types which contravened urban by-laws, no matter what their tenure status, is likely to be more long-lasting in its impacts than the campaign against informal jobs and work, as people will certainly now fear to invest in such housing.
Conclusions
This article has attempted to trace the links between structural shifts in the nature of urban people’s livelihoods, incomes and employment in Zimbabwe, the outcomes of those shifts in terms of income-generating activities and housing types, and the targeting and impacts of Operation Murambatsvina in 2005. Certain aspects of the operation and the urban situation in Zimbabwe can be summarised as follows. First, poverty has become extremely widespread and
68 See Potts, ‘Urban Unemployment and Migrants in Africa’.
69 My surveys in the HDAs in 1994 and 2001 found well under 10 per cent of interviewed household heads were unemployed.