Published by Canadian Center of Science and Education
Farmer Preferences for Coffee Certification: A Conjoint Analysis of the
Indonesian Smallholders
Muhammad Ibnu1, Pieter Glasbergen1, Astrid Offermans1 & Bustanul Arifin2 1
International Centre for Integrated Assessment and Sustainable Development (ICIS), Maastricht University, Netherlands
² The Agribusiness Department of Agricultural Faculty, Lampung University, Indonesia
Correspondence: Pieter Glasbergen, International Centre for Integrated Assessment and Sustainable Development (ICIS), Maastricht University, Netherlands. Tel: 31-345-515-081. E-mail: [email protected]
Received: February 3, 2015 Accepted: April 6, 2015 Online Published: May 15, 2015
doi:10.5539/jas.v7n6p20 URL: http://dx.doi.org/10.5539/jas.v7n6p20
Abstract
Most coffee certification schemes are developed by Northern-based businesses and NGOs to regulate the production of coffee in the South. It is questionable whether these Northern-driven standards correspond to the preferences of coffee farmers in the South. Understanding farmer preferences and taking them into account when developing or improving certification schemes is believed to lead to more internalized, and therefore more effective standards. However, there is a lack of information on farmer’s preferences, both in the academic literature as well as with the certification programs themselves. Based on conjoint analysis and interviews, this paper investigates the preferences of coffee smallholder farmers in Indonesia. The smallholders surveyed include farmers registered with global certification schemes (i.e. Rainforest Alliance, Utz certified, and 4C), a local certification scheme (Inofice) and uncertified farmers. Results indicate that farmers in the different groups do not differ much in terms of their preferences. Moreover, although farmers value environmental conservation, their preferences regarding certification are mainly economically driven. This leads us to conclude that sustainability certification of coffee is only weakly institutionalized in the farmer’s context.
Keywords: sustainability certification, coffee certification, smallholder preferences, Southern perspective, conjoint analysis, Indonesia
1. Introduction
Sustainability certification has been introduced as new governance model since the mid-1990s and regulates food production in Southern countries (Glasbergen, 2013). Global certification programmes address sustainability issues through using social, economic, and environmental indicators as the basis of their standards. Combined with certification rules and codes of conduct, these global sustainability standards function as ‘non-state regulations’ that govern food supply chains (Arifin, 2010; Auld, 2010). Regarding coffee certification there are numerous global certification schemes, including Rainforest alliance, UTZ certified, 4C, Organic, Fairtrade, and Smithsonian Bird Friendly. Next to these global, voluntary and private certification initiatives we can also distinguish local certification schemes (e.g. Inofice certification in Indonesia) and public certifications schemes (e.g. ISCoffee, which was initiated by the Indonesian Ministry of Agriculture in 2013). All these standards have in common that they attempt to cover the entire value chain from farmer to consumer (Giovannucci & Ponte, 2005) and that their impacts on farmer’s livelihoods are heavily debated.
Latin America (e.g. Arnould, Plastina, & Ball, 2009; Bacon et al., 2008; Bechetti & Costantino, 2008; Bitzer, Glasbergen, & Arts, 2013; Méndez et al., 2010; Philpott et al., 2007; Ruben & Zuniga, 2011; Ruben & Fort, 2012; Valkila, 2009). Papers about the impact of certification on Indonesian farmers are extremely rare although Indonesia is the third largest coffee exporter in the world (ICO, 2014), and even the second world’s largest exporter of Robusta coffee (Wahyudi & Jati, 2012).
Notwithstanding this reputation as Robusta exporter, only 25% of the certified Indonesian coffee covers Robusta coffee. The majority (75%) of certified coffee is Arabica. Organic, as a global certification scheme, was among the first schemes in the Indonesian (Arabica) coffee sector; it has been implemented in Aceh in the 1990s (Arifin, 2008) and still covers the majority of certified, exported coffee from Indonesia (Wahyudi & Jati, 2012). Currently, many more global certification schemes certify coffee in Indonesia. Besides the global certification schemes, we can distinguish local schemes that are either initiated by the Indonesian government (ISCoffee) or initiated by other actors like farming agencies (Inofice). The Indonesian Standard Coffee certificate (ISCoffee) was initiated by the Indonesian Ministry of Agriculture and implemented by the government (Media Perkebunan, 2013, March 12). In the future, the government may require that Indonesian coffee producers are certified according to the national standard. According to Mawardi (2014), Neilson (2014), and Sughandi (2014) the formulation of ISCoffee was not only triggered by the existence of global certification schemes, but also by the increase in domestic coffee consumption and emerging export markets, particularly the markets in Africa and Asia. In 2013, 56% of the total Indonesian coffee export was targeted at these newly emerging markets and the Indonesian government wants to attach a “national identity” to the new coffee markets in the form of local (or national) certification (Sughandi, 2014). Other local certification schemes that were not initiated by the Indonesian government have been established in Indonesia as well. For example, the Inofice standard, managed by the Indonesian Organic Farming Infection and Certification Agency encompasses an organic certification scheme which refers to the National Standard of Indonesia or Standar Nasional Indonesia (SNI). It certifies plants and plant products (e.g. food, horticulture, crop and plantation), and livestock and livestock products (e.g. milk, egg, meat and honey) (Inofice, 2007).
The global coffee certification schemes that are present in Indonesia are developed by, and based on, the preferences of Northern consumers and implemented through multinational roasting companies and/or exporting firms (Neilson, 2008, 2014). According to Wahyudi and Jati (2012), the Indonesian farmers’ participation in the global certifications is mainly the result of the buyers’ requirements rather than the farmers’ interest. Reliable data on the smallholder farmers’ preferences for coffee certification programmes in Indonesia are currently not available. Several studies suggest that understanding farmer’s preferences is vitally important to target a certification programme effectively (Birol, Villalba, & Smale, 2009), to design more acceptable programmes (Bekele, 2006), to choose the right strategies for improving farmers’ productivity and income (Baidu-Forson, Waliyar, & Ntare, 1997), and to improve the pertinence of the programmes (Raghavarao, Wiley, & Chitturi, 2011). Certification schemes, however, pay little to no attention to the role of farmer preferences in the formulation and adoption stage of standards. Perhaps as a consequence, most of these programmes reach their intended goals only partially (see Adesina & Baidu-Forson, 1995; Bekele, 2006).
This paper is based on the premise that standard setting organizations, in order to be (more) acceptable to farmers, should consider farmer preferences. If certification schemes do not correspond to farmer’s preferences, they may not be dedicated to comply with the certification principles, and some may even not be willing to participate. The objective of this paper is to contribute to our knowledge about smallholder preferences regarding coffee certification in Indonesia. The main research question is: What are Indonesian smallholders’ preferences regarding coffee certification schemes, and what characteristics does the most preferred scheme - according to their opinion - contain? Field work was conducted in the province of Lampung, one of the major Robusta coffee producing regions in Indonesia (Wahyudi & Jati, 2012; Arifin, 2010).
2. Methods
The literature distinguishes several methods to operationalize and measure preferences. With the hedonic regression method the items being researched are decomposed into their essential characteristics to obtain estimates on the influence of each characteristic (Reis & Santos-Silva, 2006). Q-sort methodology focuses on understanding subjective phenomena and respondents arrange or sort a set of previously determined statements (Bracken & Fischel, 2006). The contingent-valuation or willingness-to-pay procedure, in its simplest form, determines the respondents’ willingness to pay for hypothetical actions with specified characteristics (Carson & Flores, 2000; Bridges et al, 2007). For our study it is important that farmer’s preferences can be related to (potential) characteristics of a (most preferred) certification scheme and that we can compare any differences in preferences between locally, globally and non-certified farmers. To that end, we decided to use conjoint analysis to evaluate farmer preferences regarding the most preferred certification scheme.
2.1 Conjoint Analysis
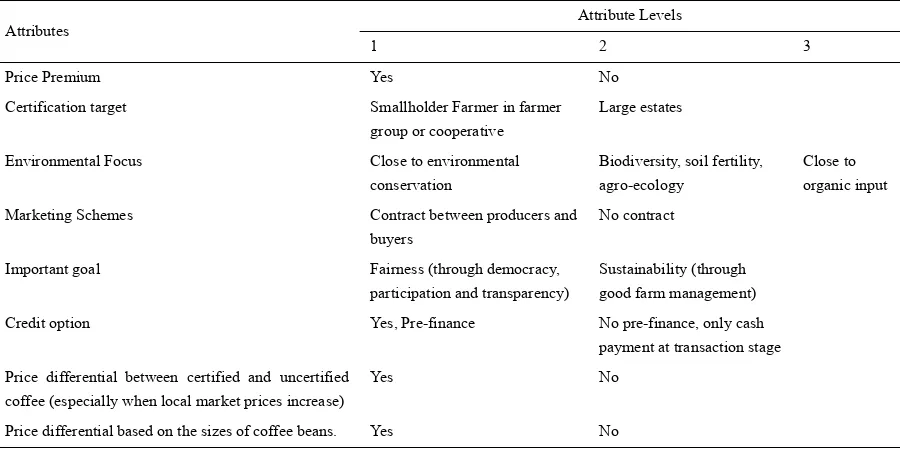
Conjoint analysis is a powerful and robust method for understanding farmer preferences (Arifin, Swallow, Suyanto, & Coe, 2009; Tano, Kamuanga, Faminow, & Swallow, 2003; Orme, 2010). It is a multivariate technique that is useful to examine trade-offs made by individual respondents when they are facing a range of options (Green, Wind, & Rao, 1999). Conjoint analysis encompasses several iterative steps of (re)defining and verifying so called attributes, interpretations (or attribute levels) and profiles. An attribute is a characteristic inherent to the variable that will be measured; in our case coffee certification schemes (see column 1 in Table 1). Attributes can be interpreted in different ways, depending on the farmer’s preferences. These different interpretations are the attribute levels (see column 2-4 in Table 1). As recommended by Green et al. (1999) and Walley, Parsons, and Bland (1999) attributes and interpretations were selected by reading the codes of conduct containing core principles and guidelines of several coffee certification schemes (Fairtrade, Utz certified, Rainforest Alliance and 4C). Differences between existing schemes are expressed by differences between attribute levels (see Table 1). In addition, if existing schemes do not vary (enough) for specific attributes, the researcher has the freedom to add attribute levels (for example fairness as focus criteria). The different attribute levels can be combined in different ways into a certification scheme. These different combinations are profiles (see Appendix A). The attribute levels in Table 1 result in 27 × 31 = 384 possible profile combinations.
These profiles describe certification alternatives (or scenarios) (Green et al., 1999). According to Bakken and Frazier (2006), researchers recommend that the maximum number of profiles is 15 to 20 per respondent. If respondents must evaluate too many profiles, they tend to simplify their assessment process which distorts their true preferences (Green et al., 1999). In addition to the high cost of administering the survey, farmers’ misperception and exhaustion can also be overwhelming, and the probabilities of farmers disregarding some attributes are high (Arifin et al., 2009). To this end, we had to reduce the possible profiles from 384 to a maximum of 20. SPSS contains a powerful procedure to select possible profiles randomly: the Generate Orthogonal Design Procedure, which offered 16 full profiles (see Appendix A). The profiles were written in Bahasa Indonesia, and pre-tested at the study sites. The pre-tests revealed that the smallholders have more difficulty in ordering choices (ranking) than rating. Rating (i.e. indicating the desirability of each profile separately) and ranking (i.e. ranking the different profiles from most- to least desirable) provide similar results in terms of preferences (Boyle, Holmes, Teisl, & Roe, 2001; Haefele & Loomis, 1999). However, based on confidence interval tests, rating provides more information and is relatively more efficient than ranking (Mackenzie, 1993). Rating of each profile is therefore used in the surveys with a scale of 1 to 5, in which 1 represents the least desirability and 5 the highest desirability. Rating based on full-profile conjoint analysis (i.e. full-profile plans by using orthogonal design) has the advantage that it utilizes fractional factorial designs that allows researchers to conduct statistical tests without evaluating all possible combinations of the attributes and the attributes levels (IBM Corp., 2010; Bakken & Frazier, 2006; Green et al., 1999). The results of our conjoint analysis are utility (part-worth) scores and percentages that indicate the relative importance of each attribute level (see Table 4). Similar to regression coefficients, the part-worth scores provide a quantitative degree of preferences for each attribute level, and the larger values correspond to the greater preferences. The relative importance of an attribute indicates how important the attribute is to the overall preference (IBM Corp., 2010). If all attributes would be considered equally important, they would all have a score of 100/8 attributes = 12.5%.
interview and organizing focus group discussions with the farmers. These cycles ultimately resulted in the reduction of attributes from 16 to 8, and a reduction in attribute levels from 4 to 3. The initial list with attributes and attribute levels can be found in Appendix B. Reasons to reduce attribute levels include that the farmers perceived “biodiversity, soil fertility, agro-ecology” equal to “soil fertility, erosion resilience”. Therefore, only “biodiversity, soil fertility, agro-ecology” is used as one of the attribute levels. Similarly, the farmers considered that the price premium levels “no, but market price” and “no, but negotiated between seller and buyer” are just the same. To the smallholders, both levels have the same meaning: “no price premium.” Therefore, we only differentiate between the presence and absence of a price premium in our final list of attributes (see Table 1). The list does not cover social criteria (e.g. labor issues) because the farmers argued in the pre-tests that criteria related to forced labor, child labor and discrimination are irrelevant to their farming practices as they only own small plantations (1-2 hectares), which they can easily harvest and maintain on their own. Besides, they hardly hire labor, which makes minimum wages also irrelevant to the farmers. The pre-test thus already indicated that the most preferred certification scheme − in the eyes of the smallholder farmers − does not prioritize social issues.
Table 1. The final list of attributes and attribute levels of certification programmes
Attributes
Attribute Levels
1 2 3
Price Premium Yes No
Certification target Smallholder Farmer in farmer group or cooperative
Large estates
Environmental Focus Close to environmental conservation
Biodiversity, soil fertility, agro-ecology
Close to organic input Marketing Schemes Contract between producers and
buyers
No contract
Important goal Fairness (through democracy, participation and transparency)
Sustainability (through good farm management) Credit option Yes, Pre-finance No pre-finance, only cash
payment at transaction stage Price differential between certified and uncertified
coffee (especially when local market prices increase)
Yes No
Price differential based on the sizes of coffee beans. Yes No
After the conjoint analysis, we interviewed 15 farmers. The goal of these interviews was twofold: first to verify the results from the conjoint analysis and second to gain more information about the argumentation behind the preferences. The latter offered relevant results on why farmers have specific preferences and why some preferences differed for the different farmer groups.
2.2 Respondent Selection and Characteristics
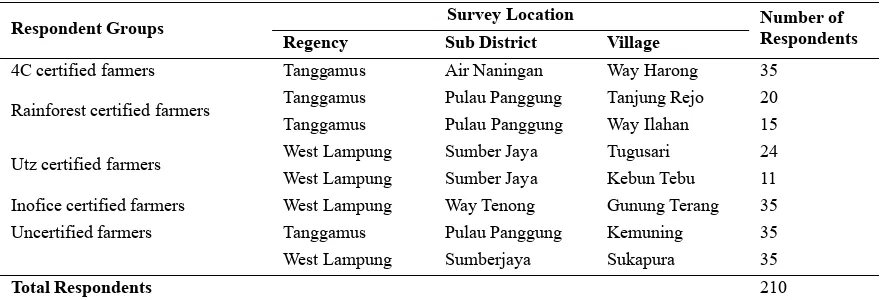
West Lampung. Inofice certification is only found in West Lampung with a limited number of farmer participants. On average, around 70 % of the farmers in the researched districts turned out to be uncertified. The details of the sample are shown in Table 2.
Table 2. Respondent types, location of interviews and the number of respondents
Respondent Groups Survey Location Number of Respondents Regency Sub District Village
4C certified farmers Tanggamus Air Naningan Way Harong 35
Rainforest certified farmers Tanggamus Pulau Panggung Tanjung Rejo 20 Tanggamus Pulau Panggung Way Ilahan 15
Utz certified farmers West Lampung Sumber Jaya Tugusari 24 West Lampung Sumber Jaya Kebun Tebu 11 Inofice certified farmers West Lampung Way Tenong Gunung Terang 35
Uncertified farmers Tanggamus Pulau Panggung Kemuning 35
West Lampung Sumberjaya Sukapura 35
Total Respondents 210
According to Arifin et al. (2009) and Setiawan, Cinner, Sutton, and Mukminin (2012), respondent characteristics
Table 3. The results of means comparison with One-way Anova
ANOVA
Sum of Squares df Mean Square F Sig.
Age Between Groups 1422.214 5 284.443 3.335 .006
Within Groups 17401.714 204 85.303
Total 18823.929 209
Education Between Groups 31.886 5 6.377 .493 .781
Within Groups 2636.229 204 12.923
Total 2668.114 209
Time length of becoming coffee farmers Between Groups 510.310 5 102.062 1.417 .220 Within Groups 14698.171 204 72.050
Total 15208.481 209
Land ownership Between Groups 29.613 5 5.923 1.813 .112
Within Groups 666.256 204 3.266
Total 695.868 209
Productivity Between Groups 8330687.490 5 1666137.498 22.278 .000
Within Groups 15257049.354 204 74789.458
Total 23587736.844 209
3. Farmer Preferences and the Ideal Certification Scheme
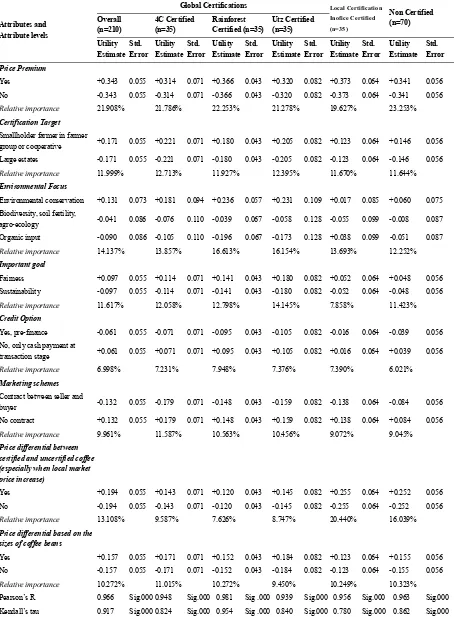
The results of the conjoint analysis are twofold. First, it indicates the strength of the preferences for each attribute, or in other words: it reveals which attributes are considered most important in coffee certification schemes (see the percentages for the relative importance in Table 4). Second, the analysis offers utility (part-worth) scores and standard errors for each attribute level. These part-worth scores provide a quantitative degree of preferences for each attribute level; the larger these values, the greater the preference for the specific attribute level (IBM Corp., 2010). These two results combined, indicate which attributes are considered important and how the most preferred interpretation of these attributes look according to the smallholder farmers. Table 4 indicates both results for the overall farmer’s preferences, and the preferences of farmers certified under 4C, Rainforest, Utz certified, and Inofice as well as the uncertified producers.
3.1 Important Certification Attributes
Table 4. Average part-worth (utility estimate) for key attributes of coffee certification programme and relative
group or cooperative +0.171 0.055 +0.221 0.071 +0.180 0.043 +0.205 0.082 +0.123 0.064 +0.146 0.056 Large estates -0.171 0.055 -0.221 0.071 -0.180 0.043 -0.205 0.082 -0.123 0.064 -0.146 0.056
Relative importance 11.999% 12.713% 11.927% 12.395% 11.670% 11.644%
Environmental Focus
Environmental conservation +0.131 0.073 +0.181 0.094 +0.236 0.057 +0.231 0.109 +0.017 0.085 +0.060 0.075 Biodiversity, soil fertility, Sustainability -0.097 0.055 -0.114 0.071 -0.141 0.043 -0.180 0.082 -0.052 0.064 -0.048 0.056
Relative importance 11.617% 12.058% 12.798% 14.145% 7.858% 11.423%
Credit Option
Yes, pre-finance -0.061 0.055 -0.071 0.071 -0.095 0.043 -0.105 0.082 -0.016 0.064 -0.039 0.056 No, only cash payment at
transaction stage +0.061 0.055 +0.071 0.071 +0.095 0.043 +0.105 0.082 +0.016 0.064 +0.039 0.056
3.2 Most Preferred Certification Scheme Based on Preferences for Attribute Levels
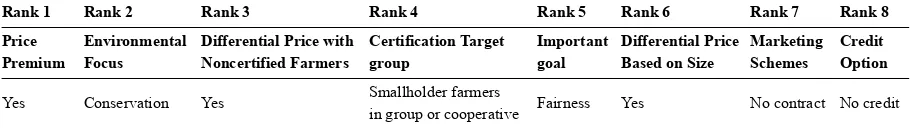
In general, the different farmer groups are rather comparable in terms of their preferences. The presence of a price premium is the most preferred attribute level with a utility score of +0.343. Next, smallholders prefer environmental conservation, a price differential against uncertified coffee, farmer groups or cooperatives as target, emphasis on fairness, price differentials based on coffee bean sizes, no contract and no pre-finance (see Table 5). The preferences for the attribute levels are very comparable across the respondent groups, except for the environmental-focus attribute. While all farmers prefer the attribute level of environmental conservation, the smallholders certified under Inofice prefer organic input. Further, where the global certified farmers prefer fairness over a price differential based on certified and uncertified coffee, this is opposite for uncertified and Inofice farmers.
Table 5. Attribute level summary of the most preferred certification scheme
Rank 1 Rank 2 Rank 3 Rank 4 Rank 5 Rank 6 Rank 7 Rank 8 Price
Premium
Environmental Focus
Differential Price with Noncertified Farmers
Certification Target group
Important goal
Differential Price Based on Size
Marketing Schemes
Credit Option
Yes Conservation Yes Smallholder farmers
in group or cooperative Fairness Yes No contract No credit
4. Assumptions Underlying Farmer’s Preferences
Following the statistical results of the conjoint analysis, we conducted interviews to further explain the preferences. Related to the importance of the presence of a price premium we found that the poor farmers have a high expectation of the tangible economic benefits of the certification programmes through a price premium. They perceive the price premium as a reward for following, or complying to, the activities and practices as required by the scheme. The interviews reveal that it was not only the price premium as such that was highly preferred, but also a more direct relation between the farmers and certificate holders, to ultimately gain a stronger bargaining power and guaranteeing a (higher) price premium for the certified coffee beans. Currently, the global certified respondents hold no certificates themselves. Roasting companies and exporting firms (Nestle, NedCoffee, and Indo Cafco) hold the certificates because they pay the certification costs. The farmers have an indirect relationship with these certificate holders as they collectively or individually deliver their harvests to KUBEs (Kelompok Usaha Bersama). KUBEs are joint business groups consisting of different producer groups that partner with a specific certificate holder and transport the coffee beans to the roasting companies or exporters after cleaning and drying the coffee beans. This procedure results in lower prices for the farmers as around 30% of the premium prices goes to the KUBEs. Every transaction with exporters or roasters has to be conducted through KUBEs, although they also have relatively little bargaining power against the big buyers. Within the Inofice scheme, certificates are held by joint farmer groups called “Gabungan Kelompok Tani Hulu Hilir” often shortened as Gapoktan Hulu Hilir to whom the Inofice farmers directly sell their coffee beans, without the intervention of a KUBE. The uncertified smallholders commonly sell their coffee beans to local traders and local roasters with lesser requirements.
Farmers highly value the environmental focus of a certification scheme, in particular the focus on conservation. This can partly be explained by their understanding of conservation, namely beyond the coverage of forests, soil and biodiversity protection, and partly by their feeling of being connected to nature. Regarding the former, farmers value the preservation of historical heritage such as the Inscription of Batu Bedil and the Megalithic Site of Batu Gajah, and consider this to be part of the attribute of environmental conservation. Regarding the latter, the interviews reveal that farmers feel strongly connected to nature. They realize that for their coffee farming practices, and therefore also their income, they depend on the state of the environment. Particularly the older farmers compare the current environmental state with the state of years ago and express their concerns about decreasing bird populations and the poor water quality. The farmers believe that planting coffee in protected forests must either be banned or controlled, for example, by the Decree of the Minister of Forestry (No. 31/Kpts-II/2001). This decree provides opportunities for farmers to manage and to use state-forest lands, with the proviso that they must conserve the area. However, our interviews also reveal that, although the environmental focus is deemed important, the farmers would not choose a different certification scheme only because the environmental criteria are more rigorous.
and uncertified coffee. Their underlying reasons are nevertheless different. On the one hand, the uncertified smallholders value their freedom to sell coffee to any buyer offering a high price or quick cash. Besides, if they manage to produce good quality coffee they can also sell to the KUBEs and cashing a higher price. According to them, coffee quality should be more important than the question whether the coffee is certified or not. On the other hand, the Inofice organic producers feel that they are participating in a certification programme which uses strict environmental criteria. The certification programme should therefore give a significant price differential for their “exclusive” coffee beans. The surveys reveal that the Inofice farmers obtain 3,000 rupiah (around €0.19) per kilogram more than the prevailing local market price for uncertified coffee. This desire for gaining a financial reward for more exclusive coffee could also be recognized among the global certified farmers (although they only receive a financial reward of 200-300 rupiah per kilogram of coffee).
Related to the certification target group, the respondents prefer the attribute level of smallholder farmers in a farmer group or cooperative rather than large estates. Our interviews reveal that farmers see the roles of their farmer groups as positive as they are believed to play vital roles in improving bargaining positions, solving problems, and managing and educating their members. The groups also organize the coffee growers to work together to build terraces, terrace drains, and ridges in each member’s plantation. In addition, individual members are able to contribute cash to the groups’ financial deposits, which can be used to jointly (and therefore more cheaply) buy fertilizers, tools, and seeds. These activities have produced strong social relations between the individual farmers and their groups. These relations are valued as being important by the farmers. According to the smallholders, they rarely encounter such emotional connections in relation to the large estate plantations, which usually employ many labour workers. The possibility to develop and maintain strong personal relationships explains the farmers’ preference for farmers groups over large estates. A desire to act independently was not expressed during the pre-tests or the interviews. Most coffee farmers are smallholders owning limited land and capital. Joining a producer group is a need for almost every farmer rather than an obligation. Independent coffee smallholders are therefore very rare, except for those farmers whose livelihoods do not mainly depend on coffee.
Next to personal relationships, fairness is an important issue for most respondents; especially for the global certified farmers. This can again be related to their indirect relationship with the certificate holders (roasters and exporters). Farmers lack understanding on how prices are formulated by the certificate holders and - more importantly - have the feeling that they may not receive the prices they have the right to. The lack of negotiation opportunities contributed to lower trust and a feeling of unfairness. Furthermore, the smallholders perceive a lack of transparency about the advantages and content of the certification programmes and the initiators behind these programmes, which generates doubts about the fairness of these programs as well. Lastly, as being one of the most important actors within the certification scheme the farmers consider it unfair that things are simply decided upon for them.
The preference to differentiate prices based on the coffee bean sizes results from the practice that coffee roasters almost always separate the coffee beans in accordance to their size, to produce high-quality coffee products. If the beans are mixed, the smaller beans are scorched before the larger beans, which influences the coffee quality. The National Standard of Indonesia, the authority being in charge of regulating coffee quality, requires coffee beans to be graded and priced according to their size (BSN, 2014). Most farmers hope that grading requirements based on the bean sizes can also be applied under (global) certification schemes. The poor farmers call the grading exercise “ekah”, which literally means “differentiating to increase income”.
The preference for not having any formal contract with buyers is rooted in a desire to be able to adapt to opportunities to sell coffee for higher prices elsewhere or to maintain social relationships. For this attribute level again, we see that emotional attitude and social relations are important explanatory aspects behind the farmer’s preferences. For example, while the coffee producers usually sell their coffee beans via their KUBEs to the exporting firms under a particular certification, they also continue to sell their coffee to local traders to maintain social relationships with these traders. In the neighbourhoods, the smallholders and the local traders usually have a close relationship, comparable to family-ties or friendship. Finally, farmers indicate that they are not familiar with formal agreements and compliance, which keeps them rather reserved to opt for such a contract.
5. Conclusion
Most global coffee certification schemes are developed by Northern-based businesses and NGOs and regulate production in the South. Production requirements can often be traced back to the demands of global buyers that do not necessarily coincide with the demands and preferences of smallholder producers in the South. Understanding farmer preferences makes it however easier to take these preferences into account when (re)developing a certification scheme. This is believed to contribute to standards that are more acceptable to farmers and encompass better applicable strategies for improving farmers’ productivity and income. Insight into motivations behind preferences contributes to knowledge about the current context and conditions smallholders have to cope with. This also implies that changes in context or structure may have implications for farmer’s preferences. Therefore, the results of this study should not be treated as steady and unchangeable.
This study examined the preferences for coffee certification from a Southern producer’s perspective by using the technique of conjoint analysis. The analysis reveals that our sample of Indonesian coffee farmers prefer a certification scheme that offers a price premium, focuses on environmental conservation, offers price differentials between certified and uncertified coffee, targets farmers in a group or cooperative, values fairness, offers a price differential based on the size of the coffee beans, and offers no formal contracts or credit options.
We learn that certification, which is meant to be a tool to promote sustainability and preferred by consumers in the North because of environmental and social conditions of production, becomes, when applied in the field and accepted by the farmers, an economic tool. This does not mean that the Indonesian coffee farmers do not value the environmental and social aspects of their production, but their preferences regarding the certification schemes are primarily economically driven. This observation is sustained by the fact that we hardly found differences in the preferences of globally certified farmers, locally certified farmers and uncertified farmers; they all prefer certification schemes that can promise tangible economic benefits. This implies that certification is only weakly institutionalized among farmers. Farmers display opportunistic behavior and may abandon one certification scheme to participate in another when the second one, or an alternative system, promises higher financial incentives. The current system that can be characterized by an overproduction of certified coffee (supplies outweigh demands), leads to a situation wherein certified coffee is sold in the conventional market. Premium prices can thus no longer be guaranteed, which may lead farmers to decide to leave the certification scheme. This trend may be further exacerbated by new emerging markets (including the domestic Indonesian market) that do not require coffee to be certified. From a liberal-market point of view this may not be problematic, but it shows again that the current certification systems are weakly institutionalized in farmer’s practices.
We also found that farmer’s knowledge about the certification schemes is low. Knowledge does generally only cover the recommended activities (like harvesting ripe cherries) and unacceptable practices that should be prevented within their own scheme (like the use of banned pesticides). This may explain why the description of attributes (also in the pre-tests) kept a rather general character. Farmers are simply not aware of differences between the certification schemes and can therefore not think of attribute levels that go beyond their own scheme.
This research offers new and interesting insights for science, practice and certification issuers, but only covered Robusta coffee farmers in two areas in Indonesia. Further research including Arabica farmers in different parts of the Archipelago will be necessary to further test the findings. In that research the conjoint analysis, although a robust method could be improved. Conjoint analysis limits the number of attributes and attributes levels that can be included in an analysis. Social attributes were purposely excluded from our attribute list as they were considered irrelevant by the farmers in the pre-tests. However, it may be interesting to further investigate farmer’s ideas and preferences for price premium alternatives. Repeating this study with the incorporation of different certification attributes related to tangible economic aspects, but also aspects related to farmer’s preferences regarding organizational capacity or skills (e.g. what is their need regarding skill development) may offer interesting, additional insights.
Acknowledgements
paper.
References
Adesina, A. A., & Baidu-Forson, J. (1995). Farmers’ perceptions and adoption of new agricultural technology: evidence from analysis in Burkina Faso and Guinea, West Africa. Agricultural economics, 13(1), 1-9. http://dx.doi.org/10.1016/0169-5150(95)01142-8
Arifin, B. (2008). Non-State Regulation of Agricultural Trade: The Case of Lampung Coffee. Paper presented at the Seminar of Indonesia Study Group (ISG) of Australian National University (ANU), Canberra, Australia. Retrieved May 21, 2013 from http://barifin.files.wordpress.com/2012/12/2008-arifin-non-state-regulation-o f-coffee-trade-in-indonesia.pdf
Arifin, B. (2010). Global Sustainability Regulation and Coffee Supply Chains in Lampung Province, Indonesia. Asian Journal of Agriculture and Development, Southeast Asian Regional Center for Graduate Study and Research in Agriculture, 7(2), 67-89, December. Retrieved February 1, 2014, from http://ideas.repec.org/a/sag/seajad/v7y2010i2p67-89.html
Arifin, B., Swallow, B. M., Suyanto, S., & Coe, R. D. (2009). A conjoint analysis of farmer preferences for community forestry contracts in the Sumber Jaya Watershed, Indonesia. Ecological Economics, 68(7), 2040-2050. http://dx.doi.org/10.1016/j.ecolecon.2008.12.007
Arnould, E., Plastina, A., & Ball, D. (2009). Does Fair Trade deliver on its core value proposition? Effects on income, educational attainment, and health in three countries. Journal of Public Policy and Marketing, 28(2), 186-201. http://dx.doi.org/10.1509/jppm.28.2.186
Auld, G. (2010). Assessing Certification as Governance: Effects and Broader Consequences for Coffee. The Journal of Environment and Development, 19(2), 215-241. http://dx.doi.org/10.1177/1070496510368506
Bacon, C. M., Ernesto-Méndez, V., Gómez, M. E. F., Stuart, D., & Flores, S. R. D. (2008). Are Sustainable Coffee Certifications Enough to Secure Farmer Livelihoods? The Millenium Development Goals and Nicaragua’s Fair Trade Cooperatives. Globalizations, 5(2), 259-274. http://dx.doi.org/10.1080/14747730802057688
Bakken, D., & Frazier, C. L. (2006). Conjoint Analysis: Understanding Consumer Decision Making. In R. Grover & M. Vriens (Eds.), The Handbook of Marketing Research: Uses, Misuses, and Future Advances (p. 720). California: Sage Publication.
Becchetti, L., & Costantino, M. (2008). The effects of fair trade on affiliated producers: An impact analysis on Kenyan farmers. World Development, 36(5), 823-842. http://dx.doi.org/10.1016/j.worlddev.2007.05.007
Bekele, W. (2006). Analysis of Farmers’ Preferences for Development Intervention Programs: A Case Study of Subsistence Farmers from East Ethiopian Highlands. African Development Review, 18(2), 183-204. http://dx.doi.org/10.1111/j.1467-8268.2006.00138.x
Beuchelt, T. D., & Zeller, M. (2011). Profits and poverty: Certification’s troubled link for Nicaragua’s organic and fairtrade coffee producers. Ecological Economics, 70(7), 1316-1324. http://dx.doi.org/10.1016/j.ecolecon.2011.01.005
Birol, E., Villalba, E. R., & Smale, M. (2009). Farmer preferences for milpa diversity and genetically modified maize in Mexico: a latent class approach. Environment and Development Economics, 14(04), 521-540. http://dx.doi.org/10.1017/S1355770X08004944
Bitzer, V., Francken, M., & Glasbergen, P. (2008). Intersectoral partnerships for a sustainable coffee chain: Really addressing sustainability or just picking (coffee) cherries? Global Environmental Change, 18(2), 271-284. http://dx.doi.org/10.1016/j.gloenvcha.2008.01.002
Bitzer, V., Glasbergen, P., & Arts, B. (2013). Exploring the potential of intersectoral partnerships to improve the position of farmers in global agrifood chains: findings from the coffee sector in Peru. Agriculture and Human Values, 30(1), 5-20. http://dx.doi.org/10.1007/s10460-012-9372-z
Boyle, K. J., Holmes, T. P., Teisl, M. F., & Roe, B. (2001). A comparison of conjoint analysis response formats. American Journal of Agricultural Economics, 83(2), 441-454. http//dx.doi.org/10.1111/0002-9092.00168
Bridges, J., Onukwugha, E., Johnson, F., & Hauber, A. (2007). Patient preference methods–A patient centered evaluation paradigm. ISPOR connections, 13(6), 4-7.
BSN (Badan Standardisasi Nasional Indonesia). (2014). Biji Kopi berdasarkan SNI 2907:2008. Indonesia. Retrieved April 28, 2014, from http://sisni.bsn.go.id/index.php?/sni_main/sni/detail_sni/7670
BSN (Badan Standardisasi Nasional Indonesia). (2012). Tentang BSN. Indonesia. Retrieved April 28, 2014, from http://www.bsn.go.id/main/bsn/isi_bsn/5
Carson, R. T., & Flores, N. A. (2000). Contingent Valuation: Controversies and Evidence. Department of Economics, UCSD. Retrieved from http://escholarship.org/uc/item/75k752s7
Chiputwa, B., Spielman, D. J., & Qaim, M. (2015). Food Standards, Certification, and Poverty among Coffee Farmers in Uganda. World Development, 66(0), 400-412. http://dx.doi.org/10.1016/j.worlddev.2014.09.006
De Lima, A. B., Novaes-Keppe, A. L., Maule, F. E., Sparovek, G., Corréa Alves, M., & Maule, R. F. (2009). Does certification make a difference? Impact assessment study on FSC/SAN certification in Brazil. Retrieved June 22, 2013, from http://www.imaflora.org/downloads/biblioteca/Does_certification_make_a_ difference.pdf
FAO (Food and Agriculture Organization of the United Nations). (2010). Methodologies for Assessing Socio-Economic Benefits of European Inland Recreational Fisheries. European Inland Fisheries Advisory Commission (EIFAC) Occasional Paper No. 46. Retrieved September 14, 2013, from http://www.fao.org/docrep/013/i1723e/i1723e00.htm
Getz, C., & Shreck, A. (2006). What organic and Fair Trade labels do not tell us: towards a place‐based understanding of certification. International Journal of Consumer Studies, 30(5), 490-501. http://dx.doi.org/10.1111/j.1470-6431.2006.00533.x
Giovannucci, D., & Ponte, S. (2005). Standards as a new form of social contract? Sustainability initiatives in the coffee industry. Food Policy, 30(3), 284-301. http://dx.doi.org/10.1016/j.foodpol.2005.05.007
Glasbergen, P. (2013). Legitimation of Certifying Partnerships in the Global Market Place. Environmental Policy and Governance, 23(6), 354-367. http://dx.doi.org/ 10.1002/eet.1625
Green, P. E., Wind, J., & Rao, V. R. (1999). Conjoint Analysis: Methods and Applications. In Dorf, R. C. (Ed.), Technology Management Handbook. Boca Raton, Florida: CRC Press.
Haefele, M. A., & Loomis, J. B. (1999). July 11-14. A Comparison of Conjoint Ratings and Rankings: An Application for Passive Use Values of Forest Health. Paper presented at the Western Agricultural Economics Association Annual Meeting, Fargo, ND. Retrieved July 15, 2013, from http://ageconsearch.umn.edu/bitstream/35729/1/sp99ha02.pdf
Harrison, R. W., Ozayan, A., & Meyers, S. P. (1998). A Conjoint Analysis of New Food Products Processed from underutilized Small Crawfish. Journal of Agricultural and Applied Economics, 30(2), 257-265. Retrieved July 15, 2013, from http://ageconsearch.umn.edu/bitstream/15552/1/30020257.pdf
Holzapfel, S., & Wollni, M. (2014). Is GlobalGAP Certification of Small-Scale Farmers Sustainable? Evidence from Thailand. The Journal of Development Studies, 50(5), 731-747. http://dx.doi.org/10.1080/00220388.2013.874558
IBM Corp. (2010). IBM SPSS Conjoint, Version 19.0. Armonk, NY: IBM Corp.
INOFICE (Indonesia Organic Farming Infection and Certification). (2007). Hidup organis, sejahtera dan sehat selaras dengan alam. Retrieved January 15, 2014, from http://inofice.tripod.com/index.html
International Coffee Organization (ICO). (2014). Trade Statistics. Retrieved May 19, 2014, from http://www.ico.org/trade_statistics.asp?section=Statistics
Jena, P. R., Chichaibelu, B. B., Stellmacher, T., & Grote, U. (2012). The impact of coffee certification on small‐scale producers’ livelihoods: a case study from the Jimma Zone, Ethiopia. Agricultural economics, 43(4), 429-440. http://dx.doi.org/10.1111/j.1574-0862.2012.00594.x
Mackenzie, J. (1993). A Comparison of Contingent Preference Models. American Journal of Agricultural Economics, 75(3), 593-603. http://dx.doi.org/10.2307/1243566
Media Perkebunan. (2013). Indonesian Standart Coffee Segera Diterapkan. Retrieved April 24, 2014, from http://www.mediaperkebunan.net/index.php?option=com_contentandview=articleandid=637:indonesian-sta ndart-coffee-segera-diterapkanandcatid=2:komoditiandItemid=26
Méndez, V. E., Bacon, C. M., Olson, M., Petchers, S., Herrador, D., Carranza, C., ... Mendoza, A. (2010). Effects of Fair Trade and organic certifications on smallscale coffee farmer households in Central America and
Mexico. Renewable Agriculture and Food Systems, 25, 236-251.
http://dx.doi.org/10.1017/S1742170510000268
Neilson, J. (2008). Global Private Regulation and Value-Chain Restructuring in Indonesian Smallholder Coffee Systems. World Development, 36(9), 1607-1622. http://dx.doi.org/10.1016/j.worlddev.2007.09.005
Neilson, J. (2014). Developing a Road Map for the Coffee Sector in Indonesia: Situation Analysis and Options for Value Chain Upgrading and Raising Incomes. Paper presented at the Roundtable Workshop organized by the Ministry of Trade of the Republic Indonesia and the Word Bank, Jakarta.
Orme, B. K. (2010). Getting started with conjoint analysis. Strategies for product design and pricing research (2nd ed.). Madison, Wis.: Research Publishers LLC.
Philpott, S. M., Bichier, P., Rice, R., & Greenberg, R. (2007). Field-Testing Ecological and Economic Benefits of Coffee Certification Programs. Conservation Biology, 21(4), 975-985. http://dx.doi.org/10.1111/j.1523-1739.2007.00728.x
Raghavarao, D., Wiley, J. B., & Chitturi, P. (2011). Choice-Based Conjoint Analysis: Models and Designs (1st ed.). Boca Raton: Taylor and Francis Group, LLC. USA. Retrieved July 10, 2013, from http://doww.ru/docs/5/4046/conv_1/file1.pdf
Reis, H. J., & Santos Silva, J. M. C. (2006). Hedonic prices indexes for new passenger cars in Portugal (1997–2001). Economic Modelling, 23(6), 890-908. http://dx.doi.org/10.1016/j.econmod.2006.04.003
Ruben, R., & Fort, R. (2012). The Impact of Fair Trade Certification for Coffee Farmers in Peru. World Development, 40(3), 570-582. http://dx.doi.org/ 10.1016/j.worlddev.2011.07.030
Ruben, R., & Zuniga, G. (2011). How standards compete: comparative impact of coffee certification schemes in Northern Nicaragua. Supply Chain Management: An International Journal, 16(2), 98-109. http://dx.doi.org/10.1108/13598541111115356
Rueda, X., & Lambin, E. F. (2013). Responding to Globalization: Impacts of Certification on Colombian Small-Scale Coffee Growers. Ecology and Society, 18(3), 215-227. http://dx.doi.org/10.5751/ES-05595-180321
Setiawan, A., Cinner, J. E., Sutton, S. G., & Mukminin, A. (2012). The Perceived Impact of Customary Marine Resource Management on Household and Community Welfare in Northern Sumatra, Indonesia. Coastal Management, 40(3), 239-249. http://dx.doi.org/10.1080/08920753.2012.677626
Subervie, J., & Vagneron, I. (2013). A Drop of Water in the Indian Ocean? The Impact of GlobalGap Certification on Lychee Farmers in Madagascar. World Development, 50(0), 57-73. http://dx.doi.org/10.1016/j.worlddev.2013.05.002
Sugandhi, H. (2014). Developing a Road Map for the Coffee Sector in Indonesia: Potensi, Hambatan dan Strategi Pengembangan Kopi Indonesia. Paper presented at the Roundtable Workshop organized by the Ministry of Trade of the Republic Indonesia and the Word Bank, Jakarta.
Tano, K., Kamuanga, M., Faminow, M. D., & Swallow, B. (2003). Using conjoint analysis to estimate farmer’s preferences for cattle traits in West Africa. Ecological Economics, 45(3), 393-407. http://dx.doi.org/10.1016/S0921-8009(03)00093-4
Utting-Chamorro, K. (2005). Does fair trade make a difference? The case of small coffee producers in Nicaragua. Development in Practice, 15(3-4), 584-599. http://dx.doi.org/10.1080/09614520500075706
Valkila, J., & Nygren, A. (2010). Impacts of Fair Trade certification on coffee farmers, cooperatives, and laborers in Nicaragua. Agriculture and Human Values, 27(3), 321-333. http://dx.doi.org/10.1007/s10460-009-9208-7
Walley, K., Parsons, S., & Bland, M. (1999). Quality assurance and the consumer: A conjoint study. British Food Journal, 101(2), 148-162. http://dx.doi.org/10.1108/00070709910261936
Weiner, J. (1994). Consumer electronics marketer uses a conjoint approach to configure its new product and set the right price. Marketing Research, 6(3), 7-11.
Appendix
Appendix A. Display of full profiles (orthogonal design)
Card ID Price
Conservation Fairness Pre-finance Contract between seller and buyer
Yes Yes
2 No Large Estates Biodiversity, soil fertility, agro- ecology
Sustainability Pre-finance No Contract Yes Yes
3 Yes Smallholder
farmers in group or cooperative
Conservation Fairness Pre-finance No Contract No No
4 No Large Estates Conservation Fairness No Credit Contract between seller and buyer
No Yes
5 No Smallholder
farmers in group or cooperative
Conservation Sustainability No Credit Contract between seller and buyer
No Yes
6 Yes Smallholder
farmers in group or cooperative
Organic Sustainability No Credit Contract between seller and buyer
Yes No
7 Yes Large Estates Conservation Sustainability Pre-finance No Contract No No 8 No Large Estates Conservation Fairness No Credit No Contract Yes No
9 No Smallholder
farmers in group or cooperative
Conservation Sustainability No Credit No Contract Yes No
10 Yes Smallholder
Sustainability No Credit No Contract No Yes
11 No Large Estates Organic Sustainability Pre-finance Contract between seller and buyer
No No
12 Yes Large Estates Conservation Sustainability Pre-finance Contract between seller and buyer
Yes Yes
13 No Smallholder
farmers in group or cooperative
Organic Fairness Pre-finance No Contract Yes Yes
14 No Smallholder
Fairness Pre-finance Contract between seller and buyer
No No
15 Yes Large Estates Biodiversity, soil fertility, agro- ecology
Fairness No Credit Contract between seller and buyer
Yes No
Appendix B. Preliminary list of attributes and levels of certification programmes
Attributes
Attribute Levels
1 2 3 4
Certification Target All Producers High quality coffee grower only
Smallholder Farmer in groups or cooperatives
Large estates
Community outreach Premium use for community programmes
Linkages with input suppliers and labourer
Project in coffee communities Credit Pre-finance Through (Local) banks Farmer Loan Fund Environmental Focus Close to environmental
conservation
Biodiversity, soil fertility, agro-ecology
Close to organic input Soil fertility, erosion resilience Inspection Frequency and
accreditation
Annually At least annual Every 3 years
Key aspects Labor, livelihood and participation
Main Focus Fairness Sustainability Responsible sourcing
Market Focus All Market Mainstream Niche, Specialty
Marketing schemes Contract between
Set by the programme Set by market
Price Premium Yes (minimum floor price/ market price +price
Scope of Programme All aspects: Social, Economic, and
Standards Minimum and progress standard
Minimum compliance standard
Scorecard with indicators Supply chain coverage Supply chain record Chain of custody
requirements
Appendix C. The descriptive statistic of respondents to the conjoint survey
N Mean Std.
Deviation Std. Error
95% Confidence Interval for Mean
Minimum Maximum Lower Bound Upper Bound
Age Uncertified Lambar 35 39.86 7.923 1.339 37.14 42.58 25 52
ORGANIC 35 40.06 7.554 1.277 37.46 42.65 25 55
UTZ 35 42.11 9.216 1.558 38.95 45.28 23 60
Uncertified Tanggamus 35 45.51 11.559 1.954 41.54 49.48 21 75
4C 35 45.17 10.942 1.850 41.41 48.93 25 69
RFA 35 38.86 7.329 1.239 36.34 41.37 21 50
Total 210 41.93 9.490 .655 40.64 43.22 21 75
Education Uncertified Lambar 35 8.89 6.850 1.158 6.53 11.24 5 46
ORGANIC 35 8.29 2.573 .435 7.40 9.17 6 16
UTZ 35 8.43 2.305 .390 7.64 9.22 6 12
Uncertified Tanggamus 35 7.74 2.616 .442 6.84 8.64 5 16
4C 35 8.51 2.853 .482 7.53 9.49 6 16
RFA 35 8.89 1.922 .325 8.23 9.55 6 12
Total 210 8.46 3.573 .247 7.97 8.94 5 46
Farming experiences
Uncertified Lambar 35 13.1429 8.10643 1.37024 10.3582 15.9275 2.00 35.00 ORGANIC 35 17.2286 7.29257 1.23267 14.7235 19.7337 5.00 36.00
UTZ 35 16.5429 9.03048 1.52643 13.4408 19.6449 1.00 40.00
Uncertified Tanggamus 35 13.8000 9.18375 1.55234 10.6453 16.9547 .00 40.00
4C 35 14.4857 10.20199 1.72445 10.9812 17.9902 2.00 48.00
RFA 35 13.4571 6.59029 1.11396 11.1933 15.7210 1.00 30.00
Total 210 14.7762 8.53041 .58865 13.6157 15.9367 .00 48.00
Landholding Uncertified Lambar 35 2.0286 4.05104 .68475 .6370 3.4202 .50 25.00
ORGANIC 35 1.6000 .98182 .16596 1.2627 1.9373 .75 5.00
UTZ 35 1.1914 .68829 .11634 .9550 1.4279 .20 3.00
Uncertified Tanggamus 35 .8286 .66358 .11217 .6006 1.0565 .25 3.00
4C 35 1.3657 .51831 .08761 1.1877 1.5438 .50 2.30
RFA 35 1.6214 1.01889 .17222 1.2714 1.9714 .50 5.00
Total 210 1.4393 1.82470 .12592 1.1911 1.6875 .20 25.00
Productivity Uncertified Lambar 35 925.0000 77.64929 13.12513 898.3265 951.6735 750.00 1000.00 ORGANIC 35 1221.1903 463.37835 78.32524 1062.0143 1380.3663 750.00 3000.00
UTZ 35 806.1909 221.18529 37.38714 730.2111 882.1707 400.00 1500.00 Uncertified Tanggamus 35 704.0714 219.88907 37.16804 628.5369 779.6060 400.00 1200.00
4C 35 582.7640 194.24646 32.83364 516.0380 649.4900 266.67 1000.00
RFA 35 850.5714 304.92953 51.54250 745.8245 955.3184 400.00 1600.00 Total 210 848.2980 335.94640 23.18250 802.5965 893.9995 266.67 3000.00 Years of
participation in certification programs
Uncertified Lambar 35 .00 .000 .000 .00 .00 0 0
ORGANIC 35 4.00 .767 .130 3.74 4.26 2 5
UTZ 35 3.60 1.557 .263 3.07 4.13 1 6
Uncertified Tanggamus 35 .00 .000 .000 .00 .00 0 0
4C 35 1.91 .373 .063 1.79 2.04 1 3
RFA 35 4.29 .926 .156 3.97 4.60 2 5
Total 210 2.30 1.969 .136 2.03 2.57 0 6
Copyrights
Copyright for this article is retained by the author(s), with first publication rights granted to the journal.