THE POTENTIAL USE OF ULTRAVIOLET-VISIBLE SPECTROSCOPY AND SOFT INDEPENDENT MODELLING OF CLASS ANALOGIES
(SIMCA) FOR CLASSIFICATION OF INDONESIAN PALM CIVET COFFEE (KOPI LUWAK)
DIDING SUHANDY1*, MEINILWITA YULIA2, SRI WALUYO1, CICIH SUGIANTI1, RIRI IRIANI1, FIPIT NOVI HANDAYANI1AND NOVI APRATIWI1
1)
Department of Agricultural Engineering, The University of Lampung, Jl. Soemantri Brojonegoro No. 1 Gedong Meneng Bandar Lampung, Lampung, Indonesia 35145 2)
Department of Agricultural Technology, Lampung State Polytechnic, Jl. Soekarno Hatta No. 10, Rajabasa Bandar Lampung, Lampung, Indonesia
*corresponding author:[email protected]
ABSTRACT
In this study, the potential use of ultraviolet-visible (UV-Vis) spectroscopy and soft independent modelling of class analogies (SIMCA) for classification of Indonesian palm civet coffee (kopi luwak) was investigated. A number of 20 samples were used. The samples consisted of 10 samples of pure civet coffee without any adulteration (non-adulteration) and another 10 samples of mixture civet coffee adulterated with Arabica coffee (adulteration). All
samples were extracted using distilled water and filtered. The spectral acquisition was performed with 10 mm of cuvette cell using a UV-Vis spectrometer (Genesys™ 10S UV-Vis, Thermo Scientific, USA) in the range of 200-450 nm. The result showed that using principal component analysis (PCA) of moving average smoothing spectra, a clear separation of non-adulteration and non-adulteration samples could be obtained. The SIMCA classification method showed that it is possible to classify and separate the samples into two different classes (non-adulteration and (non-adulteration samples) with accuracy, sensitivity and specificity was more than 90%. This result will open a development of a quick and reliable method based on UV-Vis spectra for civet coffee authentication in near future.
Keywords:UV-Vis spectroscopy, chemometrics, SIMCA, PCA, classification1. INTRODUCTION
(Indonesian words for coffee and palm civet) which is well known as the world’s priciest and rarest coffee (Marcone, 2004). Luwak coffee is any coffee bean (Arabica or Robusta) which has been eaten and passed through the digestive tract of Asian palm civet (Paradoxurus hermaphroditus), which uses its keen senses to select only the best and ripest berries. As a result, its rarity as well as the coffee’s exotic and unique production process ultimately accounts for its high selling price, approximately a hundred times higher than regular coffee (International Coffee Organization,http://www.ico.org/prices/pr-prices.pdf).
As one of the most profitable trading products, Luwak coffee has been a target for fraud trading by mixing Luwak coffee with other cheaper coffee. In order to protect the authenticity of Luwak coffee and protect consumer from Luwak coffee adulteration, it is very important to develop a robust and easy method for adulteration detection and quantification in Luwak coffee. Recently, food authentication is a major challenge that has become increasingly important due to the drive to guarantee the actual origin of a product and for determining whether it has been adulterated with contaminants or filled out with cheaper ingredients (Ashurst and Dennis, 1996; Singhalet al.,1997).
At present, there is no internationally accepted method of verifying whether a bean is
establish a rapid and simple method for discrimination of Luwak coffee and its adulteration.
2. MATERIALS AND METHODS 2.1. Sample preparation
A number of 1 kg ground roasted Luwak Robusta coffee (Indonesian palm civet coffee) samples were collected directly from coffee farmers at Liwa, Lampung, Indonesia (Hasti coffee Lampung). Another 1 kg ground roasted Arabica coffee samples were also provided for making Luwak coffee adulteration. All coffee samples were grinded using home-coffee- grinder (Sayota). Since that particle sizes in coffee powder has significant influence to spectral analysis, it is important to use same particle size in coffee powder samples (Suhandy et al., 2016). In this research we use particle size of 420 µm by sieving through a nest of U. S. standard sieves (Mesh number of 40) on a Meinzer II sieve shaker (CSC Scientific Company, Inc. USA) for 10 minutes. The experiments were performed at room temperature (around 27-29°C). In this research we prepared 20 samples of coffee samples which consist of two classes, class A and B. Class A has 10 samples of Luwak coffee without adulteration. Class B has 10 samples of Luwak coffee with adulteration (adulterated with Arabica coffee in the range of adulteration 10-50%).
An aqueous extraction procedure of the coffee samples was performed as described by Souto et al. (2015). First, 1.0 g of each sample was weighed and placed in a glass beaker. Then, adding 10 mL of distilled water at 90-98°C then mixed with magnetic stirring (Cimarec™ Stirrers, model S130810-33, Barnstead International, USA) at 350 rpm for 5 min. Then the samples were filtered using a 25 mm pore-sized quantitative filter paper coupled with an Erlenmeyer. After cooling process to room temperature (for 20 min), all extracts were then diluted in the proportion of 1:20 (mL: mL) with distilled water. UV-Vis-NIR spectra from the aqueous extracts were acquired using a Vis spectrometer (Genesys™ 10S UV-Vis, Thermo Scientific, USA).
2.2. Instrumentation and spectra data acquisition
Wavelength (nm)
Figure 1. The spectral data of 20 coffee samples acquired using UV-Visible spectrometer in the range of 200-450 nm
measurement step, blank (the same distilled water used in extraction process) was placed inside of the sample cell to adjust the 100% transmittance signal.
2.3. Data analysis
All recorded spectra data were transferred to computer via USB flash disk and then convert the spectra data from .csv extension into an excel data (.xls). All spectrum then smoothed using moving average algorithm with number of averaging is 3 segments. For classification, a SIMCA model was developed using PCA (principal component analysis) for each class. The calculation of smoothing spectra and developing SIMCA model were done using a multivariate analysis program The Unscrambler® version 9.8 (CAMO AS, Norway). The performance of classification result was evaluated using three parameters: accuracy, sensitivity and specificity (Lavine, 2009).
3. RESULTS AND DISCUSSION
Fig. 1 shows the result of spectral acquisition of 20 samples of Luwak coffee with and without adulteration in the range of 200-450 nm. It is clear that all spectral data (20 samples) are almost identical. It is very difficult to see any differences between samples Luwak coffee with and without adulteration. Here, we identify several peaks at 220 nm, 255 nm, 280 nm, 310 nm and 325 nm. The peak at 220 nm and 280 nm however is little bit
noisy. The peak at
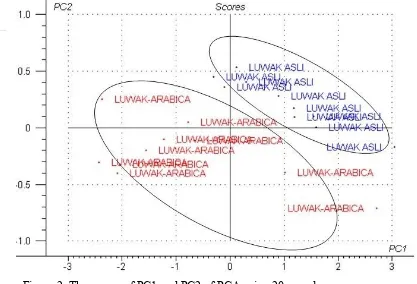
Figure 2. The scores of PC1 and PC2 of PCA using 20 samples.
Fig. 2 shows the result of global principal component analysis (PCA) of 20 samples (all samples). The figure shows the scores of PC1 and PC2 (in total explain 96% of sample variance). It can be seen that using PC1 and PC2, the samples can be divided roughly into two groups or two classes (luwak coffee without adulteration and luwak coffee with adulteration). This figure suggests us that the 20 samples can be separated into two different classes.
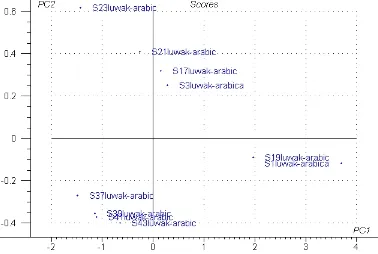
Figure 3. The result of PCA for samples in class A (luwak coffee without adulteration).
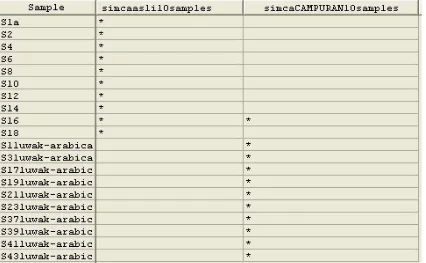
Figure 5. The result of classification using model SIMCA class A and B for 20 samples.
Fig. 5 shows the result of classification using developed SIMCA model for both class A and B at 10% significance level. It can be seen that sample number S16 is actually belong to class A (Luwak coffee without adulteration). However, the model classifies the sample S16 is belong to both class A and B. For other samples, the classification result is very satisfied where all samples successfully classify into proper class. For example, all samples from S1luwak-arabica until S43luwak-arabica are actually belong to class B (luwak coffee with adulteration) and the developed SIMCA model successfully classify all those samples into class B.
In order to calculate the performance of classification, a confusion matrix was created, with the accuracy, sensitivity and specificity of the coffee samples classifications using developed SIMCA models. It can be seen that SIMCA results were satisfactory (superior to
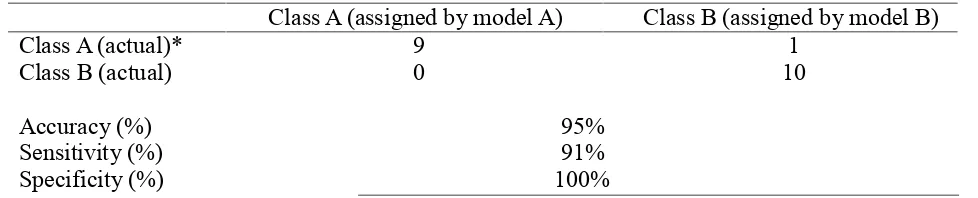
Table 1. Confusion matrix with accuracy, sensitivity and specificity of the classification of coffee samples by SIMCA.
Class A (assigned by model A) Class B (assigned by model B)
Class A (actual)* 9 1
Class B (actual) 0 10
Accuracy (%) 95%
Sensitivity (%) 91%
Specificity (%) 100%
This research demonstrates a potential use of UV-Visible spectroscopy along with chemometrics method to identify adulteration in Luwak coffees. The classification result was satisfactory with accuracy rate, sensitivity and specificity were 95%, 91% and 100%, respectively. This promising result has opened a possible application of using UV-Visible spectroscopy and chemometrics method to establish a rapid and acceptable method for classification of Indonesian Luwak coffee. This method may be applied to protect our Indonesian Luwak coffee from any adulteration using other cheaper coffees.
AKNOWLEDGEMENTS
We express our deepest appreciation to Hasti coffee Lampung, for providing coffee samples. We also gratefully acknowledge support of the Indonesian Ministry of Research,
Technology and Higher Education (KEMENRISTEKDIKTI) via Penelitian Strategis Nasional (STRANAS) 2016 (Nomor: 419/UN26/8/LPPM/2016) and The University of
Lampung, Indonesia. We thank to the Department of Agricultural Engineering, The University of Lampung for their permission to use their facilities for spectral data acquisition.
REFERENCES
Ashurst, P.R., and Dennis, M.J. (Eds.),. 1996. Food Authentication, Blackie Academic & Professional, London, UK.
Belay, A., Ture, K., Redi, M., and Asfaw, A. 2008. Measurement of caffeine in coffee beans with UV/vis spectrometer. Food Chemistry,108: 310–315.
Clarke, R. J., and Macrae, R. 1985. Coffee chemistry (Vol. 1). Amsterdam: Elsevier Applied Science, pp. 124–125.
Esquivel, P., and Jiménez, V. M. 2012. Functional properties of coffee and coffee by-products. Food Research International,46: 488–495.
Marcone, M. F. 2004. Composition and properties of Indonesian palm civet coffee (Kopi Luwak) and Ethiopian civet coffee, Food Res. Int.,37: 901–912
Nebesny, E. and Budryn, G. 2006. Evaluation of sensory attributes of coffee brews from robusta coffee roasted under different conditions, Eur. Food Res. Technol., 224: 159– 165.
Shilbayeh, N.F. and Iskandarani, M.Z. 2004. Quality control of coffee using an electronic nose system. American Journal of Applied Sciences,1(2): 129–135.
Singhal, R.S., Kulkarni, P.R., and Rege, D.V. 1997. Handbook of Indices of Food Quality and Authenticity, Woodhead Publishing Ltd., Cambridge, UK.
Souto, U.T.C.P., Pontes, M.J.C., Silva, E.C., Galvão, R.K.H., Araújo, M.C.U., Sanches, F.A.C., Cunha, F.A.S., and Oliveira, M.S.R. 2010. UV–Vis spectrometric classification of coffees by SPA–LDA. Food Chemistry,119: 368–371.