SUDARNO SUMARTO AND INDUNIL DE SILVA
TNP2K WORKING PAPER 03 – 2013
December 2013
EDUCATION TRANSFERS, EXPENDITURES AND
CHILD LABOUR SUPPLY IN INDONESIA:
TNP2K Working Papers Series disseminates the findings of work in progress to encourage discussion and exchange of ideas on poverty, social protection and development issues. Support for this publication has been provided by the Australian Government through the Poverty Reduction Support Facility (PRSF).
The findings, interpretations and conclusions herein are those of the author(s) and do not necessarily reflect the views of the Government of Australia or the Government of Indonesia.
The text and data in this publication may be reproduced as long as the source is cited. Reproductions for commercial purposes are forbidden.
Suggestion to cite: Sumarto, Sudarno, and Indunil De Silva. 2013. “Education Transfers, Expenditures and Child Labour Supply in Indonesia: An Evaluation of Impacts and Flypaper Effects.” TNP2K Working Paper 03-2013, Tim Nasional Percepatan Penanggulangan Kemiskinan (TNP2K), Jakarta, Indonesia.
To request copies of the paper or for more information on the series; please contact the TNP2K - Knowledge Management Unit ([email protected]).
Papers are also available on the TNP2K’s website (www.tnp2k.go.id)
TNP2K
Email: [email protected]
SUDARNO SUMARTO AND INDUNIL DE SILVA
TNP2K WORKING PAPER 03 – 2013
December 2013
EDUCATION TRANSFERS, EXPENDITURES AND
CHILD LABOUR SUPPLY IN INDONESIA:
Education Transfers, Expenditures and Child Labour Supply in Indonesia:
An Evaluation of Impacts and Flypaper Effects
Sudarno Sumarto and Indunil De Silva
1December 2013
Abstract
In this paper we investigate how the receipt of educational transfers, scholarships and related assistance programmes affects the labour supply of children and the marginal spending behaviour of households on children’s educational goods. We use a nationally representative household survey of unusual scope and richness from Indonesia. We found strong evidence of educational cash transfers and related assistance programmes significantly decreasing the time spent by children on income-generating activities in Indonesia. Households receiving educational transfers, scholarships and assistance were also found to spend more at the margin on voluntary educational goods. These results were stronger on children living in poor families. The findings of this study lend support to the growing view in the literature that educational transfers, scholarships and related assistance can actually have a positive impact on economic development by increasing the level of investment in human capital. Our results are particularly relevant for understanding the role of cash transfers and education assistance in middle-income countries, where enrolment rates are already at satisfactory levels, but the challenge is to keep post-primary students in school. Finally, the principle message that emerges from the study is: there are quantitatively non-negligible, average gains from educational transfers and support programmes on household education spending and child labour, especially for the poor.
Key Words: Cash transfers, child labour, education expenditure, flypaper effect.
1 Policy Adviser & Senior Economist, respectively at The National Team for the Acceleration of Poverty
Reduction (TNP2K), Indonesia, Vice-President Office.
1. Introduction
Government transfers and subsidies that aim to address the issues of poverty, child labour and
low educational attainment, especially among women and children, have generated
substantial interest among researchers and policy makers. Educational transfers and subsidies
have become particularly popular policy tools, as they can deliver the initial stimulus to move
an economy to a relatively more desirable equilibrium in the presence of poverty traps,
externalities and multiple equilibria (Banerjee 2003 and Galor and Zeira 1993). As
market-oriented, demand-side interventions that combat poverty and child labour, educational cash
transfers, school voucher programmes and subsidised education schemes complement
traditional supply-side policies, such as general subsidies or investments in schools, hospitals,
and social services. Furthermore, they generate positive externalities and higher equity in
educational expenditures, leading to higher levels of welfare and yielding concave returns for
the policy makers (Das 2004).
Both conditional and Unconditional Cash Transfers (UCTs) have been rigorously evaluated
worldwide. Conditional transfer programmes such as Progresa (now referred to as
Oportunidades) in Mexico, Bolsa Escola (now called Bolsa Familia) in Brazil, and Red de
Proteccion Social in Nicaragua, have been showed to foster investment in human capital,
increase the use of health resources, and successfully combat poverty and vulnerability (J.
Behrman et.al 2005; Bourguignon et.al 2003). A vast amount of literature indicates that both
conditional and Unconditional Cash Transfers (UCTs) have successfully increased school
attendance and reduced the child labour supply (ECLAC, 2006; Fizbein and Schady, 2009;
Behrman et al. 2005; Schady & Araujo 2008). However, recent impact evaluation studies
have also shown that in some instances interventions that encourage schooling and aim to
reduce child labour have had unintended consequences and have actually increased the
probability of children engaging in work (Cigno and Rosati, 2005; Edmonds, 2007).
Therefore, as government transfers and subsidies are becoming increasingly more popular in
developing countries, the aim of this paper is to investigate the effect of educational transfers
on school attendance and child labour, and to find to what extent the intended beneficiaries of
public transfer programmes actually benefit from them. In particular, the study intends to
investigate whether government transfers to a specific household member have an
intra-household ‘flypaper effect’, meaning that they “stick” to that specific member who receives
implies, they generate no or insignificant gains to the recipient of the transfer since
households redistribute the extra income from an individual welfare scheme among all the
members.
In this paper, we first analyse the decisions to attend school and to work. Because the school
and work decisions are closely related, they are treated as simultaneous decisions which will
be analysed in the context of a bivariate Probit model. We begin by assessing the effect of
child labour on schooling and how various individual and household characteristics affect the
chances that a child will attend school and/or participate in other activities that may interfere
with schooling. Next, we investigate how the receipt of educational transfers, scholarships
and related assistance affects the labour supply of children in Indonesia.
Finally, we test for the first time in Indonesia whether an intra-household flypaper effect exists for
child-targeted transfers. We investigate the impact of Indonesia’s education cash transfer programme for poor
students (BSM, Bantuan Siswa Miskin) on both household and child-level voluntary education expenditures. For most households in Indonesia that received the education cash transfer for poor
students, parents had more money for all expenditures, including expenditures on voluntary educational
goods and other, non-educational goods. The existence of IFE in these households would indicate that
parents voluntarily spend the extra money from the transfer on education or education-related goods and
services for the child receiving the transfer.
We will utilise a rich dataset that contains child-specific education expenditures, Indonesia Social and
Economic Survey (Susenas) – 2009. It is a nationwide survey conducted to collect information on social
and economics indices, which functions as a main source of monitoring social and economic progress in
society. Susenas has been conducted on an annual basis since 1963. Since 1992, in addition to a basic
social and economic questionnaire (core), a more specialised questionnaire was introduced (module).
The core questionnaire contains basic information about household and individual characteristics
including health, death, education/literacy, employment, fertility and family planning, housing, and
household expenditure. There are three modules of Susenas and each module is added in a three-year
cycle. In 2009, the module's topic was social life, culture, and education. Unlike previous Susenas, the
same sample was used for both core and module questionnaires. It consisted of 291,753 households and
was designed to be representative at national, province and district/city levels. The Susenas 2009-July
survey contains an education cost data module containing various expenditure categories for each
school-enrolled child. It will enable us to examine if the education cash transfer increased voluntary
2. Schooling, Child Labour and Education Programmes: Review of the
International Evidence
Recent studies have shown that the high costs of education and limited access to schooling
are the main factors behind low school enrolment and increasing child labour. Policies that
reduce the price of education and increase access to schooling have thus been proposed to
reduce child labour. Among them are unconditional assistance programmes, such as the cash
transfer programme in Ecuador (Bono de Desarollo Humano), the old age pension
programme in South Africa, or the child support grants, also in South Africa. They have been
found to in general reduce child labour, increase school enrolment, reduce drop-out rates and
improve health and nutrition in children (Edmonds and Schady 2009; Edmonds 2006; Case,
Hosegood, and Lund 2005; Duflo 2003). Their close relatives, conditional transfer
programmes such as Progresa (now referred to as Oportunidades) in Mexico, Bolsa Escola
(now called Bolsa Familia) in Brazil, and Red de Proteccion Social in Nicaragua, have been
shown to have wider development effects, fostering investment in human capital, increasing
the use of health resources, and successfully combating poverty and vulnerability (J.
Behrman et.al 2005; Bourguignon et.al 2003).
Latin American examples compellingly show that unconditional cash transfers can assist poor
households in meeting the prohibitive cost of children’s education, also that they can
contribute to retaining children in school and limiting child labour supply. Theoretically, as
Ravallion and Wodon (2000) suggest, this link can be demonstrated through an experiment
that creates an exogenous decrease in the price of schooling, which would allow us to see the
impact of the price of education on child labour supply. The wage rate for child labour can be
appropriately used as a component of the price of labour. But unfortunately, since the wage
rate is also the price of leisure, disentangling the own price effect from the cross-price effect
is tricky using wage data. The effects of school price (i.e. as measured by presence of a
school in the region, distance or travel time to school, expenditures on schooling, etc.) on
child labour are thus mixed, primarily due to indicators that poorly capture the school price
(Grootaert and Patrinos, 1998).
Empirically, however, it has been shown that there is a trade-off between children’s
education and work. Studies in Brazil revealed that child labour tends to drive children away
from both school and leisure. Most children who work in Brazil also attend school, but their
not working. School-aged children who work are also less likely to do their homework or
attend after-school tutorials. There thus appears to be some reduction in quantity of schooling
for children who engage in child labour (World Bank 2001).
Moreover, child labour can impede the children’s ability to acquire or retain material at
school, as it often subjects them to physical and emotional strains. In rural areas, working
children are often employed in heavy manual labour and exposed to unsafe working
conditions. Children who work on sisal (jute) or sugarcane plantations often suffer injuries
from long knives and machetes used for cutting, piling, and hauling the crops. In urban areas,
child workers may engage in other arduous activities, such as street vending or garbage
collection, or illegal ones, like selling drugs or prostitution (Cardoso and Souza 2003). At the
same time, there are rewards to work, especially when the skills learnt at the workplace
enhance the returns from schooling.
It is generally agreed that the cause of child labour is parental poverty (Basu, 2003). Basu and
Van (1998) argue further that the past household models discounted an important economic
element in the child labour analysis: a labour market where children are potential workers
will be prone to multiple equilibria. Basu (2003) explains why this insight is important:
"Consider a poor country, where wages are very low and all children are for that very reason
made to work. Now assume, for the sake of argument, that child labour is banned. The firms
that are using child labour will be forced to seek adults to fill those gaps. Hence the wage rate
of adult labour will rise. Now, it is entirely possible that if the wages were high to start with,
then the parents would not have sent the children out to work anyway. Hence, even if the law
is now revoked, wages will be high, children will not work and this will sustain the high
wage. In other words, this economy had multiple equilibria and hence the law works simply
as a mechanism for deflecting the economy from the inferior equilibrium, where wages are
low and children work, to the superior equilibrium, where wages are high and there is no
child labour."
In poor households, especially in developing countries, the decision to send children to work
is quite common, as children are usually a valuable economic resource for poor parents. Cain
(1977) found that children in a Bangladeshi village were economically active from the age of
six, and that boys were net producers by the age of 15. According to Mendelievich (1979),
Cain and Mozumder (1980) and Grootaert and Kanbur (1995), child labour is an integral part
the households' income, and hedge against these risks by sending children to work. Jacoby
and Skoufias (1997) confirm these findings, having found that child labour helps smooth the
incomes of poor rural Indian families who have little access to credit.
Despite the well-established links between education, child labour and cash transfers that
support education, partly due to data limitations few previous studies have examined the
impact of an education cash transfer on child-specific expenditures (even Shi 2008, examines
a school fee exemption and subsidy). According to Rosenzweig (1986), when the household
head acts as the ultimate decision-making unit, the impact of a child-targeted transfer will
depend on the allocation of resources among family members by the household head. For
example, if one child in a family receives a free meal in school, their parents might reallocate
away some food at home to other members of the family, such as their siblings. Similarly,
Jacoby (2002) states that if parental altruism is operative in a Beckerian (1974, 1981)
household model, an infra-marginal transfer to one child should not affect the consumption of
that child, holding household resources constant.
Relatively little attention has also been paid to whether cash transfers that support education
have fly-paper effects. Even the existing studies on intra-household flypaper effects are
mostly nutrition-related, with the exception of Shi (2008). For example, Jacoby (2002)
examines the impact of a school-feeding programme on child caloric intake in the
Philippines. He finds no re-allocation of calories away from the child within the household in
response to the feeding programme. The total daily calorie intake of the recipient child rises
by almost one to one with the school meal calories. Similarly, Afridi (2005) analyses the
impact of a school feeding programme on daily caloric consumption of children in India and
investigates factors that affect the magnitude of the reallocation of resources. The study finds
that the nutrient intake of programme participants increased by 49 to 100 percent per child.
Finally, Shi (2008) studies the existence of resource reallocation within households after a
child receives a subsidy for covering the schooling fees in rural China. The study concludes
that the reductions in educational fees generated by the subsidies were matched by increased
voluntary educational spending on the children receiving these reductions, providing strong
3. Schooling, Child Labour and Education Programmes: Review of the
Evidence from Indonesia
Almost all educational indicators in Indonesia have improved very remarkably over the past
40 years (Suharti 2013). Net enrolment rates for both primary and junior secondary schools
experienced significant increases during this period of time. The net primary school
enrolment rate has increased from 72 percent in 1975 and then reached nearly universal
coverage by 2009. The net enrolment rate for junior secondary education also rose from 18
percent in the 1970s to about 70 percent in recent years. Achievements in early childhood
education (ECD) are also notable. Currently, 50 percent of four- to six year-olds have
received some type of early learning or education (up from 25 percent a decade earlier). The
improvements in school enrolment rates have edged Indonesia closer to other countries in the
Asia-Pacific region in terms of educational attainment, resulting in a higher than usual senior
secondary enrolment rate for its level of GDP per capita. For example, Indonesia's enrolment
rates profile have paralleled that of China, with higher than expected secondary education
enrolment rates for its level of income, but still behind in higher education.
Indonesia is also one of the few countries in the world that increased public expenditure on
education by over 60 percent during the last five-year period. The Government of Indonesia
introduced a constitutionally mandated allocation of (a minimum of) 20 percent of
government spending to education (hereafter "the 20 percent rule") in 2003. This decision led
to an enormous increase in funds allocated for education, making it the largest government
expenditure after fuel subsidies (World Bank 2013).
However, in the backdrop of inspiring outcomes, the benefits of the new education policy are
still not satisfactory. For example, a study conducted by Arza Del Granado, Fengler et al.
(2007) found the existence of a wide gap between the educational attainment of poor and rich
groups at the junior and senior secondary levels. Children from poor families are 20 percent
less likely to be enrolled in junior secondary than children from wealthier families.
Additionally, Suryadarma (2006) found that children living in rural areas have less access to
junior secondary education. Jones (2003) conducted qualitative interviews in several
provinces in Indonesia and found several reasons behind the disparities in access to schooling
across Indonesia. Firstly, children from poor families were found to have difficulties in
paying for transportation costs associated with schooling. Secondly, the relatively low
attend school. Hardjono (2004) investigated the influence of poverty on school drop-outs in
two provinces in Indonesia, Bali and West Nusa Tenggara. Most importantly, the study found
that non-continuation to junior secondary school in both provinces was due to the inability to
pay, particularly for transportation costs, and the inadequate capacity and facilities in the
junior secondary schools. The study found also that cultural factors also play an important
role in educational attainment. One of the primary reasons for the very high primary school
completion rates among Balinese children is the culture of prioritising education in Bali. This
was in contrast to a relatively higher rate of children who did not finish primary school in
West Nusa Tenggara, as a result of a low regard for education among the parents there.
Similarly, the Madurese tribe in Pontianak traditionally arrange for their daughters to be
married as soon as they finish primary school.
Poverty combined with the low educational level of families drives Indonesian children into
child labour. It is estimated that there are some four million children engaged in child labour
in Indonesia, while nearly two-thirds of out-of-school children engage in some productive
activity. One quarter of out-of-school children in the age group 10-14 years have less than
four years of education, implying that they will grow up to be functionally illiterate adults.
These estimates highlight the importance of expanding educational support programmes and
accelerating their implementation.
According to Priyambada, Suryahadi and Sumarto (2002), schooling and part-time work
often go together in Indonesia. They observed a declining trend in child labour, which later
come to a halt as a result of the 1990s crisis, and found that children attend school and engage
in work at the same time. The study also found that students from severely poor families
search for employment to finance their own education. Encouragingly, some of the most
recent figures have shown that overall children’s employment declined during the period
from 2007 to 2010 from 4.9 percent to 3.7 percent for the narrower 10-14 year-old child
population (UCW-ILO, UNICEF, and WB 2012).
Child employment also remains an important policy concern in Indonesia because as many as
half of the children who work are exposed to hazardous conditions in the workplace. Many of
them are engaged in the worst forms of child labour, such as agriculture and domestic
service. Children who work in agriculture, on rubber, palm oil and tobacco farms, often carry
heavy loads, use pesticides and work long hours. They may be exposed to extreme weather,
days of rest or holidays, and may be at risk of mental, physical and sexual abuse (USDOL
2011).
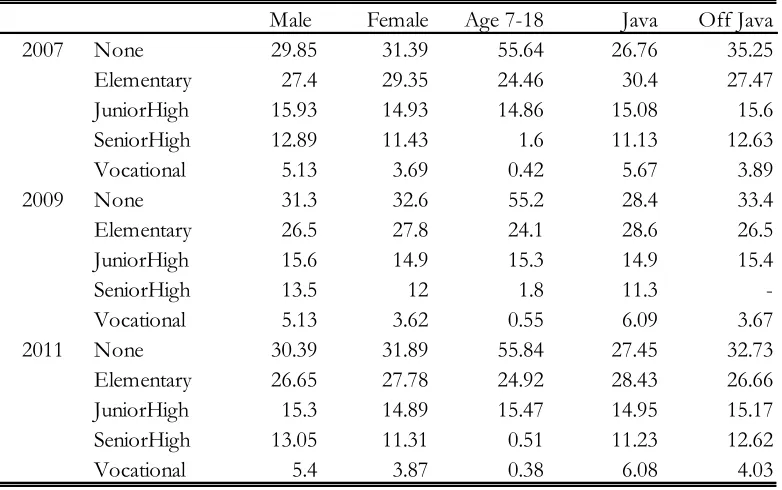
The prevalence of child work varies greatly by location and the level of education of the head
of household. The incidence of child labour is much higher in rural districts in comparison to
cities. It was in the rural areas, however, that Indonesia experienced the largest decline in
child labour during the last decade. The falling trends in rural areas mirror the declining
dominance of the agricultural sector.
Child labour incidence has also been found to fall with the level of education of the
household head. Male children living in households where the head has not finished primary
education have a six times higher probability to work than in households where the head has
a university degree. Child work incidence in general has been decreasing for all the
household-head levels of education in Indonesia (Kis-Katos and Sparrow 2009).
Since the 1998 economic crisis, the government of Indonesia, in partnership with several
development organisations, has been rolling out social assistance programmes to address the
financial difficulties and other constraints that parents and children face with respect to
schooling. Broadly, these education-related government social assistance programmes
include a school operational assistance programme, a scholarship programme for students
from poor families, and school construction and rehabilitation schemes. The fourth
amendment of the Indonesian Constitution also stipulated that the budget for education
should be at least 20 percent of the total State budget. In recent years, there has been a small
but growing literature on the evaluation of education assistance programmes in Indonesia,
especially focusing on school enrolment and dropout rates. Cameron (2009) evaluates the
role played by Indonesia’s social safety net scholarships programme in reducing school
dropout rates during the Asian financial crisis, with the assumption that many households
would find it difficult to keep their children in school, which caused the dropout rates to be
high. He found scholarships to be effective in reducing dropping out from lower secondary
school, the level of schooling at which students were historically most at risk of dropping out.
Sparrow (2007) investigated the impact of the Indonesian scholarship programme, which was
implemented in 1998 to preserve access to education for the poor during the economic crisis.
The study found that the programme increased school enrolment, especially for primary
school aged children from poor rural households. The paper concludes that the scholarships
In this study, we seek to examine the effects of the Cash Transfer for the Poor Students
Programme/Bantuan Siswa Miskin (BSM) that was introduced in 2008 and covers all
education levels from Elementary school level to University. The key objectives of the
programme are to remove barriers that marginalised students face in participating in
education, assist poor students in gaining appropriate access to education services, prevent
dropping out from school, help meet the educational needs of at-risk children and support the
Government’s Nine Years Compulsory Education programme. The programme provides cash
transfers to cover educational costs (such as books, school transportation and uniforms) for students
from poor households, who are selected by school administrators. It is fully financed by the Central
Government and does not require any contributions or cost sharing on the part of students as
beneficiaries, local governments or schools. At present, the programme covers eight million
4. Analytical and Conceptual Framework
We first develop the theoretical model behind the schooling and labour supply decision of
children, assuming the “unitary model” of the household, where the head of the household is
the decision maker. Our model follows Ravallion et al. (2000) and Rosati et al. (2003), where
the utility function of the representative household in our model is given by:
𝑈= 𝑈 𝐶,𝐻,𝑆:𝑋
where household consumption is 𝐶, 𝐻 is the child’s leisure, 𝑆 is child’s school attendance and
𝑋 is a vector of exogenous household child, household and demographic characteristics that
parameterise the utility function.
The time constraint that maximises utility can be expressed as:
𝑇= 𝐻+𝑆+𝐿
where the household head allocated the child’s total time-𝑇, between leisure –𝐻, school
attendance-𝑆, and child’s labour supply-𝐿 By equating adult exogenous household income-𝑌
and output from household production with the cost of production and household
consumption, the household budget constraint can be stated as:
𝑃!𝐶+𝑃!𝑆≤ 𝑌+𝑊𝐿
The household utility maximisation problem can be thus formally stated as:
max
!,!,!
𝑈(𝐶,𝐻,𝑆:𝑋)
𝑠.𝑡. 𝑃!
𝐶+𝑃!𝑆≤ 𝑌+𝑊𝐿
𝑇= 𝐻+𝑆+𝐿
where 𝑃!, 𝑃! and 𝑊 are price of consumption, schooling and child labour. We assume
household income, adult labour supply and leisure to be exogenous. Thus, when parents
become unemployed, it is not because of their choice but due to external market conditions.
Solving the above model yields several important inferences. Comparative statics properties
of the model show that an increase in parent’s income/returns to labour will lead to an
increase in the probability of the child attending school and reduces the numbers of hours the
child works. Similarly, when there are high returns to child labour (increased work
will rise. Employing this framework it can be shown how child labour can be a function of
not only income and wealth but also of parent’s occupation, characteristics and preferences.
Next, we evaluate the impact education cash transfers and related assistance on child labour
and educational expenditure. We start with the hypothesis that the education cash transfer is
fully fungible. Since households have their own preferences on spending, the notion of the
cash transfer being targeted at students becomes inconsistent with the concept of the transfer
being fully fungible. Households have the tendency to cut their own planned spending when
the transfer is less than they would have intended to spend. Under this scenario, one should
not see on average a differential impact on transfer recipients versus non-transfer recipients.
But at the same time there is empirical evidence of flypaper effects where individually
targeted transfers (such as child-specific transfers) had increasing and positive effects on
these individuals/children’s outcomes. Finally with the possibility that expected outcomes to
being ambiguous from a theoretical perspective, the impact of the educational cash transfer
can be presented under the framework of maximising household utility. The household utility
maximising problem can be represented as:
good/other goods, and 𝑃! is the price of voluntary educational goods. The parameters 𝑎 ! and
𝑎
! represents household preferences for voluntary educational goods and the composite good,
which are determined by individual and household characteristics such as age, gender,
education, demographic compositions, etc. Assuming an interior optimum and combining the
first-order conditions, we can derive an equation:
substitution between 𝑋 and 𝐸 to the ratio of the prices of the two goods. Optimal demand
functions for 𝑋 and 𝐸 can be expressed as:
𝑋∗ = 𝑋(𝐼,𝑎
!, 𝑎!,P)
𝐸∗ = 𝐸(𝐼,𝑎
!, 𝑎!,P)
The consumption of voluntary educational goods-𝐸 will be a function that is increasing in
income, preferences and the relative price of the composite good.
Subsequently, the educational cash transfer can be introduced by re-writing a new budget
constraint that maximises 𝑈 as:
𝑆.𝑡. 𝑃!𝑋+𝑃
!𝐸 ≤𝐼+T
The new optimal demand functions with the cash transfer can be written as:
𝑋∗ = 𝑋(𝐼,𝑎
!, 𝑎!,P, T)
𝐸∗ = 𝐸(𝐼,𝑎
!, 𝑎!,P, T)
It is evident that the cash transfer will not alter the relative price of education and will only
5. Empirical Strategy and Data
We begin with the econometric specification of the child’s decision to attend school or to
work. The decision for a child to attend school, supply labour, or both, is a time allocation
decision. Thus the decision whether a child works or attends school is a joint one as the child,
or its parents, would have to choose between both activities. We use a bivariate Probit model
that explicitly takes this interdependency into account and tests the likelihood of children
working and going to school, taking into consideration varied individual and household
characteristics. The model permits for the existence of possible correlated disturbances
between two Probit equations. It also allows us to test whether the joint estimation has
additional explanatory power compared to using univariate Probit estimation for each
decision.
The general structure of the bivariate Probit specification can be expressed as:
𝑦!∗ =𝑿𝟏!𝜷𝟏+𝜀 !
𝑦!∗=𝑿𝟐!𝜷𝟐+𝜀!,
where the observability criteria for the two binary outcomes can be stated as:
𝑦! = 1 𝑖𝑓 𝑦! ∗>0
0,𝑜𝑡ℎ𝑒𝑟𝑤𝑖𝑠𝑒
𝑦!= 1 𝑖𝑓 𝑦! ∗>0
0,𝑜𝑡ℎ𝑒𝑟𝑤𝑖𝑠𝑒,
where in turn 𝑿𝟏 and 𝑿𝟐 are vectors of individual and household covariates that effect the
child’s schooling and labour supply decision respectively. 𝜀
! and 𝜀! are error terms to have a
bivariate normal distribution with 𝐶𝑜𝑣 𝜀
!,𝜀!|𝑿𝟏,𝑿𝟐 =𝜌
The joint probabilities that enter into the likelihood function can be expressed as:
ℙ!"=𝑃𝑟 𝑦!=𝑖,𝑦!=𝑗 |𝑿𝟏,𝑿𝟐 =Φ 𝕡𝑿𝟏!𝜷𝟏,𝕢𝑿!𝟐𝜷𝟐; 𝕡,𝕢,𝜌 ,
where 𝕡= 1 𝑖𝑓 𝑦!=1
−1 𝑖𝑓 𝑦!=0 and 𝕢==
The log-likelihood for the bivariate Probit is then given by:
estimates are obtained by simultaneously setting to zero the derivative of the log likelihood
function with respect to the parameters of interest. The estimated regression coefficients will
be converted into marginal effects with the same vector of covariates being included in the
two equations for the system to be identified.
Subsequently, we employ the quasi-experimental propensity score methodology to estimate
the impact of education transfers and related assistance on child’s labour supply and
educational expenditure.
We will utilise a rich dataset that contains individual-specific education expenditures,
enabling us to examine if the education cash transfer increased voluntary education
expenditure and whether the fly-paper effect exists within the household. In this study, we
accept the existence of the intra-household fly-paper only if there is a statistically significant
increase or positive impact on the voluntary education expenditure of a child receiving
relationship between the treatment and outcome. In a canonical single treatment setting, one
can observe 𝑌!, 𝑋!, 𝐷! , 𝑖…,𝑁 and the impact on 𝑌 from a hypothetical change in 𝐷 while
holding 𝑋 constant. Such inference is the key feature of a potential outcome model, where the
outcome variable of the treated state is compared to the outcome variable of the untreated
state. However, it is impossible to simultaneously observe both states for any given
individual. Thus, the problem is akin to one of missing data, which can be solved by
question is: `what would have happened to children who received the education transfer if
they had not received the transfer’. First, assume the setup of a randomised treatment
assignment, where no one is included in the treatment group because the benefits of the
treatment to that individual would be large, and no one is excluded because the expected
benefit is small. Let the vector of observables be 𝑌!, 𝑋!, 𝐷! , 𝑖…,𝑁 . Where 𝑌 is the
scalar-value outcome variable, 𝑋 is a vector of observables, and 𝐷 a binary indicator of treatment (𝐷
takes the value of 1 if the child receives the transfer, 0 otherwise). In the potential outcome
framework, one can define ∆ as the difference between the outcome in the treated and
untreated states as:
∆= 𝑌!−𝑌!
It is important to note that ∆ is not directly observable, since an individual cannot be observed
in both states. The two key evaluation parameters that will be used in this study will be the
average treatment effect on the treated (ATT), defined as (in sample analogues):
ATT=N1 ∆!|D! =1
programme. The treatment evaluation problem can be easily understood by writing the ATT
as
𝐴𝑇𝑇= 𝐸 ∆|𝐷 =1 =𝐸 𝑌!|𝐷 =1 −𝐸(𝑌!|𝐷 = 1)
From the above equation, the problem of selection bias is straightforward, since the second
term on the right side- 𝐸(𝑌!|𝐷 =1), the counterfactual mean of the treated, is not observable.
If the condition 𝐸 𝑌!|𝐷 =1 = 𝐸(𝑌!|𝐷 =1) holds, one can use the non-participants in the
cash transfer programme as the comparison group. But with non-experimental data this
condition will not hold, since the components that determine the receiving the transfer also
determines the outcome variable of interest. Thus, the outcomes of the transfer recipients
would differ even in the absence of receiving the transfer, leading to a selection bias. It may
be the case that selection bias can be fully accounted for by observables characteristics (such
as age, skill differences, etc.). In this case, simply including the relevant variables in the
outcome equation can eliminate selection bias. But in practice, unobservable characteristics
The difference between the left hand side of the equation and the 𝐴𝑇𝑇 is the self-selection
bias. The true parameter 𝐴𝑇𝑇 is only identified if
𝐸 𝑌!|𝐷 =1 −𝐸 𝑌!|𝐷 =0 = 0
In this paper, we adopt the quasi-experimental propensity score matching method (PSM) that
deals explicitly with treatment selection bias and addresses the key evaluation problem of
𝐸 𝑌!|𝐷 = 1 being unobservable.
The essential idea of propensity score matching (PSM) is to match participants and
non-participants on their observable characteristics. The mean effect of treatment (participation)
can be estimated as the average difference in outcomes between the treated and non-treated.
When the counterfactual mean for the treated- 𝐸 𝑌!|𝐷 = 1 , is not observed, one has to
invoke `identifying assumptions' to estimate the casual effect of a programme on the
outcome. The first identification assumption in propensity score matching is referred to as the
conditional independent assumption (CIA), and is expressed as:
𝑌!,𝑌! ⊥𝐷|𝑋
It states that outcomes are independent of programme participation, after controlling for the
variation in outcomes induced by differences in 𝑋. The second assumption identification
assumption is referred to as the overlap or matching assumption, written as
0<𝑃𝑟 𝐷 =1|𝑋 < 1
This assumption implies that for each value of 𝑋 there is both treated and untreated
individuals. In other words, for each participant there is another non-participant with a similar
𝑋. A practical constraint that exists in matching is that when the number of covariates 𝑋!
increases, the chances of finding a match reduces. However, Rosenbaum and Rubin (1983)
showed that matching on the propensity score 𝑃(𝑋)- the probability of participating in a
programme, could achieve consistent estimates of the treatment effect the same way as
matching on all covariates. Essentially, the proposition Rosenbaum and Rubin (1983) can be
stated as: Let 𝑃 𝑋! be the probability of unit 𝑖 having been assigned to treatment, defined as
𝑃 𝑋! ≡ Pr 𝐷! =1 𝑋!) =𝐸(𝐷! 𝑋! . Assume that 0< 𝑃 𝑋! <1, for all 𝑋! and
Pr 𝐷!,𝐷! ,𝐷! 𝑋!,𝑋!,…𝑋!)= !!!,…!𝑃 𝑋! !!(1−𝑃(𝑋!)!!!! for the 𝑁 units in the
sample. Then, 𝑌!!,𝑌!! ⊥𝐷! | 𝑋! ⇒ 𝑌!!,𝑌!! ⊥𝐷! 𝑃 𝑋! . Corollary: If 𝑌!!,𝑌!! ⊥
∆|!!! = 𝐸 𝐸 𝑌! 𝐷! = 0,𝑃 𝑋! |𝐷! =1 . The proposition implies that observations with the
same propensity score have the same distribution of the full vector of covariates 𝑋!. The
propensity score will be estimated by a Probit model: Pr 𝐷 =1|𝑋=𝑥 =Φ 𝑋′𝛽 .
After estimating the propensity score, the next decision to be made concerns the common
support region(s). Enforcing the common support region ensures that any combination of
characteristics observed in the participation group can also be observed among
non-participants. The approach referred to as the `minima and maxima' condition will be used in
all estimations in this paper. The basic idea of this condition is to delete all participants,
whose propensity score is smaller than the minimum and higher than the maximum in the
non-participants. Therefore participants who fall outside the common support region will be
discarded and for these individuals the treatment effect will not be estimated. When the
proportion of lost individuals is small, this poses few problems. However, if there is a
significant reduction in the sample size, then there are doubts about whether the estimated
effect on the remaining individuals can be viewed as a representative of the full sample.
Having enforced the common support region, the next step is to choose the matching
algorithm. The general formula for the matching estimator is given by:
𝐵! =
weighting function that depends on the specific matching estimator. Results will be presented
for four matching algorithms: nearest-neighbor matching, caliper matching, radius matching
and kernel matching. The nearest neighbour matching method assigns a weight equal to one,
𝑊 𝑖,𝑗 =1, and takes each transfer recipient in turn and identifies the non-recipient with the
closest propensity score. The nearest neighbor method will be implemented with
replacement, so that a non-recipient can be used more than once as a match. A variant of the
nearest neighbour matching is calliper matching. The calliper matching method chooses the
nearest neighbour within a calliper of width 𝛿, so that 𝑗: 𝑃 𝑋! −𝑃 𝑋! <𝛿 where 𝑃(𝑋)
is the propensity score. Therefore calliper matching imposes a form of quality control on the
match by setting a tolerance level on the maximum propensity score distance. Dehejia and
matching. In radius matching the idea is to use not only the nearest neighbour within each
calliper but all of the comparison members (non-participants) within the calliper. The final
matching algorithm that will be used in the study is referred to as kernel matching. Kernel
matching uses all the non-participants for each participant in the matching process. The
kernel is a function that weights the contribution of each non-participant, so that more
importance is attached to those non-participants providing a better match. The Gaussian and
the Epanechnikov will be used as weighting functions with kernel matching.
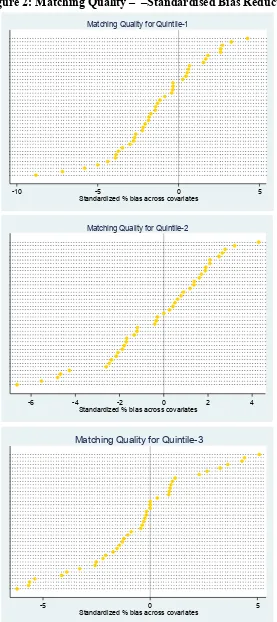
The final step in propensity score matching is to assess the matching quality. Three measures
will be used to judge the performance of the match: standardised bias and the t-Test. The
standardised bias for each covariate as suggested by Rosenbaum and Rubin (1985) is defined
as the percentage of the square root of the average sample variances in both groups, and is
expressed as:
𝑆𝐵!"#$%" =100∙ 𝑋!−𝑋!
0.5∙(𝑉
! 𝑋 +𝑉! 𝑋 )
𝑆𝐵!"#$%" = 100∙ 𝑋!!−𝑋!! 0.5∙(𝑉
!! 𝑋 +𝑉!! 𝑋 )
Where 𝑋!(𝑉
!) is the mean (variance) in the treatment group before matching and 𝑋!(𝑉!) the
analogue for the comparison group. 𝑋!!(𝑉
!!) and 𝑋!!(𝑉!!) are the corresponding values
for the matched samples.
For all child-level educational expenditure analysis, we use children of the age of 6 to 18
years. We only consider children who regularly participate in the labour market as child
workers. It is assumed that these children supply labour to either earn a living for themselves or to
supplement household incomes. Children engaged in housekeeping activities and performing household
chores – such as cleaning, cooking, or washing – are thus not regarded to be child labour in this study.
Being consistent with other previous studies on child labour and in accordance with the law, children
aged less than fifteen years who participate in the labour market will be considered as supplying labour.
Since all work related questions were asked only for individuals above the age of ten years, our
sub-sample for child labour supply will be for all children between the ages of ten to 14 years. The treatment
variable for children receiving any educational assistance will be a binary variable (yes=1 and no=0)
6. Empirical Results
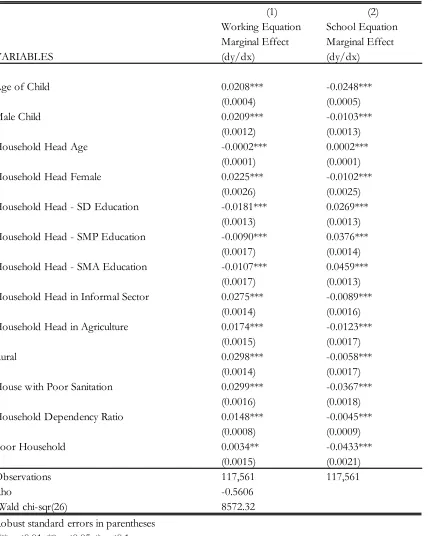
Table 4 gives the estimated results from the bivariate Probit regressions. The first column of
estimates gives the parameters that affect the work decision, whereas the second gives the
estimates of the parameters that affect the schooling decision. The correlation coefficient-𝜌,
is significantly negative in the estimations. This means that there is a negative relationship
between attending school and working. This could imply that there are some unidentified
factors that increase the probability of attending school and at the same time decrease the
probability of working. Schooling and child labour are thus activities that children, or their
parents, have to choose between.
According to Table 4, the probability of working increases with the child’s age. The age variable
captures the effect of the absolutevalue of the labour of a child of a given age. Thus this could be
interpreted as an indication of the fact that the accumulated human capital (in case of children)
increases potential wages and therefore the probability of working. Virtually all empirical work on
child labour has indicated that the age and gender of the child are important determinants of their
educational and work activities. Being a male child increases the probability of a child being
involved in labour activities, which is also evident from Table 4.
We assumed that parents’ ages would also have an impact on child activities. According to
Table 4, the higher the household head’s age, the higher the educational attainment of the
child and the lower the likelihood for the child to work. Younger parents are likely to be at a
more financially constrained point in their life and may have less capacity to cover school
expenses, thus having a greater need for their children’s labour. There is ample empirical
evidence in the literature that the education level of the parent decreases the probability of
their children working and increases the probability of schooling. Parental education can
potentially influence the allocation of children’s time, mainly through income and
preferences.
Since both market work and household work are common in developing countries, we use
proxies to capture both these types of activities. We use household’s heads in agriculture to
capture market work, since usually most children work close to home, so that it is local
the demand for domestic work by using housing facilities, such as poor access to water and
sanitation conditions. The absence of such services might substantially increase the domestic
burden workload for children without, or without directly, affecting the decision to send a
child to school, once the wealth of the household has been controlled for. Our findings
indicate that children in agricultural households have a higher probability of working and less
likelihood of attending school. Similarly, children living in houses with poor sanitation are
also more likely to work and less likely to attend school.
The nature of the household head’s occupation also matters: if the parents are unemployed or
employed irregularly, a child’s labour may be considered as a substitute for their labour or
hired labour, thus decreasing the chances of that child attending school. Furthermore, a
father’s employment in the informal sector, as opposed to the formal one, raises the
probability that the child will also work in the informal sector. Being consistent with this
expectation, our results show that when the household head works in the informal sector, the
probability of children to supply labour is also higher.
Subsequently, we examine the effects of household composition on children’s work and
schooling via the household dependency ratio. Our findings indicate that children are more
likely to engage in work and not attend school in households with high dependency ratios.
The probability of children working was also found to be higher in rural areas than in urban
areas, which is a global and general characteristic of child labour. Table 4 also confirms the
Basu and Vans (1998) luxury axiom that poverty drives child labour. Usually, the joint
probability of working and not going to school drops sharply with household wealth.
Children in poor households were found to have a higher probability of working and a lower
likelihood of attending school. This result is generally consistent with theoretical literature,
which mentions poverty as one of the main factors explaining child labour.
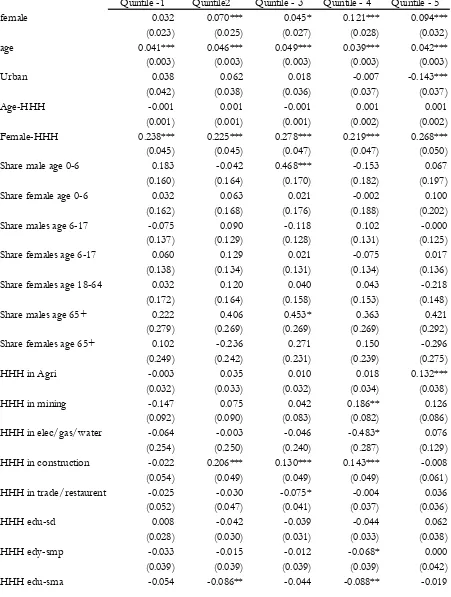
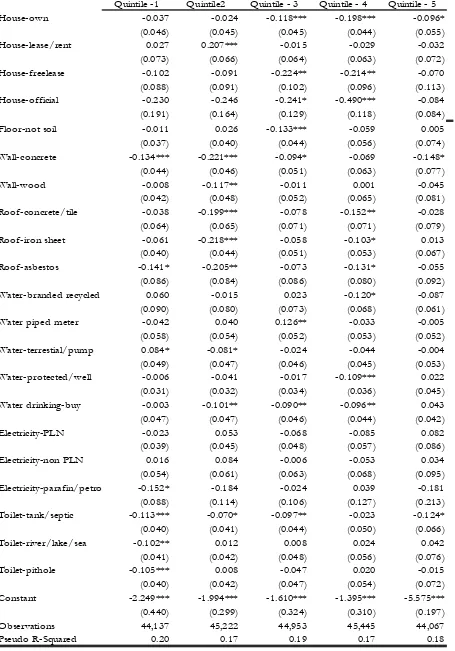
Table 5. Binary Propensity Score Model, Pr(D=1|X=x)=Φ(X’β) presents the results for the
individual samples of analysis stratified by expenditure quintiles: bottom 20th percentile, 20th
-40th percentile, 40th-60th percentile, 60th-80th percentile, top 20th percentile. Estimates are for
the Probit regression where the binary outcome takes a value one if the child is receiving any
type of an educational transfer or assistantship. The results are generally unsurprising and
reveal a number of significant covariates of programme participation. It is important to note
that the standard regression based method and propensity score matching differs significantly
matching the primary interest is in covariates (not good predictors) and thus including
variables even when they are poor predictors. Analytic results and simulations of Rubin and
Thomas (1996) suggests that variables with weak predictive ability for outcomes can still
help minimise bias in estimating casual effects with propensity score matching. In essence,
the main purpose of the propensity score estimation is not to predict selection into treatment
but to balance covariates and get closer to the observationally identical non-participant.
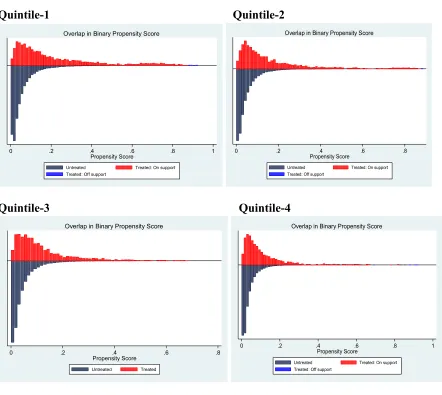
Next, the common support region was examined by plotting a histogram of the propensity
score. The common support is the region where the propensity score has a positive density for
both treated and non-treated units. Figures 1 gives the frequency distribution of the
propensity scores based on Table 5. Binary Propensity Score Model, Pr(D=1|X=x)=Φ(X’β)
for the children receiving (treated) and not receiving (untreated) any educational
assistantship. All other histograms reveal that there is a substantial region of overlap, and that
a severe common support problem does not exist. It is evident from Figure 1. Overlap and
Distribution of Propensity Scores that any combination of characteristics observed in the
treatment groups can be observed among the control groups among all estimated quintiles. In
all quintiles, the probability mass in the treated group is located to the same side of that of the
non-treated group. Since the main purpose is not on the Probit probability estimations but to
match households, it is encouraging to see that a large fraction of households from both
groups (treated and untreated) gets an estimated probability in the same range. The upshot of
Figure 1. Overlap and Distribution of Propensity Scores is that there is sufficient common
support that provides strong evidence for causal inference.
Results on covariate balancing are presented in the Appendix. Each cell reports the average
standardised bias of the different covariates after matching. It is evident that the differences
between the households in the treated and untreated groups are quite small after matching,
and that matching has removed any bias that had existed for almost all covariates. A t-test of
equality of means in the two samples of participants and nonparticipants indicates that there
is no systematic pattern of significant differences between the covariates in the treatment and
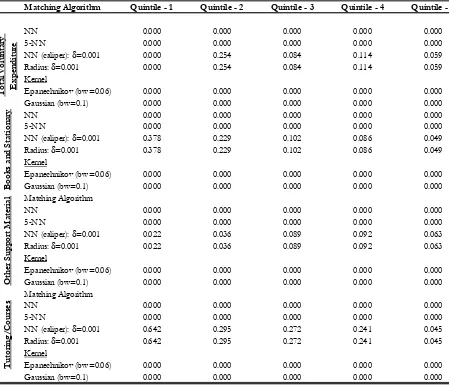
non-treated groups after conditioning on the propensity score. The exact number of
individuals lost due to common support requirement is also negligible in Table 6. Individuals
lost due to common support requirement (%).
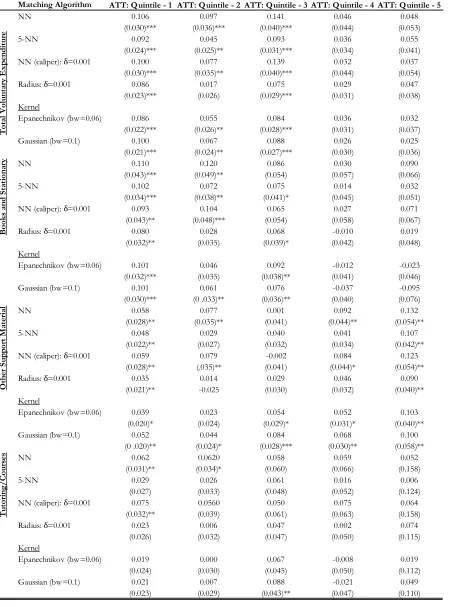
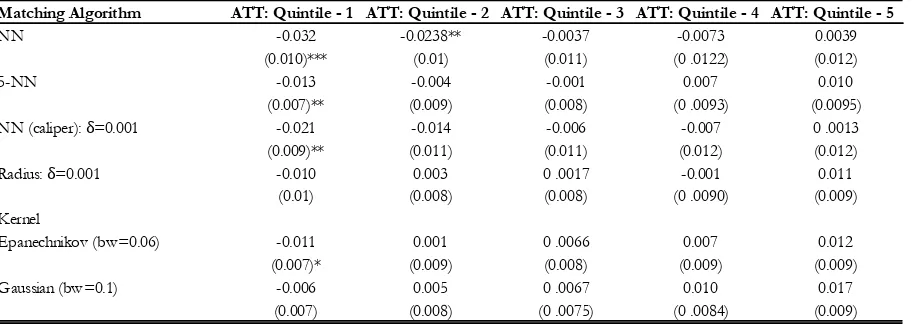
Table 7. Binary Treatment Effects of Educational Assistance on Child Education Spending
obtained via propensity score matching, using four matching algorithms and imposing the
‘minima and maxima’ common support. The results for the mean impact indicate that
receiving educational transfers and assistance significantly increases education spending for
the bottom three quintiles, though the magnitude varies by matching method.
For all quintile groups, children receiving educational assistance or transfers spend more at
the margin on education than what they would have spent without any educational support.
For example, Table 7. Binary Treatment Effects of Educational Assistance on Child
Education Spending shows that children receiving educational assistance spend between 10%
and 14% more at the margin on voluntary educational goods. In other words, when
controlling for the level of expenditure, households receiving educational assistance and
transfers spend more of their additional increments to expenditure on education.
These large marginal increases in ‘child-specific’ education spending arising from
educational transfers and scholarships thus confirm the existence of an intra-household
fly-paper-effect. However, these gains are not visible for the children in the 80th-100th percentile,
implying that even if children in the richest quintile actually received some additional
educational support, their households’ voluntary educational spending for them would not
increase.
Thus, a careful selection of only the poor and vulnerable households becomes a vital
component in the design and success of any educational support programme. The poorest and
vulnerable children should be given special priority in selection, and need to be regularly
assessed to maintain the focus on the poor and low-income programme participants.
Table 8 presents the results of the impact of educational transfers, scholarships and assistance
on the probability of children to work. The estimates represent the marginal effects of a child
receiving educational assistance on the probability of being in the labour force. It is evident
from the results that the education cash transfers and assistance given to children were large
enough to reduce the amount of time spent working, especially among the poor. For instance,
receiving education transfers and assistance reduces the probability of children working in the
poorest households by one to three percentage points. The results again confirm that benefits
are heavily skewed to the poor - the two lowest quintiles of the participating children receive
the largest share of education assistance benefits.
The additional financial support from education transfers and assistance seem to reduce the
activities. Our results are consistent with previous research, which has shown that transfer
programmes rolled out to reduce child labour and increase schooling and homework time are
all changes which may improve educational achievement (Maluccio, 2009; Skoufias ad
Parker, 2001). We also find no significant impact of transfers on voluntary educational
spending for the children in the upper part of the welfare distribution. These results are not
surprising, as the transfers and assistance were too small of an incentive to have any positive
effects on school enrolment for students at the upper part of the welfare distribution.
7. Conclusion and Policy Implications
This paper has used a large, nationally representative household survey from Indonesia to
analyse how the receipt of educational transfers, scholarships and related assistance affects
the child labour supply and households' spending behaviour on children’s education and
related goods and services.
Several key findings emerged from the study. We found strong evidence of a reduction in the
labour supply of children at the bottom of the welfare distribution (lowest 20 percent) due to
Indonesia’s education cash transfers and related assistance. Households receiving educational
transfers, scholarships and assistance were also found to spend more at the margin on
voluntary educational goods. At the mean, households receiving educational transfers,
scholarships and assistance spend 10% to 14% more on their children’s voluntary educational
goods at the margin than what they would have without any additional educational support.
These large marginal increases in education spending at the child-level arising from
educational transfers and scholarships thus confirm the existence of an intra-household
fly-paper-effect. Educational transfers, scholarships and assistance have been associated with
increased voluntary educational spending on the child receiving such support, with little
re-allocation taking place within the household, providing strong evidence of benefits sticking to
children. If education transfers and assistance are viewed as transitory and uncertain stream
of income and support, then our findings are consistent with the permanent income
hypothesis, which generally finds that the marginal propensity to invest the transitory income
(transfers, subsidies, remittances, etc.) is higher than that for permanent income, such as
salaries (Paxson,1992).
Thus it becomes evident that a well-targeted and administered educational assistance
programme that lowers the price of schooling can be successful in inducing children to spend
less time on work, especially among the poor. Since the benefits of education transfers and
support programmes are mostly concentrated among the poor and vulnerable, it is important
to identify and select only the poor and vulnerable households for any targeted education
support intervention. Our results are particularly relevant in the context of understanding the
role of cash transfers and educational assistance in middle-income countries, where school
enrolment rates are already at satisfactory levels, but the challenge is to keep the students in
invest in education among transfer- and assistance- receiving households in Indonesia will
undoubtedly be beneficial in augmenting human capital in the country.
In summary, our findings suggest that educational transfers, scholarships and assistance are
successful in increasing household investments in education as well as in reducing children’s
labour supply by providing an incentive to forgo the labour income. Our results suggest that
transfer schemes in Indonesia could be further improved and redesigned to increase the
children’s educational spending and time spent in school. For example, larger transfers,
incentives for school completion and payments that vary with the geographic remoteness of
the household could be considered to improve BSM. A special emphasis could be given to
rural areas, and a condition could be set that the children in the households receiving the
educational transfers must attend school and are not allowed to work at all. Improving the
schools themselves could probably also reduce children’s labour supply and encourage them
to spend more time in school. Improved targeting, combined with the expansion of
programme’s coverage and sharper geographical targeting, and an increasing in the real value
of the transfer, are thus the most plausible policies that can enhance the impact of transfers on
children’s educational achievements.
The findings of this study lend support to the growing view in the literature that educational
transfers, scholarships and related assistance can actually have a positive impact on economic
development by increasing the level of investment in human capital. The principle message
that emerges from the study is that there are quantitatively non-negligible average gains from
educational transfers and support programmes on household education spending and child
References
Aromolaran, Adebayo B. (2004). “Intrahousehold Redistribution of Income and Calorie
Consumption in South-Western Nigeria,” Economic Growth Center Discussion Paper # 890,
Yale University.
Arze del Granado, F., W. Fengler, et al. (2007). "Investing in Indonesia's education:
allocation, equity, and efficiency of public expenditures." World Bank Policy Research
Working Paper(4329).
Banerjee, Abhijit. 2003. “Educational Policy and the Economics of the Family.”
Massachusetts Institute of Technology.
Becker, G. S. (1974). A Theory of Social Interactions. Journal of Political Economy, 82, 1063-1094.
Becker, G. S. (1981). A Treatise on the Family. Cambridge, Mass.: Harvard University Press.
Behrman, J and Hoddinott. J, 2005. “Program evaluation with unobserved heterogeneity and
selective implementation: The Mexican Progresa impact on child nutrition”, Oxford Bulletin of Economics and Statistics, 67: 547-569.
Bourguignon, François, Francisco Ferreira, and Philippe Leite. 2003. “Conditional Cash
Transfers, Schooling and Child Labor: Micro-Simulating Brazil’s Bolsa Escola Program”.
World Bank Economic Review 17(2):229-254.
Case, Anne, Victoria Hosegood, and Frances Lund, (2005), “The reach and impact of Child
Support Grants: Evidence from KwaZulu-Natal,” Development Southern Africa, 22467-482.
Cain, Mead T., (1977), “The Economic Activities of Children in a Village in Bangladesh,”
Cain, M. and A. Mozumder, (1980). "Labor Markets Structure, Child Employment and
Reproductive Behavior in Rural South Asia," Working Paper 89. Geneva: International Labor
Office.
Cardoso, E.; Souza, A.P. (2003). The impact of income transfers on child labor and school
attendance in Brazil. São Paulo: USP. http://www.econ.fea.usp.br/elianacardoso/
ECONBRAS/cardoso-souza.pdf.
Cameron, L. (2009). “Can a public scholarship program successfully reduce school drop-outs
in a time of economic crisis? Evidence from Indonesia”. Economics of Education Review, v.
28, issue. 3, pp. 308-17.
Cigno, A. and F. C. Rosati (2005). The Economics of Child Labour, Oxford University Press.
Das, J. (2004) “Equity in Educational Expenditures: Can Government Subsidies Help?”
World Bank Working paper series-3249.
Duflo, Esther. (2003). “Grandmother and Granddaughters: Old Age Pension and
Intra-Household Allocation in South Africa,” World Bank Economic Review, 17(1): 1-25.
ECLAC (2006), “Shaping the Future of Social Protection: Access, Financing and Solidarity”, (LC/G.2294(SES.31/3)), Santiago, Chile, United Nations publication.
Edmonds, E. (2007), “Child Labor”, in T. P. Schultz and J. Strauss, eds., Handbook of
Development Economics, Volume 4 (ElsevierScience, Amsterdam, North-Holland)
Edmonds, Eric V. (2006), “Child Labor and Schooling Responses to Anticipated Income in
South Africa,” Journal of Development Economics, 81386-414.
Edmonds, Eric V., and Norbert Schady (2009), “Poverty Alleviation and Child Labor,”
NBER Working Paper 15345. National Bureau of Economic Research, Cambridge, MA.
Galor, Oded and Joseph Zeira (1993), “Income Distribution and Macroeconomics.” Review
of Economic Studies (60) 1: 93—124.
Grootaert, Christiann and Harry Anthony Patrinos (1998), “Policies to Reduce Child Labor”,
in C. Grootaert and H.A. Patrinos (eds) The Policy Analysis of Child Labor: A Comparative
Study, London: St Martin’s Press.
Grootaert, Christian and R. Kanbur (1995), "Child Labor: An Economic Perspective,"
International Labor Review, 134, pp.187-203.
Hardjono, Joan (2004), The Integration of Poverty Considerations into the Nine-year Basic
Education Program in Bali and West Nusa Tenggara. Unpublished report for the Asian
Development Bank, Manila
Islam, M. and J. Hoddinott (2009), “Evidence of Intra-Household Flypaper Effects from a
Nutrition
Intervention in rural Guatemala.” Economic Development and Cultural Change 57(2): 215- 38.
Jacoby, Hanan G., and Emmanuel Skoufias (1997), “Risk, Financial Markets, and Human
Capital in a Developing Country”, Review of Economic Studies, Vol.64, pp. 311-335.
Jacoby, H. (2002). Is There an Intrahousehold "Flypaper Effect"? Evidence from a School
Feeding Programme. The Economic Journal, 112(January), 196-221.
Jones, Gavin. (2003) “Pengamatan Cepat SMERU tentang Permasalahan Pendidikan dan
Program JPS, Beasiswa, dan DBO di Empat Provinsi” [SMERU Rapid Assessment on
Education Problems and Social Safety Net, Scholarship, and Operational Subsidy Programs
in Four Provinces]. Jakarta: SMERU Research Institute.
Khilji, Nasir and Ernest Zampelli (1994), “The Fungibility of U.S. Military and Nonmilitary