Abstract—Under the existing regulation in Constitution Number 22 Year 2001 (UU No 22 Tahun 2001), Production Sharing Contract (PSC) continues to be the scenario in conducting oil and gas upstream mining activities as the previous regulation (UU No. 8 Tahun 1971). Because of the high costs and risks in upstream mining activities, the contractors are dominated by foreign companies, meanwhile National Oil Company (NOC) doesn’t act much. The domination of foreign contractor companies also warned Indonesia in several issues addressing to energy independence and energy security. Therefore, to achieve the goals of energy which is independence and security, there need to be a revision in upstream oil activities regulating scenario. The scenarios will be comparing the current scenario, which is PSC, with the “full concession” scenario for National Oil Company (NOC) in managing oil upstream mining activities. Both scenario will be modelled using System Dynamics methodology and assessed furthermore using financial valuation method of income approach. Under the 2 scenarios, the author will compare which scenario is better for upstream oil management in reaching the goals mentioned before and more profitable in financial aspect. From the simulation, it is gathered that concession scenario offers better option than PSC in reaching energy independence and energy security.
Keywords—Upstream Oil Management, Energy Independence, Energy Security, System Dynamics Methodology, and Financial Valuation.
I. INTRODUCTION
HE domination of oil, coal, and gas happened in Asia – Pacific region, including Indonesia, which still mainly rely on those resources. Oil dominates the usage of energy in Indonesia for around 32%, followed by coal for 23% and natural gas for 13% in 2014. Industrial sectors dominated the energy usage for 48%, followed by transportation sectors for 35%, household sectors for 11%, commercial sectors 4% and other sectors 2%.
All the energy needs are projected to be rising for the years ahead due to the growth of Indonesian Gross Domestic Product (GDP) which is composed by the energy user sectors. With the basic scenario that there will be 6% increase in GDP per year since 2014, energy needs will increase for 5.8 times in 2050. The needs of oil will increase up to 40.7% in 2050 due to the high usage especially in transportation sector. Meanwhile, the needs of natural gas will only increase up to 13.8% in 2050. The certain increase in energy needs, especially oil and gas, unfortunately not followed by Indonesia’s ability in fully
supplying both oil and gas. Indonesia has been facing the supply deficit.
Since 2008, Indonesia could only produce oil and gas for 977 thousand oil barrels/day and continues to decline until 786 thousand oil barrels/day in 2015 [1]. Indonesia’s oil production declined for 3.9% annually since 2009. To fulfill the oil demand, Indonesia had to import both oil both in crude and refined forms, from several countries. In 2013, Indonesia imported 355.61 million barrels of crude oil, 237.41 million barrels refined oil, and 41.11 million barrels of gas. Indonesia, which became the 30th country with great oil reserves, even imported oil from South Korea and Taiwan which became the 94th country with great oil reserves [2]. With the increase in oil and gas demand, as the consequences, the amount of oil and gas import also increases from 122 million barrels in 2014 to 1.235 million barrels in 2050 [3]. Indonesia has turned to the net importer of oil and gas since 2004, even Indonesia used to be the net exporter of oil and became one of OPEC (Organization of Petroleum Exporter Countries) members.
The decrease in oil production caused by various factors. The upstream oil and gas mining activities is still concentrated on revitalizing the mature oil fields. Mature oil fields have no longer produce oil economically, even there’s optimization effort on those fields using the water injection or Enhanced Oil Recovery (EOR). The most contributing factor is the lack of exploration activities of new oil and gas reserve in Indonesia. The new fact that 60% Indonesia’s potential oil reserves located in Indonesian offshore deep-water and requires an advanced technology with high investment costs also caused the low rate of oil exploration and furthermore other upstream mining activities.
Since 1971, the upstream oil and gas mining activities are regulated by Constitution Number 8 Year 1971 (UU No 8 Tahun 1971) using Production Sharing Contract (PSC) scheme. Indonesian government act as the owner of all oil fields in Indonesia. National Oil Company (NOC) own the oil fields but doesn’t do the upstream mining activities. The upstream mining activities are done by the contractors who signed the contract (Kontrak Kerja Sama/KKS) with SKK Migas as the regulator of oil and gas mining activities in Indonesia. Under the KKS, the ownership of oil fields held by Indonesian government from the beginning until the end of upstream mining activities. The production could only occur when the oil fields are proven economically-produced by the government. After production, there will be result sharing between the contractor and the
Valuating Indonesian Upstream Oil
Management Scenario through System
Dynamics Modelling
Fariza Aulia Putri dan I Ketut Gunarta
Departemen Teknik Industri, Fakultas Teknologi Industri, Institut Teknologi Sepuluh Nopember (ITS)
: [email protected]
government with specified percentage as stated in KKS. The KKS contractor must provide the whole initial investment costs for upstream mining activities but there is cost recovery scheme that will reimburse the “costs of oil” after the fields produce economically. When the fields can’t produce economically, or even the exploration fails, the risks of loss will be owned by the contractors. Under the existing regulation in Constitution Number 22 Year 2001 (UU No 22 Tahun 2001), PSC continues to be the scheme in conducting oil and gas upstream mining activities. Because of the high costs and risks in upstream mining activities, the contractors are dominated by foreign companies, meanwhile NOC doesn’t act much. The domination of foreign contractor companies also warned Indonesia in several issues addressing to energy independence, energy security, and energy equality.
Therefore, to achieve the goals of energy which is independence and security, there need to be a revision in upstream oil activities regulating scheme. The scenarios will be comparing the current scheme, which is PSC, with the “full concession” scenario for state-owned oil company in managing oil upstream mining activities. Both scenario will be modelled using System Dynamics methodology and assessed furthermore using financial valuation method of income approach.
System dynamics has been known as the systemic thinking discipline in system science. This methodology was firstly introduced by Jay Forrester from Massachusetts Institute of Technology (MIT) in 1963 and has been improved continuously. In its development, system dynamics has been used for analyzing and solving social, economic, managerial, political, and environmental issues which is complex, dynamic (fast-changing), and uncertain. System dynamics is important in studying system, offering comprehensive and integrated thinking which can simplify complexity without losing the essential object and also suitable in analyzing mechanisms, pattern, and system tendency based on analysis of system’s complex, dynamic, and uncertain structure and behavior.
Value means the sum of economic benefits expected in the future by the owner, where each benefit is discounted to the present value with the adequate discount rate [4]. Financial valuation method is used in this research to measure the value that will be got be the company before implementing the concession and after implementing the concession scenario.
Using the System Dynamics methodology and financial valuation, the author will compare which scenario is better for oil and gas management in reaching the goals mentioned before and more profitable in financial aspect. The chosen scenario will furthermore be the recommendation for the regulator in oil and gas management in Indonesia.
II. THEORETICALFRAMEWORK
A. Oil and Gas Management
Oil and gas management in Indonesia have existed for more than 130 years, started since the first discovery of oil in North Sumatra in 1885 during Dutch colonialism era that makes the management of oil and gas industry done by Dutch companies. Since then Indonesia has been running various management model to accommodate oil and gas production and consumption for all Indonesian people. The history of oil and gas
remanagement is divided into 3 eras those are colonialism era, post-Independence era, and modern industrial era.
After the independence of Indonesia August 17th , 1945 the government release several constitutions about oil and gas. The first constitution “UU No. 40 Tahun 1960” about oil and gas mining, was not only the previous concession system but also holding the sovereignty of oil and gas resources but also stating that the oil, gas and mineral located in Indonesian legal mining area are national wealth managed by country and Oil and gas mining only undertaken by country and only conducted by national company. In order to support the constitution the government established three national companies named Permina, Pertamin, and Permigas. Besides doing oil and gas mining activity, those companies also supervise the foreign oil companies operation. As the adjustment to new regulation became tough, Pan – American Oil made a deal with the government in 1962 with the terms and condition more compatible with UU No. 40 Tahun 1960. This accord furthermore became the model for the three foreign oil companies in doing operational changes in Indonesia. Caltex, Stanvac, and Shell signed the accord in September 1963, named “Kontrak Karya”, and became the new oil and gas management concept in Indonesia. As the foreign companies no longer holding the status as concession holder, the management is still held by them. In the implementation of this contract, there’s almost no significant changes as the government role only limited to supervision and the foreign companies still doing operation as the previous system (concession). After G30S/PKI occurred in Indonesia in 1965, new regime ruled in Indonesia and led by Soeharto, changing the previous regime that was ruled by Soekarno. Permina then ruled by Dr. Ibnu Sutowo who criticized Kontrak Karya and stating that Kontrak Karya has no difference with concession. The system then continued to change to other system.
1 and verse 2. The PSC development is divided into 3 phases as shown in table 1.
B. Indonesia’s Oil and Gas Reserves
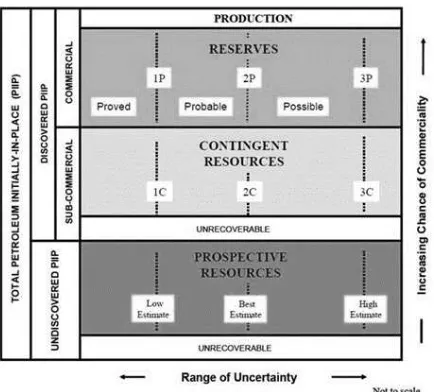
Oil and gas industrial activities have produced various vocabularies related to reserves. Collaboration of several oil and gas institutions in the world (SPE, AAGP, WPC, SPEE, and SEG) releases oil and gas resource management system called Petroleum Resources Management System (PRMS) with the latest edition released in November, 2011. PRMS is the integrated system for basic classification and categorization of petroleum reserves and resources. PRMS divided each project to 3 main classes called Reserves (satisfied commerciality), Contingent Resources (satisfied sub-commerciality), and Prospective Resources (undiscovered). The illustration of PRMS is provided in figure 1. To fulfill the commerciality terms, the amount of project reserves can be estimated. Based on this classification, reserves are classified into 3 kinds, those are proved (1P), probable (2P), and possible or potential (3P). Where the uncertainty ranges from low estimation (1C), best estimation (2C), and highest estimation (3C).
Indonesian potential oil reserves have been decreasing slightly each year from 2010 to 2015. While the proven oil
Figure 1. Reserve and Resource Classification Framework in PRMS 2011.
reserves declined gradually since 2010 to 2015. This phenomenon caused the almost stable total oil reserves from 2010 to 2015.
Oil and gas are needed as the energy that fueled many sectors in our life. In 2010, Indonesian oil consumption was 1402
thousand barrels/day and it exceeds the production ability which was only 1003 thousand barrels/day (British Petroleum, 2016). Oil consumption, instead of align with the production capacity, raised gradually since 2010. In 2011, oil consumption raised to 1589 thousand barrels/day until 1676 thousand barrels/day in 2014. The condition turned when in 2015, oil consumption decreased slightly to 1628 thousand barrels/day.
Despite the rising demand of oil, the oil production showed conversely performance. Oil production has never exceeded oil consumption since 2010, which was only 1003 thousand barrels/day. Oil production continued to decrease until it reached 852 thousand barrels/day in 2014 with the decease rate of 5% per year [3]. Production raised slightly to 876 thousand barrels/day in 2015, yet it still couldn’t fulfill the oil demand in 2015.
For several years coming, the demand of oil and gas are projected to increase. The demand of oil will increase 3 times compared to 2014 [3]. Meanwhile, oil production is projected to decrease continuously until 52 million barrels in 2050.
As the consequence of declining production and demand of oil and gas, the government allowed importing oil and gas. Amount of oil import is projected to increase to 933 million barrels in 2050 (basic scenario) and 1,235 million barrels (high scenario).
C. System Dynamics Modelling
System dynamics has been known as the systemic thinking discipline in system science. This methodology was firstly introduced by Jay Forrester from Massachusetts Institute of Technology (MIT) in 1963 and has been improved continuously. System dynamics was used limitedly as industrial problem solving tool in its early emergence. In its development, system dynamics has been used for analyzing and solving social, economic, managerial, political, and environmental issues which is complex, dynamic (fast-changing), and uncertain.
There are 3 common perspectives in analyzing system, those are black box system (input-output analysis and econometrics), grey box system (operation research), and white box system (soft-system methodology, viable system, hyper-game, and system dynamics). System dynamic offers comprehensive and integrated thinking which can simplify complexity without losing the essential object and also suitable in analyzing mechanisms, pattern, and system tendency based on analysis of system’s complex, dynamic, and uncertain structure and behavior. Studying system comprehensively doesn’t mean that there’s no boundary between the system and environment. Non-Table 1.
Comparison of PSC Generations
PSC First Gen PSC Second Gen PSC Third Gen
First Tranche Petroleum None None 20%
Cost Recovery Ceiling 40% 100% (no ceiling) 80% (due to FTP)
Investment Credit 20% 17% to 20%
DMO DMO was defined as 25% of
equity oil at 0.2$/barrel
25% of equity oil, full price for the first 60 months and 0.2 $/barrel there
after
25% of equity oil, full price for the first 60 months and 10% of export
price there after Equity to be Split
Government : Contractor 65%:35% 85%:15% 85%:15%
significantly influential variables will be the boundary in system analysis and causing the closed system.
A system which has causal loops can’t be analyzed partially and this causes system dynamics better than partial analysis in analyzing system that has causal loops. Causal loop diagram illustrates the causal relationships between elements using inter-related arrows so it creates causal loop where the beginning of arrow means the cause and the end of arrow means the effect. Causal loop diagram is constructed with many elements involved in it. Therefore, before simulating the system, causal loop diagram is often used as the conceptual mapping of the system to simplify complexity. Causal loop diagram must be made as real as it could be to illustrate the nature of the studied system.
To understand the behavior of system, this research conducts using a model instead of doing trial-and-error research. Model is the representation of system in the real world by emphasizing the main elements of the system. Building a model could be cheaper and time-saving rather than doing trial-and-error study in the real system. Model can be made in conceptual form and simulation form. Conceptual model is a non-software specific description of the simulation model that is to be developed, describing the objectives, inputs, outputs, content, assumptions and simplifications of the model. Meanwhile, simulation model can be made through system dynamics software, such as Vensim, Powersim, and Stella (iSee System). Stella (iSee System) could build the simulation model visually using computer and could see the behavior of system quickly. Simulation conducted through procedures as follows: (1) Defining objective, scope and requirements (2) Collect and analyze system data (3) Build the model (4) Validate the Model (5) Conduct experiment (6) Result
Model verification is the process to determine whether the simulation model correctly reflects the conceptual model. Testing is conducted to verify whether the simulation results absolutely predictable outcomes based on test data. Simulation models often generate slightly different result depending on configuration and input data. Verification is the process of debugging the model, seeking for the bug-free model.
Meanwhile model validation is the process of establishing confidence in the soundness and usefulness of a model [5]. Verification and validation must be conducted simultaneously throughout the model development process [5]. Several testing methods are required for validating the simulation model, including the usage of statistical testing techniques. Some of the testing methods by Forrester and Senge (1980) are as follows:
1. Structure-Verification Testing
Model structure testing is conducted to find out whether the structure of the model is suitable with the real system by the people who understand the concept of the modelled system.
2. Parameter-Verification Testing
Parameter testing can be done by comparing model parameters to knowledge of the real system to determine if parameters correspond conceptually and numerically to real life.
3. Boundary-Adequacy Testing
Boundary-adequacy is conducted by developing a convincing hypothesis relating proposed model structure to a particular issue addressed by the model.
4. Sensitivity Testing
Sensitivity testing aims to find which variable most affective to the main purpose of the research and check whether rational shifts in model parameter can cause a model to fail the previously passed behavior test. 5. Extreme Conditions Testing
The structure of system dynamics model should permit extreme combinations of levels in the system being represented. To conduct extreme conditions testing, the evaluator must examine each rate equation in a model, trace it back through any auxiliary equations to the level on which the rate depends, and consider the implications of imaginary maximum and minimum values of each state variable and combinations of state variables to determine the rational of the resulting rate equation
D. Financial Valuation
From the financial aspect, value means the sum of economic benefits expected in the future by the owner, where each benefit is discounted to the present value with the adequate discount rate [4]. Value of a company (Market Value of Invested Capital/MVIC) is the capital market value which is the sum of liability value and equity value where equity value comes from the book value of equity plus the market added value. American Society of Appraisers divided valuation to 3 approaches, those are market approach, asset-based approach, and income approach.
Market approach is conducted based on relative valuation where the value of business interest defined as the market value of similar business interests which is compatible and proportional. There are 3 methods in market approach valuation, those are guideline publicly traded company method, guideline merger and acquisition method and prior transaction, and offers and buy-sell agreement method.
The next approach in valuation is asset-based approach. Asset-based principle’s valuation is based on accounting principle where the value of business interests defined as same as the costs incurred to gather that business interests at the time valuation happened and the equity value defined as same as the net company value of basic adjusted value. There are 2 methods in asset-based approach valuation, those are adjusted net asset method and excess earning method.
Income approach is conducted based on anticipation principle where business interest defined as the sum of economic benefits generated by that business interest in the future. Company value is estimated by quantifying income flow generated by investments and converted to present value by opportunity cost of capital. Income approach is divided into Discounted Cash Flow (DCF) method and Capitalization method. Income approach is used in this research.
1. Discounted Cash Flow Method
investment in the future. The basic formula used in DCF is
Economic benefit meaning can be various depending on the valuation object and purpose of valuation. Generally, economic benefits are dividends, net profit, Earnings Before Interests and Taxes (EBIT), Earnings Before Interests Taxes Depreciation and Amortization (EBITDA), Net Income After Tax (NIAT), and net cash flow to equity. Net cash flow to equity’s formula is shown below.
𝑁𝐶𝐹𝑒 = 𝑁𝐼𝐴𝑇 + 𝑁𝐶𝐶 − 𝐶𝐴𝑃𝐸𝑋 − 𝑁𝐶𝑊𝐶 + 𝑁𝐶𝐿𝑇𝐷 (2)
where NIAT = Net Income After Tax
NCC = Non-Cash Charges (Depreciation, Amortization, and Retained Tax)
CAPEX = Capital Expenditures
NCWC = Changes in Net Working Capital NCLTD = Net Changes in Long-Term Debt
Discount rate defined as the return percentage to convert the amount of money that is expected in the future to present value. Discount rate can be in the form of Minimum Attractive Rate of Return (MARR) or Weighted Average Cost of Capital (WACC).
2. Direct Capitalization Method
In direct capitalization method, capitalization rate is more comprehensive method where the capitalization rate only changes one single income flow to present value.
III. RESEARCHMETHODOLOGY
This chapter contains the methodology that is used in conducting the research in form of flowchart and also the explanation of methodology flowchart.
A. Data Collection and Processing Phase
Data collection is done parallelly with literature study. All data which is related to the research, such as oil and gas reserves, oil and gas consumption, and also oil and gas production are collected for supporting the research. In this phase, dynamic hypothesis is conducted to conceptually modelling the system using Causal Loop Diagram to map the problem and understanding the relation between stakeholders. Furthermore, the alternative scenarios for oil and gas management in Indonesia must be determined as comparison for the system improvement..
B. System Modelling Phase
The Causal Loop Diagram (CLD) that has been made in previous phase can’t be simulated directly to produce the result. CLD elements must be transformed into stock, rate, and converter to convert the CLD into Stock and Flow Diagram. STELLA is one of the system dynamics modelling software.
Stock and Flow Diagram furthermore needs to be simulated to gain the result.
C. Model Testing
Simulation model must be credible in order to represent the real system correctly. Every model used in simulation must be verified and validated to test the credibility of the model. Verification is the process to check whether the operational logic of the model compatible with the logic in flow diagram. Meanwhile validation is the process to determine whether the model is the accurate representation of the real world. Validation is done through 5 methods, those are model structure testing, boundary sufficiency testing, model parameter testing, mean comparison testing, and extreme condition testing.
D. Scenario Development and Financial Valuation
After verifying and validating the simulation model, as the improvement of the system, the better resulted scenario must be developed. Scenario will be developed through financial valuation that will assess the value of each scenario in achieving the goals of energy independence, energy security, and energy equity.
IV. RESULTS
This chapter contains the simulation results for both before concession scenario and after concession scenario.
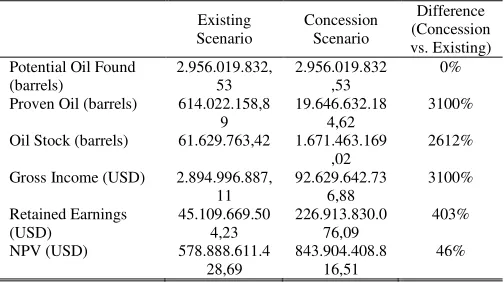
Table 2.
Simulation Result of Existing Scenario and Concession Scenario
Existing
Oil Stock (barrels) 61.629.763,42 1.671.463.169 ,02
After the simulation of both scenario, it can be interpreted that the concession scenario offers better option for upstream oil management in Indonesia because it resulted in the distinctive difference to achieve the goal of energy independence and energy security. Concession scenario will also strengthen the value of NOC to help NOC in doing upstream oil mining activity such as investment for finding new oil reserves.
V. CONCLUSIONS
The conclusions of this final project are as follows:
existing scenario which is 614.022.158,89 barrels. When NOC is given more priority to manage oil fields, the more reserves and stock that NOC will handle and the more independent NOC is.
2. The acquisition of oil field will also help NOC in securing the amount of oil available in the market (oil stock). Before the concession scenario occurs, the amount of oil stock is 61.629.763,42 barrels. After implementing concession, the amount of oil stock will turn into 1.671.463.169,02 barrels. The higher amount of oil fields managed by NOC will lead to higher amount of production that will result in the higher amount of oil stock.
3. Under the valuation method, the existing scenario has the value of US$ 578.888.611.428,6. Concession
scenario offers the higher value which is US$ 775.492.486.128,98. With 34% difference of value amount between two scenarios, concession scenario offers higher value for NOC (where NOC represents the government).
REFERENCES
[1] SKK Migas, 2015. Annual Report 2015. Jakarta: s.n.
[2] Indirasardjana, P., 2014. Minyak untuk Presiden. Jakarta: PT Gramedia
[3] BPPT, 2015. Indonesia Energy Outlook 2016, Jakarta: Center for Technology of Energy Resources and Chemical Industry BPPT. [4] Prawoto, A., 2004. Penilaian Usaha. Jogjakarta: BPFE Jogjakarta. [5] Richardson, G. P., 2016. Model Validation Outlined by Forrester