BUILDING THE INDEX OF RESILIENCE FOR ISLAMIC BANKING IN
INDONESIA: A PRELIMINARY RESEARCH
Fanny Arumsari1
Dimas Bagus Wiranatakusuma2 Abu Umar Faruq Ahmad3
Abstract
The 2007-2008 global financial crises had brought severe financial instability in financial institutions, and since then it became more complex and irreparable. Therefore, it has become inevitable to examine various tools that can monitor resilience of these financial institutions, especially the banking system that plays significant role in economic development of a country. Although Islamic banking operates in the same financial environment, its distinguishing features and fundamental differences demand different treatment in building resilience. The scope of existing literature of banking surveillance tools is either to some extent, mostly limited to banking sector in general, or it is dominated by partial developments. Hence, there is a significant gap that lies in the literature to address the specificity of Islamic and conventional banking surveillance tools analysis to build resilience that can contribute to reduce the span of financial instability in a country. This study seeks to explore to fill in this gap in Indonesian jurisdiction. The study finds that optimum resilience level of Shari`ah banking in Indonesia exists in specific range as a result of the contribution that is made by each and every indicator. The study also attempts to find a way to trace some indicators that could effectively contribute to prevent the instability of Shari`ah compliant banking system in Indonesia.
Keywords: Shari`ah banking, resilience, index, Islamic banking, Indonesia
1 Researher at International Program for Islamic Economics and Finance, Department of
Economics, Faculty of Economic and Business, Universitas Muhammadiyah Yogyakarta. Corresponding Author: [email protected]
2 Lecturer at International Program for Islamic Economics and Finance, Department of
Economics, Faculty of Economic and Business, Universitas Muhammadiyah Yogyakarta. Corresponding Co-Author: [email protected]
3 Associate Professor at Institute of Policy Studies, Universiti Brunei Darrussalam, email:
I. INTRODUCTION
As a Divine religion and being a complete code of life, Islam has special and unique characteristics while it is not only all-inclusive but also universal. All-inclusive means the Islamic Shari`ah combines all aspects of human life, and as such it discusses all matters pertaining to both rituals (`ibadat) and social behaviors or civil transactions (mu`amalat). The tenets of universal Islamic Shari`ah can be applied in any time and and place until the Day of Judgment. This universality is similarly applicable in the fields of mu`amalat. Besides, being broad and flexible, the principles and practices of mu`amalat do not discriminate between Muslims and Muslims, and as such in terms of mu`amalat, non-Muslims obligations are considered Muslims’ obligation and vice versa.
Islamic economic system is a part of Muslims’ life in an effort to implement the teachings of Islam in economic activities. According to Yuliadi (2007), this system is an important aspect of an integral and comprehensive Islamic system to create a better human life. Alignment and balance between the horizontal and vertical aspects can guarantee the human’s lives and the universe to walk in harmony and continuous prosperity in this world and the hereafter. By applying the system one may automatically fit unanswerable questions in economy as well as in human life.
The absence of Shari`ah managemnet and its application in economic system might have indirect links with the financial crisis in the Asian financial crisis of 1997-1998. Perhaps, it is because the riba or interest based commercial dealings caused money creation, while, gharar or uncertainty and excessive risks, or maysir or gambling and games of chance in secondary were ineviTable, which resulted in bringing the financial crisis. It happened as Asian financial crisis of 1997-1998 spent extraordinary cost to countries for bailing out banks as much as 55% of gross domestic products (GDP).4 Albeit, this does not include the cost to depositors and borrowers of wider interest rate spreads from bad loan of balance sheets that can push down economic growth of countries involved.
Given that, the demand for financial stability and a sound and resilient economic environment have been increased, , and are becoming an interesting phenomena in both developing as well as developed countries. The only alternative solution remains is to test the robustness of Islamic economics and finance that are based on the rules and tenets of Shari`ah.
In order for finding solutions to these issues, several international forums that have been devoted to provide crisis prevention namely, the World Bank, and International Monetary Fund (IMF) came forward by introducing The Financial Sector Assessment Program (FSAP) in 1999 in the wake of the Asian financial crisis. The program brings together Bank and Fund expertise to help countries reduce the
likelihood and severity of financial sector crises.t Other international forums that have been instrumental to solve the crisis were the Basel Committee on Banking and Supervision (BCBS), Islamic Financial Services Board (IFSB), Financial Stability Board (FSB), the International Association of Insurance Supervisors (IAIS), and International Accounting Standard Board. Generally, the aim of these forums is to assess regularly the strength and weaknesses of financial systems to enhance financial stability.
The study undertaken by the authors from Indonesian jurisdiction on the relevant area shows that this country is classified as bank backed asset where more than 70% of the assets in financial institutions dominated by banking. (figure 1.2) According to Basurto & Padilla (2006), a robust and good financial system is a key for macroeconomic stability in terms of supporting, savings and efficiency in allocating resources and investment opportunities. Hence, it is important to conduct surveilance as a prior step to catch up financial system stability. According to Bank Indonesia, the resilience of financial system can be defined through several conditions, as described as follows: (i) when financial system is able to allocate resources and to absorb shock occurs, which can prevent surprises in the real sector, (ii) when financial system is still capable of running intermediation function, execute payments and redistribute risk properly if there is an interference with the economy, and (iii) when price decision, allocation of funds and the risk management in financial system are running well and supporting economic growth.
existence of both banks individually and the entire system is a requirement for sustainable economic growth.
Islamic finance, with the banking system part and parcel of it, is one of the fastest growing segments of the global financial industry. In some countries, it has become systematically important, while in many others, it is hard to be ignored. Though, Islamic finance encompasses banking, insurance, leasing, investment funds, micro finance, Sukuk (Islamic securities) and equity and so on Their assets mainly generate from banking and Sukuk sectors. These two sectors of Islamic finance represent about 95% of the total global Islamic finance assets. It is estimated that the size of Islamic banking industry at global level was nearly $882 billion as at the end of 2014 with average growth rate of 14% per year during 2010-2014.5 This is about two to three times faster than the rate at which conventional bank grew over the same period, due in part to the global financial crisis.
Despite these developments of Islamic banking industry, it is worthy of note that although the structured literature that mainly focused on micro prudential surveillance there is a dire need of comprehensive discussion on resilience-based supervision. Generally, surveillance authorities apply either macro prudential or generic surveillance framework procedure for both institutions offering Islamic financial services (IIFS) and conventional banks. One of well-known tools in this regard is capital, asset quality, management, earnings, liquidity and. Capital-Management-Earnings-liquidity-sensitivity (CAMELS) rating system, which is generally appropriate, but still less adapted to the specific risks by Islamic banks (IBs) and IIFS, particularly regarding Shari`ah compliance, capital adequacy, asset quality, and liquidity. Moreover, the present literature covers partial Islamic banking (IB) soundness variables, by using non performing financing (NPF), capital adequacy r atio (CAR), return on asset (ROA) to gain understanding about IB resilience. Gunadi (2013) provided comprehensive understanding about banking resilience even financial system stability by using financial system stability index (FSSI). However, the discussion has been centered toward assessing the banking resilience and stability rather than specific for IIFS and micro prudential perspectives.
Islamic banking has some distinguishing features that made it unique and different from its conventional counterparts in several ways. Conventional banks’ (CBs) intermediation is largely debt-based with pre-specified interest rate and
allows for risk transfer, while IIFS and IB’s intermediation is asset-based and centers on risk sharing (Mejía, 2014). In running sale and lease contracts, IIFS must have underlying assets. It makes IIFS more resilient during the global financial crisis compare to its conventional counterparts.
A recent theoretical study carried out by Farahani, Guzardi et al., 2012) found positive and significant relationship between Islamic banking development and economic growth. While the expansion of IBs is expected to support growth, it still stances challenges in terms of competition, size, standardisation, regulation, and cost structure. Standardisation and regulation of IBs is one of potential challenges to be explored, as it can make effective surveillance and give directions for authorities as well as institutions themselves to promote stability and resilience that can contribute to economic growth. Moreover, the urge for tools for IBs to do supervision and surveillance is categorised as strategic issue in the developments of IBs and IIFS in Indonesia.6
In recent developments, composite indicators (CIs) that compare country performance are increasingly recognised as a useful tool in policy analysis and public communications. According to Bandura, (2006) the number of CIs in existence around the world is growing year after year in academic circles, the media and among policymakers. He cites more than 160 composite indicators that provide simple illustration of complex and sometimes elusive issues in wide-ranging fields, e.g., environment, economy, society or technological development. This can be used not only in macro level, but also in micro level, such as bank. It is quite rare for IB having tool such as internal composite Index compare to CB.
According to the description above, this study attempts to fill the gap in term of the lack of comprehensive tools for IB to enhance resilience. Analyzing Islamic banking resilience supervision in Indonesia is interesting effort, as this country is the biggest Muslim population in the world and has complete periodical economic situation. This economic situation refers to normal, recession, and crisis in the last two decades.
Hence, this studyis going to provide tools as a surveillance the resilience of IB in Indonesia. The study uses a constructed index to supervise resilience of Islamic banking in Indonesia. The data used are high-frequency data (monthly data) that reflect the behaviour of the financial institutions, particularly IB. This study has adapted the specific characteristics of Shari`ah banking intermediation, which is
asset based and centers on risk sharing. Methodology used is normalisation of indices pre-and post-year by comparing current related variables of idyosyncratic risk in banking with pre-and post-year. The proportion of every index forming financial institutions assumed to be equal.
The study contains several sections, which are as follows: Section 1 provides the background and introduction to the study. Section 2 covers literature review of composite indicators (CI) formation any indicator related to stability of financial institutions. Section 3 explains the data selected, steps for constructing SHABAR index, as well as construction model of SHABAR Company index. While section 4 analyses the results of SHABAR index formation. It also discusses the implications and key issues in building IB’ resilience sensitivity analysis of each indicator on the index, as well as future index projection. Section 5 concludes and offers a way forward for SHABAR index studies followed by appendices.
The scope of the study has some limitations to the extent that it analyses the problems that focused on (i) all IBs7 listed in website of Bank Indonesia after the enactment of Islamic Banking Act No. 21 of 2008(hereiafter ‘The Act’, (ii) The data spans from January 2010 to December 2016, monthly time series data, (iii) indicators used to build Shari`ah banking resilience (SHABAR) index based on trinity of financial system stability from Bank Indonesia, (iv) indices constructing resilience are related to idiosyncratic risk of Shari`ah banking (micro level)
1. To reflect to research problems to be solved in this study, the overall quest of the research questions can be formulated as follows: How to construct an index for monitoring the resilience of Islamic banking in Indonesia? 2. To what extent was the resilience of Islamic banking in Indonesia?
3. How does each indicator of the index contribute to the resilience of Islamic banking in Indonesia?
II. METHODOLOGY
2.1Research Variable and Data Type
Shari`ah Banking Resilience (SHABAR) Index is arranged based on the trinity of financial system stability by using 11 indicators classified into 3 major categories, namely Islamic Banking Institution Pressure Index, Islamic Banking Institution Intermediary Index, and Islamic Banking Institutions; Efficiency Index.
Variables reflecting degree of pressure from IBs and IIFs are NPF, CAR, ROA, and delta liquidity (∆L). Variables reflecting Islamic banking intermediation are the spread financing margin to DPK margin (SFTD), Gap financing to deposi ratio (Gap FDR), financing to GDP ratio (F/GDP), and gap gross domestic product (Gap GDP). Variables reflecting Islamic banking efficiency are net operating margin (NOM), operational efficiency ratio (OER) or BOPO ratios, cost to income ratio (CIR), and overhead cost (OHC to total operating revenue.
Data used in this study are secondary monthly time series data, starting from January 2010 until December 2016. The usage of monthly data based on technical statistics consideration is related to degree of freedom problem and limitation of publication, while the selection time period from 2010 until 2016 is based on the period after being issued the Act. This regulation practice has certainly undergone evolutionary episodes of juridical legal base not only for the growth and development of Shari`ah banking, but also for possibile developments of introducing Islamic windows or subsidiaries by conventional interest-based banks in Indonesia. It was assumed that 1 year is effective period of socialisation of regulation, where another 1 year is to build up complete economic situation in Indonesia (normal-recession-crisis) which is expected to make this study applicable for such future situation.
2.2Data Collecting Method and Sources
A documentary review (documentary research method) was used in collecting relevant information in this study on the subject . Payne and Payne (2004) describe the documentary method as the techniques used to categorise, investigate, interpret and identify the limitations. According to Bailey (1994), documentary research method refers to the analysis of documents that contain information about the phenomenon the researchers wish to study.
2.3Data Analysis Model and Hypothesis Testing
The study used indexing method with standardisation normalisation basic year approach to analyse SHABAR index. The purpose of using this method is to achieve the key research objectives and find possible answers to the existing problem formulation. Also, because this method normalises the outliers in data series, paves the way for making adjustments in scale, facilitates the transformation and aggregation of abnormal data. Another key reason for using this method is that it enables to illustrate complex and sometimes elusive issues in wide range of fields, especially in banking system.
Step 1: Developing a Theoretical Framework
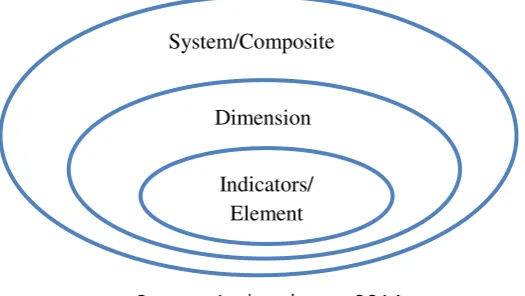
1) Complex Adaptive System Theory
Complexity results from the inter-relationship, inter-action and inter-connectivity of indicators within and between a system as well as its environment. Many natural systems (e.g., brains, immune systems, ecologies, societies included politic and economic) and increasingly, many artificial systems (such as parallel and distributed computing systems, artificial intelligence systems, artificial neural networks, evolutionary programs) are characterised by apparently complex behaviours that emerge as a result of often nonlinear spatio-temporal interactions among a large number of component systems at different levels of organisation. These systems have recently become known as Complex Adaptive Systems (CAS).8
Banking system as part of economy face same characteristics of complex behawviour from nonlinear interactions among a large number of indicators at different levels that emerge from the whole system of even economy and a country. Constructing the resilience of Shari`ah banking can be done by feasible monitoring process of every indicator in the banking system itself, so that every movement can be measured and advanced with a quick and precise decision.
Indicators/ Element Dimension s
System/Composite
Source: Authors’ own, 2014 Figure 2.1
2) Financial Cycle Phase Theory
In the financial cycle, the build up phase is the stage of source formation interference. In this phase, market participants tend to take advantage of conditions in order to achieve the greatest profits even though the stringent prudential rules may apply. This phase has been illustrated in the upward or upswing cycle segment (Figure 3.1). Under these conditions, systemic risk measurement needs to be focused on measurements of financial system imbalance, and measurements against stress indicators that show signs of the fact that the financial cycle are approaching to its peak, which is interpreted as already excessive risk-taking behaviour.
The last phase is the systemic event phase or also called ss materialized shock. Thise phase is related to the financial crisis.
The results of the data were collected in the past showed that the crisis generally occurs around 2 years after the peak of the financial cycle. Thus, systemic event is a very short period in the propagation phase due to the fact that shock and vulnerability occur and resulted in establishing systemic risk. After the systemic event occurs, the downswing segment formed can be U-shaped or V-shaped. If it is U-shaped, downswing will last deeper and longer in the cycle finance, and will be accompanied by a long recovery period. This condition has the potential to have structural impacts on downswing. If it is V-shaped, downswing will take place in a shorter period and the recovery will also take place faster. In the financial cycle, systemic events just cannot happen because in the downswing segment market participants are in a position to automatically adjust its portfolio to reduce potential losses. It depends on the resilience of the elements of the financial system.
3) Defining Resilience and Signal Crisis
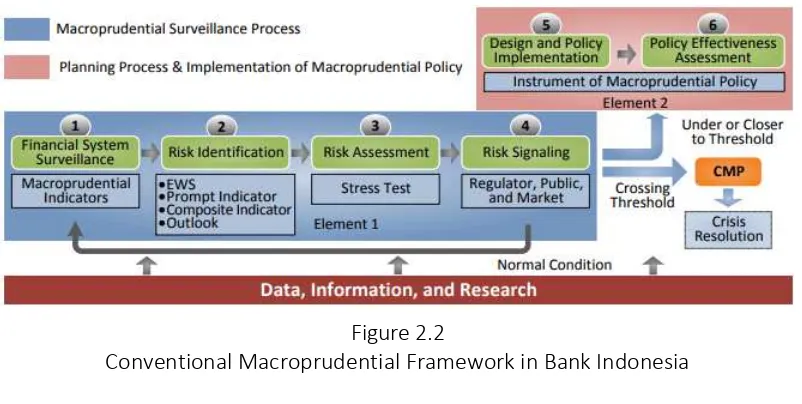
To determine the level of resilience of Shari`ah banking in Indonesia, the first step is to understand the flows of macroprudential framework in Indonesia in order to identify the risk embodied in the financial system, which potentially leads to create systemic system, realising how to deal with risksspread, through which channels the risks are spread out, and the precise momentum to release the particular instrument of macroprudential policy so the potential risks can be prevented and spread accross financial system, macroeconomic, and real sector (Ascarya et al., 2016).
Figure 2.2
The study specifies to construct such index to monitor the financial system until risk signaling, which are the first four steps in conducting macroprudential surveillance process. Macroprudential policy appears in the critical points when crossing below or above the tolerated thresholds. Based on figure 3.3 it happens in fist step of financial system surveillance.
After determining the area of banking resilience, the next step is to determine the definition of resilience itself. This definition is made to focus the study’s initial objectives and facilitate the identification as to whether the value of the index SHABAR exceeds its threshold or not. If the variable crosses the threshold, a signal is emitted, and as such it will determine whether the composite of Shari`ah banking is in a position of resilience or not. The definition of resilience is as follows:
The signal is constructed to be a binary variable where . If the variable crosses the threshold, a signal is emitted . Mathematically, it can be described,
{ } {| | | |} (4)
Meanwhile, if the indicator remains within its threshold boundary, it behaves normally and does not issue a signal, so .
{ } {| | | |} (5)
In terms of defining crisis, the research borrows the SHABAR is as follows:
{ } { } (6)
{ } { } (7)
Where:
: Signal variable relating indicator xt in t-period
: Value of indicator xt in t-period
: Threshold of the indicator
̅ : Standard deviation of of xt in 2011
In addition, in taking a conclusive remark, it is important to notice the directional sign9 may vary depending on whether the indicators (leading indicators) at resilience level questions above are expressed in absolute terms. After that, it needs to obtain a binary time series of signal or no-signal observations.
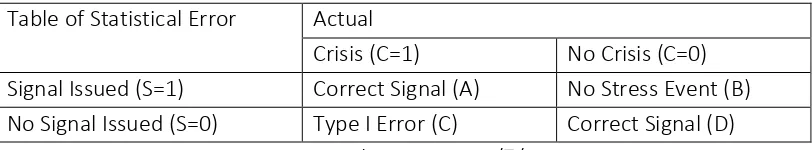
Interpreting crisis and signal framework once the crisis and signal are defined, the evaluation criteria can be conducted by using matrix framework. Kaminsky, et Al.
(1998) developed matrix crisis-signal framework by using 12 months as signal window horizon, which is as follows:
Table 2.1
The Performance of Individual Indicator by Matrix Crisis-Signal Framework Table of Statistical Error Actual
Crisis (C=1) No Crisis (C=0) Signal Issued (S=1) Correct Signal (A) No Stress Event (B) No Signal Issued (S=0) Type I Error (C) Correct Signal (D)
Source: Ito, et al., 2014 in WP/7/2015 BI
In this matrix, A is the number of months in which the indicator issued a good signal, B is the number of months in which the indicator issued a bad signal or “noise”, C is the number of months in which the indicator failed to issue a signal (which would have been a good signal), and D is the number of months in which the indicator has refrained from issuing a signal (which would have been a bad signal). It would issue a signal in every month that is to be followed by a crisis (within the next n months, example 12 months), so that A > 0 and C = 0, and it would refrain from issuing a signal in every month that is not to be followed by a crisis (within the next n months, example 12 months), so that B = 0 and D > 0. For sure, none of the indicators fit the profile of a perfect indicator, but the matrix will be a useful reference to assess how close or how far is each indicator from that profile.
4) Determining Evaluation Criteria
This study employs six evaluation criteria in order to assess the performance of indicators which was identified through crisis-signal framework, as follows:
(1) The proportion of observations correctly called
, defined as the
proportion that all observations correctly bring information about crisis and not crisis. This implies that the higher proportion occurred will lead to best evaluation criteria.
(2) The noise-to-Signal-Ratio
, it measures the false signals as a ratio of the
good signals issued. The selection rule is to pick the variable or model that minimises the noise to signal ratio (NTS).
(3) The proportion of crises correctly called
, is defined as the proportion of
(4) The proportion of false alarm of total alarms issued
, given that, an
individual indicator exposes a frequent false signal. Thus, the lower of its proportion would be good to minimise the panic behavior in the markets.
(5) The proportion of crisis given an alarm issued
, given that, an individual
indicator generates different signals. This criterion is to select indicators that can maximise the probability of a crisis, given a signal was issued as alarm.
(6) The proportion of probability of crisis given no alarm issued
, given the
signal is important, an occurence of crisis without signals was extremely reduced or minimised.
5) Determining Signalling Horizon
The Study involves various signaling horizons to be chosen as the fit horizon that can predic the crisis. This signaling horizons are range of period that has ability for anticipating a crisis. Kaminsky (1997) used 24 month signaling horizon. He argued that the longer signaling horizon would enable policy makers to anticipate a crisis. Meanwhile, Bussiere and Fratzscher (2002) set 12 and 18 months as signal horizon. They argued that various time horizons would provide the best achievable trade-off between missing crises and wrong signal. In addition, this paper adds another 3 and 6 months as signaling horizons considering that a crisis is difficult to be predicted. Providing short horizon enables policy makers to react immediately as crisis starts to build up.
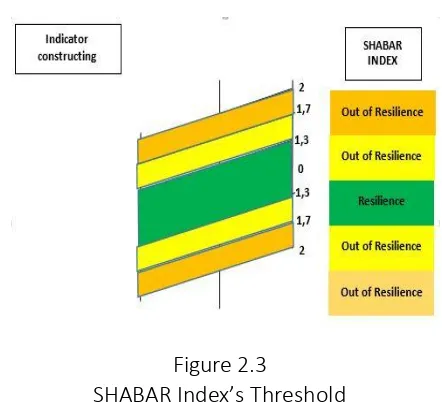
6) Determining Thresholds
Describing conditions on the indices that have been established thresholds required one (thresold) making it easier to determine the conditions and steps to be taken. Beginning the formulation by the reference of Bank Indonesia threshold, namely 2 standard deviations (SD), 1,7 SD, and 1,3 SD to construct SHABAR index threshold. Later, the all mentioned thresholds are used to determine the level of resilience in Islamic banking.
Figure 2.3
SHABAR Index’s Threshold
Step 2: Selecting Varibles (Research Variable and Operational Definition)
This study uses variables derived from all data of IIFS listed in Bank Indonesia. Operational definitions of each variable used in this study are as follows:
Statistical Normalisation approach
Shari`ah Banking Resilience (SHABAR) Index base year 2011 is used as forming the single index, dimension index, and the main index (SHABAR Index) sequentially. Methodology of calculation using the statistical approach normalisation base year 2011, was formed through the following calculation:
∑ ̅
̅
(8)
Where:
Qt : Composite Index (single, dimension, main) : Weight value of each variable
: Value of variable xt in t-period ̅ : Average variables of xt in 2011
̅ : Standard deviation of of xt in 2011
The period of 2011 base year as a benchmark for Shari`ha banking and financial system of Indonesia on the period experienced a complete regulation after enactment of The Act , which brought adequate regulation for expansion and operation of Islamic banks in a proper way.
Step 3: Imputation of Missing Data
system of Indonesia on the period experienced a complete regulation after the enactment of The Act which brought adequate regulation for expansion and operation of IBs in a proper way. This step can be skipped by the availability of adequate data.
Step 4: Normalisation of Data
Shari`ah banking resilience (SHABAR) index formed using the statistical
normalisation approach base year 2011, when banking performance is in the most
sTable level compare to the other years.10
Step 5: Weighting and Aggregation for Every Indicators
The result of normalisation of each indicator (single index) of Islamic banks will be merged into an index with a certain weight (dimension index). Weighting will be determined through variance of the standard deviation of the sample mean to put into strengths in the interpretation of SHABAR Index. The approach is expected to perform the synchronisation between the perceptions of security conditions for IBs and IFIs with the movement of the Index.
The calculation of the weighting method by using variance of the standard deviation can be described in the following formula:
√ (9)
Where:
: Mean of the variance (Weight index)
: Number of observations in the sample used
: Annually standard deviation of the mean of xt
: Standard deviation of xt
The use of positive and negative sign indicates the direction vector of each indicator against which SHABAR index was formed, the positive influence showed that the higher the pressure on the index and vice versa. Especially, for the index banking intermediation, a positive sign indicates an increase in intermediation and the negative sign indicates a decrease in intermediation.
Step 6: Accuracy Test
P = Forecasting R = Realisation T = Period
Meanwhile, the calibration of probability forecasting relates to the accuracy of probability forecasting and the observed relative frequency. Calibration compares the average probability forecast to the average of its realisation. Global Square Bias (GSB) values have ranges from 0 to 2 with score value = 0 reflecting perfect calibration. The formula is as follows:
̅ ̅ , (11)
where ̅ ∑ and
̅ ∑ (12)
Step 7: Back to the Details
Heat map is one of the best visualisation tools for dense point data. They are also useful for doing cluster analysis or hotspot analysis. In this study, heat map or chart indicators with color indication are used as manual to measure vulnerability level of the indicator. Heat map of SHABAR Index show the entire index results in terms of pressure, intermediation and banking efficiency.
III. RESULT AND DISCUSSION
3.1 Results SHABAR Index with Standardised Normalisation Approach
(17)
(18)
(19)
(20)
SHABAR Index formation, with a based year approach to statistical normalisation of monthly time series data from January 2010 to December 2016. This is modified by the availability of existing data. After determining the index normalisation method followed by the selection of indicators finally specific weight for each dimension forming SHABAR index is obtained. It is shown in formula (17) to (20) above.
3.2 Result of Accuration Test of SHABAR Index Composite Index
Table 3.1
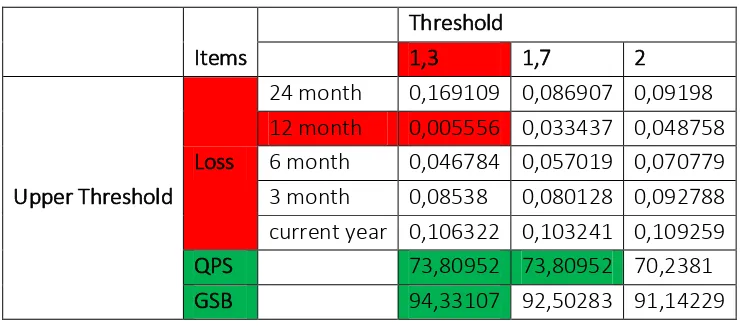
Test Accuration of SHABAR Index with Upper Treshold
Items
Threshold
1,3 1,7 2
Upper Threshold Loss
24 month 0,169109 0,086907 0,09198 12 month 0,005556 0,033437 0,048758 6 month 0,046784 0,057019 0,070779 3 month 0,08538 0,080128 0,092788 current year 0,106322 0,103241 0,109259
QPS 73,80952 73,80952 70,2381
GSB 94,33107 92,50283 91,14229
Dimension Index
Table 3.2
Test Accuration of SHABAR Index with Lower Treshold
Items
Threshold
1,3 1,7 2
Lower Threshold
Loss
24 month 0,077193 0,016667 0,016667
12 month 0,021131 0,019591 0,019591
6 month 0,02284 0,022121 0,022121
3 month 0,02284 0,022121 0,022121
current year 0,02284 0,022121 0,022121
QPS 88,09524 94,04762 94,04762
Table 3.3
QPS and GSB of Dimention Index
Table 4.1 and 4.2 explain the result of accuration test for SHABAR index with upper and lower threshold, the resuts are as follows:
a. The smallest loss value for upper threshold is 0,005556 which occurs at 12 months’ prediction months with threshold 1.3.
b. The smallest Lloss value for the lower threshold is 0.016667 which occurs on the 24 months’ prediction month with the threshold of 1.7 and 2
c. The smallest loss value for the threshold is 0,005556 which occurs at prediction month 12 months with threshold 1.3
d. The largest percentage of QPS for upper threshold is 73,80952 which occurs at threshold 1.3 and 1.7
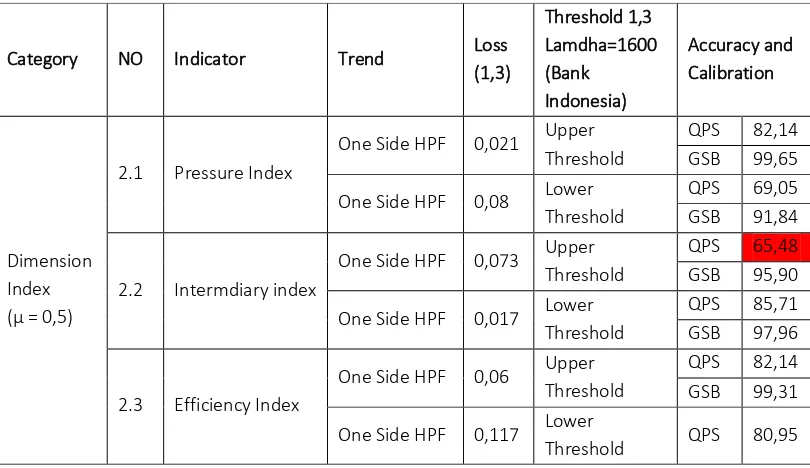
e. The largest percentage of QPS for the lower threshold of 94.04762 occurs at the threshold of 1.7 and 2 SHABAR index. The red colour shows the accuracy below the standard, while the others are in it track. Generally, all constucted dimentions’ index shows good accuracy performance of more than 66,67%. The dimension index that shows less accuracy performance is intermediary index which has QPS level only 65,48%.
GSB 95,9042
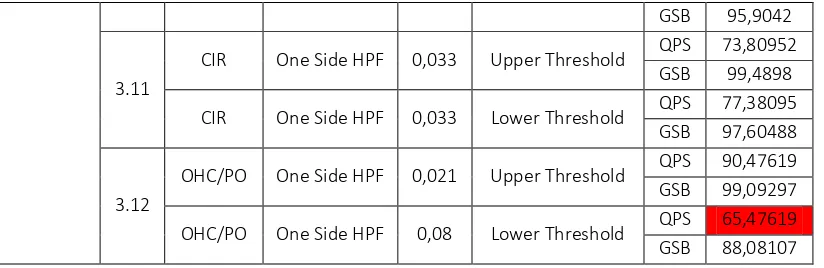
3.11
CIR One Side HPF 0,033 Upper Threshold QPS 73,80952
GSB 99,4898
CIR One Side HPF 0,033 Lower Threshold QPS 77,38095
GSB 97,60488
3.12
OHC/PO One Side HPF 0,021 Upper Threshold QPS 90,47619
GSB 99,09297
OHC/PO One Side HPF 0,08 Lower Threshold QPS 65,47619
GSB 88,08107
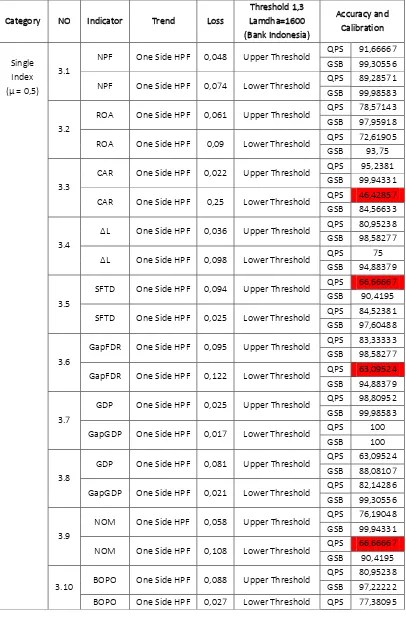
Table 3.4 shows the results of accuration test of every single index constructing SHABAR index. The red colour shows the accuracy below the standard, while the others are in it track. Generally, all indicators show good accuracy performance more than 66,67%. The single indices that show less accuracy performance are lower threshold of CAR, GapFDR, NOM, and OHC/PO, while the upper one is SFTD. CAR has QPS level only 46,43%, GapFDR has 63%, NOM has 66,67%, and OHC/PO has 65,48%. SFTD has only QPS level of 66,67%.
3.3 Resilience Level of SHABAR Index Composite Index
Table 3.5
Resilience Level of Composite Index(CI)
NO Indicator
Probability of Systemic Risk (C
& B)
Threshold (index) Resilience Level
1.1 SHABAR Index/CI 0,03 Upper 4,4 0,994
1.2 SHABAR Index/CI 0,07 Lower 3,2 0,979
Dimention Index
Table 3.6
Resilience Level of Dimension Index
NO Indicator
Probability of Systemic Risk (C &
B)
Threshold (index) Resilience Level
2.1 Pressure Index 0,07 Upper 0,1 0,979
Pressure Index 0,42 Lower 0,0 0,920
2.2 Intermdiary index 0,33 Upper 6,3 0,927
Intermdiary index 0,03 Lower 4,4 0,983
2.3 Efficiency Index 0,20 Upper -0,3 0,945
Efficiency Index 0,23 Lower -1,7 0,974
Table 4.6 shows the resilience level of dimension index constructing CI. Resilience level of pressure index exists in the range level of 0,920 to 0,979 with upper threshold 0,0 and lower threshold 0,1. Probability level of systemic risk occured 7% for upper threshold, while it is 43% for lower threshold of all crisis possibilities based on sample.
While resilience level of intermediary index exists in the range level of 0,927 to 0,983 with upper threshold 4,4 and lower threshold 6,3. Probability level of systemic risk occurred 33% for upper threshold and 3% for lower threshold of all crisis possibilities based on sample.
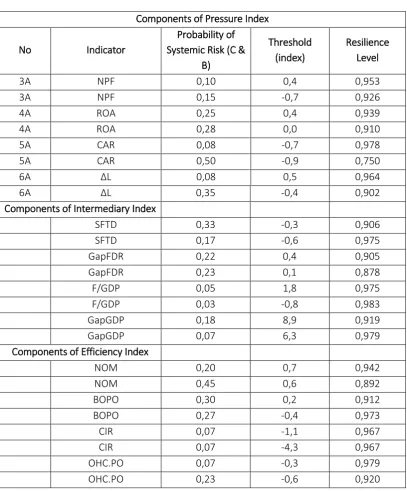
Resilience level of ROA exists in the range level of 0,910 to 0,939 with upper threshold 4,4 and lower threshold 6,3. Probability level of systemic risk occurred 25%-28% of all crisis possibilities based on sample. Resilience level of CAR exists in the range level of 0,950 to 0,978 with upper threshold 0 and lower threshold -0,7. Probability level of systemic risk occurred 8% -50% of all crisis possibilities based on sample. Resilience level of ∆L exist in the range level of 0,902 to 0,964 with upper threshold 0,5 and lower threshold -0,4. Probability level of systemic risk occurred 8-35%% of all crisis possibilities based on sample.
From intermediary side, resilience level of SFTD exists in the range level of 0,906 to 0,975 with upper threshold -0,6 and lower threshold -0,3. Probability level of systemic risk occurred 17-33%% of all crisis possibilities based on sample. Resilience level of GapFDR exists in the range level of 0,878 to 0,905 with upper threshold 0,4 and lower threshold 0,1. Probability level of systemic risk occurred 22% -23% of all crisis possibilities based on sample. Resilience level of F/GDP exists in the range level of 0,975 to 0,983 with upper threshold 1,8 and lower threshold 0,8. Probability level of systemic risk occurred 3% -5% of all crisis possibilities based on sample.Resilience level of GapGDP exists in the range level of 0,919 to 0,979 with upper threshold 8.9 and lower threshold 6,3. Probability level of systemic risk occurred 7-18%% of all crisis possibilities based on sample.
1. Threshold Single Index
Table 3.8
Upper and Lower Treshold of Indicators
Indicator Upper Threshold Lower Threshold
Th 1,3 Th 1,7 Th 3 Th 1,3 Th 1,7 Th 3
NPF 0,38 0,55 0,68 -0,71 -0,88 -1,00
ROA 0,38 0,44 0,48 0,04 -0,02 -0,06
CAR -0,67 -0,63 -0,61 -0,88 -0,92 -0,94
∆L 0,46 0,59 0,69 -0,41 -0,54 -0,64
SFTD -0,29 -0,24 -0,20 -0,62 -0,67 -0,71
Gap FDR 0,44 0,49 0,52 0,14 0,09 0,06
F/GDP 1,83 2,24 2,54 -0,81 -1,21 -1,52
Gap FDR 8,95 9,36 9,66 6,28 5,88 5,57
NOM 0,69 0,70 0,70 0,63 0,62 0,61
BOPO 0,19 0,28 0,35 -0,40 -0,49 -0,56
CIR -1,14 -0,66 -0,30 -4,25 -4,73 -5,09
OHC/PO -0,32 -0,27 -0,23 -0,65 -0,70 -0,74
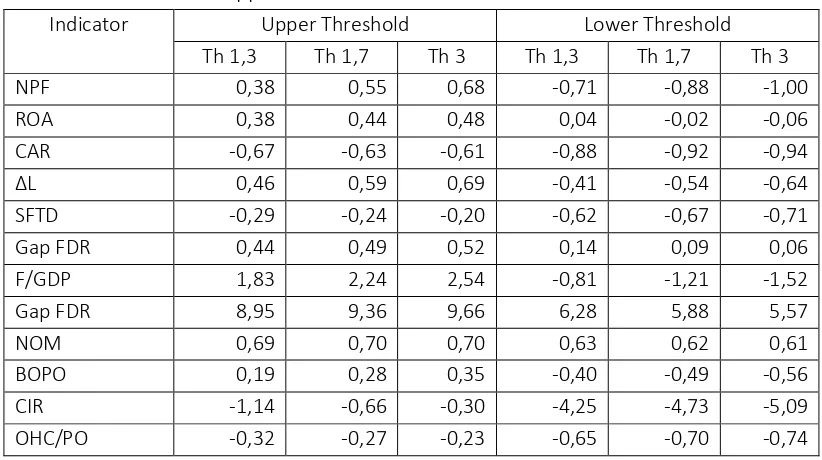
From the above, we can see the results of upper and lower threshold of every single indicator constructing SHABAR index. Threshold 1,3 used as a basis to determined resilience level because it is the most low threshold which contributed to the loss level in Shari`ah banking.
3.4Trace Back by Using Heat Map
One of the weaknesses in the indexation of the indicators is difficulty of tracing back to see the source of the pressure on the index. Heat maps are one of the best visualisation tools for dense point data. They are also useful for conducting cluster analysis or hotspot analysis. In this study, heat maps or chart indicators with colour indication serve as manual vulnerability level of the indicator. Heat maps of SHABAR index show the entire index results in terms of pressure, intermediation and banking efficiency.
treshold first and second treshold. The orange colour, the standby state, the indicator on this colour is at a value between.
Table 3.9
Heat Map SHABAR Index (January 2010-December 2016)
The above heat maps are presented based on the single, dimension, and composite index data that have been formulated in the previous section. These heat maps describe the condition of banking in Indonesia in 2010 after the enactment of The Act. Based on the above mentioned heat maps it appears that the trend of banking conditions in Indonesia is beyond the threshold limit of its ideal level of resilience. Based on business cycle theory, it happen if in the business implementation of Shari`ah banking is too excessive (above upper threshold) or too defensive whereas looking for a safe level (below ideal resistance level).
2011 heat maps explain it appears that the trend of banking conditions in
Indonesia has increased its resilience compared to previous year. Shari`ah banking stack in the ideal level of its resilience means it is not too excessive (above upper threshold) or too defensive (below ideal resistance level). Moreover. it is entering 3 years after enactment of the The Act. The socialisation and implementation of regulation seem to be showing positive results.
The average indicators show its resilience level near the end of 2011. CAR and BOPO were at their ideal resilience levels in November in the same year, while Gap FDR and OHC / PO was in October. NPF and F / GDP were at warning level in December. While ΔLiquidity was successively within its ideal resilience level in May and August. On the other hand, the NOM indicator was in the most frequently alert horizon in 2010 compared to the other variables in May, June, and October in the same year. Other yellow horizon indicators occurred in CIR and OHC / PO respectively in March and November. Pressure on bank was at its ideal level of resilience in October.
The contribution of each indicator to the resilience of Shari`ah banking in Indonesia appeared to spread evenly throughout 2011. The most isgnificant was the F/GDP indicator. which was almost at its ideal resilience level from April to December, 2011. followed by NPF and BOPO indicator that experienced 5 periods of resilience. The most minimal indicators contributing to banking resilience were CAR, ROA, and CIR. Even the GDP GDP did not show the resiliencenya level at all. The 2012 heat maps explain the single, dimension, and composite index data that have been formulated in the previous section. Based on the above heat maps it Main contribution emerged from intermediary dimension by its F/GDP indicator showed alert horizon and same with OHC/PO. While intermediary contributes to resilience of Shari`ah banks significantly, pressure dimension shows constant and the most frequently reach resilience level.
significantly contribute to SHABAR index throughout the year 2012. Generally, indicators contribute to SHABAR index existed in the beginning of 2012 from January to May.
The average indicators showed its resilience level near the end of 2013. Intermediary dimension showed its lack contribution throughout 2013.Contributions made by NPF, CAR, SFTD, NOM, BOPO mainly in the end of the year. While rest of the indicators that did not not have any green or even yellow area at all, that means those lack the conribution. When it comes to lower economic growth compared to its trend, it could impact to the banking system. Moreover, sharia banking performance seems play in save area looking at lack contribution of ROA to the SHABAR index.
The above heat maps are presented based on the single, dimension, and composite index data that have been formulated in the previous section. Based on the above heat map it appears that Shari`ah banking which had 2 times experiences of conditions in Indonesia was beyond the threshold limit of its ideal level of resilience. Based on business cycle theory it possible happen if in the business implementation of sharia banking is too excessive (above upper threshold) or too defensive whereas looking for a safe level (below ideal resistance level). For the following year, resilience level mostly existed in 2015
IV. CONCLUSION
Hence, there is a significant gap lies in the literature to address the specificities of Islamic and conventional banking surveillance tools analysis to build resilience that can contribute to financial stability in Indonesia. This study explores to fill in this gap in Indonesian jurisdiction.
The study finds that there are 8 steps to be taken in order for constructing Shari`ah banking resilience (SHABAR) index, namely, (1) theoretical framework, (2) data selection, (3) imputation of missing data, (4) normalisation, (5) weighing and aggregation, (6) robustness and sensitivity test, (7) back to the real data, (8) presentation and visualisation.
REFERENCE
Abubakar A., et al., 2015 “Kerangka dan Analisis Indikator Ketidakseimbangan Keuangan
dalam Nasional and Regional Balance Sheet (Version 1), Bank Indonesia
Abubakar A., Rieska I. A., Rini Oktaviani, 2016, “Pemilihan Early Warning Indicator untuk Mengidentifikasi Distress Sektor Korporasi: Upaya Penguatan Crisis Prevention, Bank Indonesia
Alawode, A. A., 2008, "What is Financial Stability", Financial Stability Paper Series Central Bank of Bahrain, March, pp. 16.
Antonio, M. S., 2001, Bank Syariah: Dari Teori ke Praktik, Second edition, Gema Insani, Jakarta.
Asfari, D. D., 2015, "Analisis Financial Stress Indicator Sebagai Alat Ukur Stabilitas Sektor Keuangan Indonesia", Bina Ekonomi, Vol. 19, pp. 18-21.
Ascaria, et al. 2016, "Conseptual Proposal for Future Macroprudential Framework Under a Dual Financial System in Indonesia", Springer International Publishing,
Switzerland.
Bank Indonesia, 2016, "Mitigasi Risiko Sistemik untuk Menjaga Stabilitas Sistem Keuangan dan Mendorong Intermediasi di Tengah Tantangan Global dan Domestik, Kajian Stabilitas Keuangan, March.
Bailey, K., 1994, Methods of Social Research, Fourth edition, The Free Press, New York. BIS, 2009, "Strengthening the Resilience of the Banking Sector", Consultative Document
BCBS, December.
Blaikie, N., 2003, Analyzing Quantitative Data, Sage Publication, London.
Chattha, J. A., 2015, Assessing the Stability and Resilience of Islamic Banks through Stress Testing under a Standardized Approach of the IFSB Capital Adequacy Framework. (A. O. Hatem A. El-Karanshawy, Ed.) Bloomsburry Qatar Foundation Journal,Vol. 5, pp. 4-5.
EY, 2016, World Islamic Banking Competitiveness Report 2016.
Farahani, Guzardi et al, 2012, Analysis of Islamic Bank’s Financing and Economic Growth : Case Study Iran and Indonesia, Journal of Economic Cooperation and Development, pp. 1-24.
Gunadi I., et al. 2012, "Pengembangan Bank Indonesia Indeks Stabilitas Keuangan (BISK)". Gunadi I., Aditya A. T., Cicilia A.H., 2013, "Indeks Stabilitas Sistem Keuangan (ISSK)
Pelaksanaan Surveilans Makroprudensial", Working Paper Bank Indonesia.
Harun, A. Cicilia, Sagita Rahmanira, R. Renanda Nathan, 2017, "Systemic Risk Measurement Framework", Article 1 FSR (Financial Stability Review) Bank Indonesia No. 27, September, Jakarta.
Holling C.S., "Resilience ad Stability of Ecological System". Annual Review of Ecological System, Vol. 4, pp. 1-23.
http://www.oecd.org
Imaniyati, N. S., 2010, Aspek-Aspek Hukum BMT, First Edition, PT Citra Aditya Bakti, Bandung.
Ismal, Rifky, 2011, The Indonesian Islamic Banking: Theory and Practices, Gramata Publishing, Jakarta.
Karim, A. A., 2008, Islamic Banking Fiqh and Financial Analysis. Third Edition, PT RajaGrafindo Persada, Jakarta.
Martin Čihák, H. H., 2008, "Islamic Banks and Financial Stability:An Empirical Study". IMF Working Paper. January.
Mejía, Alejandro López, et al., 2014, "Regulation and Supervision of Islamic Banks", IMF Working Paper, December, pp. 5.
OECD, 2005, Handbook on Constructing Composite Indicators: Methodology and User Guide, OECD Publishing. France.
Payne, G., Judy P., 2004, Key Concepts in Social Research. Sage Publication, London. Pimm, S., 1991, The Balance of Nature? Ecological Issues in the Concervation of Species
and Communities, University of Chicago Press, Chicago and London.
Rivai Veithzal, Rifki Ismal, 2013, Islamic Risk Management for Islamic Bank, First edition, PT Gramedia Pustaka Utama. Jakarta.
Republic of Indonesia, 2008, Act of The Republic of Indonesia Number 21 of 2008 Concerning Sharia (Islamic) Banking.
The World Bank, 2009, World Development Indicator, First edition, Green Press Initiative, Washington.
Triono, D. C., 2011, Ekonomi Islam Madzhab Hamfara, Second edition, Irtikaz, Yogyakarta. Walker, B. C., 2004, Resilience, Adaptability and Transformability in Social-Ecological
System. Ecology and Society. Vol. 9. September.
Wijoyo, N. A., 2015, Referensi Risiko Sistemik Perbankan, First edition, UI-Press, Jakarta. Yuliadi, Imamudin, 2007, Ekonomi Islam Filosofi, Teori dan Implementasi, Second Edition,