T
HEEFFECTOFDECENTRALIZATIONONTHEHEALTHSTATUSANDHEALTHCAREUTILIZATIONPATTERNS INI
NDONESIARobert Tilden1; Ascobat Gani1,2; Nur Nasry Noor1; RM. Widjajanto1 dan James Sonnemann1
1Team Technical Assistance Decentralized Health Project I 2Fakultas Kesehatan Masyarakat, Universitas Indonesia, Jakarta
ABSTRAK
Berbagai indikator pelayanan dan status kesehatan berdasakan tingkat pengeluaran konsumsi rumahtangga menurut quintile sebelum dan sesudah desentralisasi dinilai dan dikaji. Dilakukan juga penilaian perubahan status kesehatan pada periode desentralisasi, dan juga perbandingan antar wilayah yang menerima dan melaksanakan berbagai program pelayanan kesehatan atau wilayah yang tidak sama sekali mendapatkan inisiasi program pelayanan kesehatan. Data Susenas 2000 dan 2004 digunakan untuk menilai perubahan berbagai indikator kesehatan: morbiditas, pelayanan rawat jalan dan rawat inap, pelayanan kehamilan dan melahirkan, dan status gizi balita sebelum dan sesudah desentralisasi dilaksanakan. Perubahan rasio kematian bayi, kematian ibu, serta kematian balita juga termasuk analisis dari kajian ini. Seluruh analisis dilakukan pembobotan populasi dan analisa statistik dilakukan menggunakan SpssPC (rev 12). Dari hasil kajian menunjukkan bahwa terjadi sedikit peningkatan yang cukup berarti dari kejadian penyakit atau morbiditas penduduk antara tahun 2000 dan 2004, akan tetapi pemanfaatan pelayanan kesehatan (rawat jalan) meningkat di fasilitas pemerintah atau swasta. Peningkatan terbesar terjadi juga pada pelayanan kesehatan rawat inap. Dilaporkan juga pada tahun 2004 hanya sedikit sekali penyakit ditemukan oleh pelayanan kesehatan. Kajian ini juga menemukan bahwa sebelum dan sesudah desentralisasi, penggunaan pelayanan kesehatan terbanyak tetap dilakukan pada kelompok penduduk kaya. Provinsi yang mendapat tambahan biaya dari pinjaman menunjukkan penggunaan fasilitas pelayanan kesehatan yang meningkat terutama untuk pasien rawat jalan. Ada kecenderungan angka kematian balita menurun walaupun status gizi pada balita tidak mengalami perubahan atau peningkatan. Angka kematian bayi menurun cukup signifikan semenjak desentralisasi demikian juga kematian ibu. Terlihat jelas bahwa investasi pelayanan kesehatan yang nampaknya tidak menjadi prioritas pemerintah maupun masyarakat Indonesia. Sebelum dan sesudah desentralisasi Indonesia merupakan negara dimana investasi untuk pelayanan kesehatan menduduki urutan terendah dibandingkan dengan negara lain di dunia ini, terutama negara di ASEAN. Status kesehatan di Indonesia dapat dikatakan membaik walaupun kesepakatan pemerintah untuk memberikan alokasi kesehatan sangat rendah. Perubahan status kesehatan yang terjadi pada masa desentralisasi sebenarnya juga merupakan hasil dari kebijakan yang telah dilakukan sebelum desentralisasi. Selain itu, determinan kesehatan tidak selalu karena pendanaan dalam sistem kesehatan saja akan tetapi bisa saja berkaitan dengan sektor lain seperti pendidikan, dan pendapatan. Desentralisasi namapaknya tidak memberikan konsekuensi negatif terhadap memburuknya status kesehatan di Indonesia. Bahkan, beberapa indikator kesehatan terlihat membaik denagn perubahan lebih cepat pada saat desentaralisasi diibanding sebelumnya. Terutama pada provinsi dimana sosialisasi inisiatif sektor kesehatan diperkenalkan dengain menggunakan dukungan multilateral, terlihat terjadi peningkatan penggunaan pelayanan kesehatan, terutama pelayanan kelahiran dan peningkatan status kesehatan. Hanya gizi kurang pada balita yang nampaknya tidak membaik pada 10 tahun terakhir, kecuali membaik hanya pada saat adanya bantuan pada masa krisis moneter.
BACKGROUND
Decentralization has been promoted by many political scientists as enabling local populations in the political process, and helping improve the responsiveness of governments to local needs and aspirations1.
However it is also seen as having potential threat to various social programs as health care and education2.
In 1999 the Indonesian parliament passed two laws to promote decentralization (Law 22 and Law 25 of 1999), which redefined government function, and finance, which gave district governments large responsibility in allocating resources for the social sector. There was some concern at that time, that health, already an area with low levels of investment in Indonesia, might be even more seriously impacted if local governments spent more money on local infrastructure, or increase salaries to local government officials, than invest in health.
1
2
Under the old centralist system, when health care was funded nationally, medical care centers were seen as revenue generating sources for local government. However after financial responsibility for the public health system was delegated to the district government to support, public health was in competition with other social sectors, and development plans.
Table 1
Health Care expenditures in Select ASEAN countries as total Amount, and Percentage of the GDP3
Malaysia 294 3.3% 156 6.1% 72
Myanmar 28 2.2% 4 1.2% 59
Philippines 169 3.4% 80 7.0% 69
Singapore 933 3.6% 329 6.7% 80
Thailand 237 3.6% 138 11.8% 70
Canada 2,541 9.9% 1,452 15.2% 80
France 2,416 9.3% 2,061 13.4% 80
Japan 2,827 7.6% 2,298 16.1% 82
United Kingdom 1,859 7.3% 1,442 14.6% 78
United States 4,539 13.1% 2,017 18.2% 77
Source: World Health Report 2005, Annex tables1,5,6
The United States of America sets the upper boundary on expensive health care with its fee for service system. The United Kingdom, France, and Canada spend less respectively on health and medical care, but have better health status while utilizing less of their GNP on the health and Medical sector.
None of the ASEAN countries spend nearly as much for health care in terms of European or North American countries, and Singapore the same life expectancy as Canada and France, and three years higher than the United States
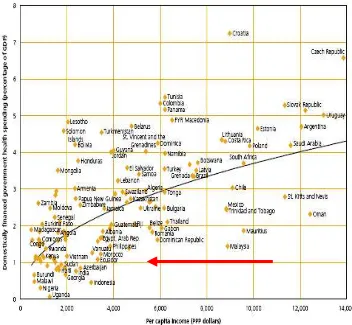
As can be seen in figure 1 below, Indonesia’s expenditure for health and medicine is quite low for its level of economic
development. This is even more paradoxical when one considers that relative good health status of the country in light of this low level of expenditure. The life expectancy is higher, risk of infant mortality, and probability of dying is much lower than many other developing countries, including South Asia, almost all of African, and several other countries in SE Asia such as Myanmar, Cambodia and Laos. The health status of Indonesia is very close to that of the Philippines which spends 8 times more for health and medical care than does Indonesia. There is obviously many factors besides the health care system contributing to the health status of Indonesia, and that the health care investments are effective.
Not only does not the government invest low levels of resource in health in Indonesia, but consumers also do not investment much in the way of medical and health care. As can be seen in Table 2 in various DHS provinces consumers spend 2
to 8.2 more on tobacco than they do on health services within a year, and tobacco is only a small proportion of total outlays. The most expensive component is of course consumption of food, which is one of the determinants of good health.
Table 2
Household expenditures in DHS provinces on Health Care, Food, and Tabacco Susenas 2004
Annual Per Capita Household expenditure (rp)
health food tobacco, sirih, and alcohol
tobacco compared to health
NAD 28,741 1,394,100 234,452 8.2
Riau 46,191 1,934,898 342,843 7.4
Bengkulu 42,493 1,349,358 202,894 4.8
North Sulawesi
40,705 1,641,144 267,012 6.6
Central Sulawesi 38,604 1,320,842 227,426 5.9 South East Sulawesi 24,638 1,352,334 191,007 7.8
The decentralization laws 22 and 25 of 1999 which took effect in 2001 were considered to be a potential threat to the health status of Indonesia. It was feared by many health development specialists both in Indonesia and in various donor agencies, that decentralization of funding and budgeting would actually reduce the amount of money going into the health sector by the government leading to a deterioration of the quality of services. At the time of decentralization, the economy of Indonesia had not yet recovered from the monetary crisis of 98 and the political instability of 99. Moreover the social safety net developed as a response to the monetary crisis was provinces and their respective districts during the initial period of decentralization to insure that there would be sufficient funds to continue with health and educational benefits for the poor, and strategic capital investments to maintain and improve quality of medical and health promotion activities.
OBJECTIVE
We will review various measures of health care utilization and health status across consumption quintiles before and after the introduction of decentralization, to try and determine what the initial impact of decentralization has been, and have further compared changes in health status over decentralization, and between various areas receiving various types of support (or no support what so ever), with different packages of health sector reform intuitives to look at the changes in health status associated with various endeavors.
METHODS AND MATERIALS
The bureau of statistics annually collects mid census data from a randomized multi-stage sampling frame on expenditure patterns, health utilization, and every three years on health and nutritional status. This is called the SUSENAS survey.
We have utilized the expenditure and health core of the 2000 and 2004 SUSENAS household expenditure and health core to review changes in reported utilization of morbidity, self treatment, out patient and inpatient care, birthing patterns before and after the implementation of Decentralization. Child hood nutritional status uses data from the 1989, 1992, 1995, 1998, 1999, 2000, 2001, 2002, 2003 SUSENAS.
Population weighted analysis was carried out using SpssPC (rev 12). Statistical analysis was done using chi-square and students t-test. However in a population weighted analysis most differences are significant, even with extreme assumptions of design effect.
RESULTS
Morbidity and Utilization of Health Care, 2000 and 2004
In reviewing the reported morbidity patterns in Indonesia between 2000 and 2004 one can see an increase in the number of people reporting to have been ill in the previous month. From 24.6% of the population having been ill the previous month in 2000, it increased to 26.5% of the population reporting illness in the previous month in 2004. The health of Indonesia although improving in terms of life expectancy, and reduction of infant mortality But symptoms of colds, and fevers remain similar between the two time periods.
those that are ill self treat, or do not sick treatment outside the household when ill. It is interesting to note the increase in inpatient
care between 2000 and 2004 (a 75% increase), showing an increasing demand in Indonesia for inpatient services.
Patterns of Health care Utilization by Quintile of Household Expenditure
Household expenditure for all food, capital good, durable good, rent, goods and services procured in the last year were calculated, and household divided into quintiles depending on their expenditure level. Quintile 1 represents the lowest level of expenditure (and is assumed to be the
poorest). Quintile 5 represents the highest level of expenditure, and represents the most financially well off. While morbidity rates were relatively stable across quintiles, those families in quintile 5 were 35% more likely to seek outpatient care, and 4.6 times more likely to seek inpatient care than those in the lowest quintile of expenditure.
Birthing Patterns
Births assisted by trained health personnel appear to have increased between 2000 and 2004.
seen on the following chart was higher in those provinces supported by the DHS-1 project that in the rest of Indonesia. This is particularly encouraging as the DHS-1
provinces are more smaller isolated smaller provinces with more dispersed populations, as compared to the major population centers of Java
This increase in utilization of birthing services was also seen in the overall utilization of outpatient services. Which a 30% increase in government supported outpatient services in the DHS provinces, as compared to the non-DHS provinces. This
suggests that the rehabilitation of health care facilities and the procurement of equipment increased the consumer demand for the government provided medical and health services.
Health Status Changes
Three commonly used mortality measure of health status are infant mortality rate, maternal mortality rate, and under five mortality rate. On all three parameters there
the late 1990’s, but after decentralization made a rapid and significant decrease.
Indonesian Infant Mortality Rate, 1977 to 2004
Indonesian Maternal Mortality Risk 1980 to 2004 (and trend to 2015)
Material mortality risk also reduced after decentralization. This is a more difficult health to measure precisely, but using reported figures it appears that from 320 deaths per 100,000 live births in 2000 the MMR reduced to around 267 deaths per 100,000 live births in 2004. This would parallel the increase in births assisted by trained health personnel.
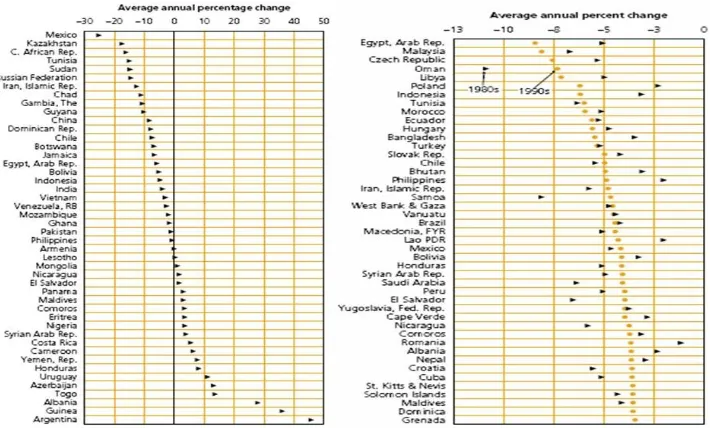
Under five mortality also contains infant mortality and is also been reduced during the time period covered by decentralization. What is interesting to note that Indonesia has made much more progress in the 1990’s on under five mortality (7th highest rate of
mortality between 1990 and 1980’s it appears that much more progress in the 90’s that in the 80’s (when there was significant improvement in nutritional status and
micro-nutrient status). Indonesia improvement in nutritional status is much lower level in the 1990’s than its improvement in mortality risk among under fives.
Nutritional Status
The nutritional status of the children of Indonesia have not improved with decentralization. In fact if one focuses on severe underweight, it can be seen in table three below that there has been 12% increase in severe underweight children between 2000 and 2004. This is partly an affect of the fact that the nutritional status of
Indonesian children actually improved during the monetary crisis, so that if one makes a more “fair comparison” of nutritional status between 1998 and 2003 it appears that severe malnutrition has gone done. No nutritional status data was collected in the Susenas 2004 data set. But in 2005 the rates of severely underweight have increased to 8.8%.
Table 3
Rates of Malnutrition in Indonesia 1989–2005 (Weight for age < -2 SD, and < -3SD)
1989 1992 1995 1998 1999 2000 2001 2002 2003 2005
< -2 SD (Underweight)
37.5% 35.5% 31.6% 29.5% 26.4% 24.6% 26.1% 27.3% 27.5% 28.0%
< -3 SD (Severely underweight)
6.3% 7.2% 11.6% 10.5% 8.1% 7.5% 6.3% 8.0% 8.3% 8.8%
Source: Susenas Data set, Nutritional Status Component, 1989-2005.
commented on by several international agencies4. This temporary 20% improvement
is often credited to the massive food aid component of the social safety net, but a reduction of birth rate during the early part of the monetary crisis among the lowest quintile population might have also contributed to this improvement in national nutritional status.
-6 -5 -4 -3 -2 -1 0 1 2 3 4 5 6 1989
1992
1995
1998
1999
2000
2001
2002
2003
Reference
Growth faltering reduction in 2000 appears across all age groups in preschool children,
but this improvement was immediately reverted to pre-crisis levels by 2003.
-2.00 -1.50 -1.00 -0.50 0.00 0.50 1.00
0 3 6 9 12 15 18 21 24 27 30 33 36 39 42 45 48 51 54 57 60
Age (month)
2 000 2 002 2 003
DISCUSSION
Investment in health care historicallyhas never been a priority of either the government or the consumers of Indonesia’s.
Year of Mean Standard Number of
Survey (SD's) Deviation samples
1989 -1.60 1.10 14,101
1992 -1.50 1.20 33,774
1995 -1.20 1.60 26,188
1998 -1.20 1.60 25,620
1999 -1.00 1.60 78,854
2000 -0.99 1.48 70,602
2001 -1.09 1.40 11,693
2002 -1.20 1.41 74,537
2003 -1.18 1.44 77,274
Reference 0.00 1.00
(WHO standard)
Indonesia both before and after decentralization has had one of the lowest levels of investment in health care in the Asean region, if not the world.
The health status of Indonesia is far better than one might expect given the low levels of resources committed to it by either the government or the consumers. The changes in health status during decentralizations are most likely due to policies established prior to decentralization. Moreover the determinants of health are not primarily funding in the health care system, but are perhaps more linked with other sectors such as education, employment and income.
Financing of health services follows similar patterns. During 2004 there was a health card issued by the local government, and services were financed by the national government with the health social safety net. As can be seen most of those in the lowest two expenditure quintiles primarily to utilize these sources of outpatient visits. However it appears that health cards were also used the top two quintiles to provide for out patient services. It is also interesting to note that some within the lowest quintile had access to government health insurance.
CONCLUSION
Decentralization does not appear to have had any negative consequences in terms of deterioration of the collective health status of Indonesia. Indeed, several indicators appear to be improving more rapidly after decentralization than before.
Moreover in those provinces where socialization of health sector initiatives were introduced using additional multilateral support, there appears to have been an additional increase in the utilization of health services, assisted birth, and improvement in health status.
Pre-school children’s risk of malnutrition appears to have stayed the same over the last 10 years except for a slight improvement during the monetary crisis.
It appears that essential to improving health status is increasing government expenditure, and increase consumer demand for government health services.
REFERENCES
1. Allen, L.. Gillespie, S. “What Works? A review of the Efficacy and Effectiveness of Nutritional Interventions.” Asian implication for sexual and reproductive health services. Reproductive health matters 2002:10:6-15.
4. Matlin, S. Global Forum for Health Research, Global Forum Update on Health Research for Health Volume 2. Pro-book Publishing Limited 2005. 5. Ministry of Health (Indonesia) Basic
6. Newbrander editor Private Health Sector Growth in Asia. John Wiley and sons, 1997 London.
7.
Roberts, Hsiao, Berman, Reich Getting Health Reform Right. Oxford University Press, New York. 2004.8.
WHO Indonesia: Sub national Health System Performance Assessment BPS, Jakarta.9. World Bank; World Development Report: 2004 Making Services Work
for Poor People, Oxford Press, New York.
10.
World Bank. World Development Report: 2006 Equity and Development, Oxford Press, New York.11. World Bank. The Millennium Development Goals for Health. Raising to the Challenges. World Bank 2004, Washington.