www.elsevier.com / locate / livprodsci
An international study on the importance of androstenone and
skatole for boar taint: levels of androstenone and skatole by
country and season
a ,
*
b c d ,1 eP. Walstra
, C. Claudi-Magnussen , P. Chevillon , G. von Seth
, A. Diestre ,
f f g
K.R. Matthews , D.B. Homer , M. Bonneau
a
DLO –Institute for Animal Science and Health(ID–DLO), PO Box 65, NL-8200 AB Lelystad, The Netherlands
b
Danish Meat Research Institute, Maglegaardsvej 2, DK-4000 Roskilde, Denmark
c
ˆ
Pole‘Techniques d’Elevage’, ITP, BP 3, 35650 Le Rheu, France
d
¨
Swedish Meat Research Institute, PO Box 504, S-244 24 Kavlinge, Sweden
e
IRTA, Centro de Technologia de la Carn, 17121 Monells, Spain
f
Meat and Livestock Commission, PO Box 44, Milton Keynes MK6 1 AX, UK
g
Station de Recherches Porcines, INRA, 35590 Saint Gilles, France
Received 29 June 1998; received in revised form 3 February 1999; accepted 25 March 1999
Abstract
Fat samples from 43,13 entire males taken from six European countries were measured for androstenone and skatole using rapid ELISA and colourimetric methods, respectively. The samples were collected during summer (replicate 1) and during the following winter period (replicate 2). A sub-population of over 400 samples was further measured for androstenone and skatole using laboratory methods. For skatole, there were only small differences between rapid and laboratory measurements; therefore, the rapid measurements were used throughout. Rapid measurements of androstenone could not be used because of large differences with the laboratory measurements in replicate 2. Therefore, the rapid values of androstenone for the whole population were corrected based on the laboratory ELISA measurements. Mean skatole concentration differed between replicates, but there was no overall difference for androstenone. Significant country by replicate interactions were observed for both androstenone and skatole. Skatole levels were higher in replicate 1 than replicate 2 for the United Kingdom (0.15 vs. 0.11mg / g), Sweden (0.13 vs. 0.10mg / g) and the Netherlands (0.19 vs. 0.16mg / g), whereas they did not differ between replicates for the other countries (Denmark, France and Spain). Androstenone levels were higher in replicate 2 than replicate 1 only for the Netherlands (0.69 vs. 0.86mg / g), while the reverse was found in the United Kingdom (0.91 vs. 0.72mg / g). Overall, the correlation coefficient between androstenone and skatole was 0.30. Apart from the interaction between countries and replicates, various countries within replicates differed for mean androstenone and skatole concentrations due to the different frequency distributions for both. Overall, the United Kingdom (0.81 and 0.54mg / g), France (0.80 and 0.53mg / g) and the Netherlands (0.79 and 0.53 mg / g) had the lowest mean and median concentrations for androstenone, whereas Sweden (1.22 and 0.82mg / g) and Spain (1.27 and 0.85mg / g) had the highest. The lowest mean concentration for skatole was found in Denmark (0.10 mg / g), while it was highest in the Netherlands (0.17 mg / g) and Spain (0.17 mg / g).
*Corresponding author. Tel.: 131-320-238-982; fax: 131-320-238-961.
E-mail address: [email protected] (P. Walstra)
1
¨ Present address: AB Samfod, PO Box 50324, S-202 13 Malmo, Sweden.
Androstenone and skatole concentrations increased with increasing carcass weight and decreased with increasing lean meat percentage. However, the correlation coefficients were very low; about 0.10 for carcass weight and 20.15 for lean meat percentage. Overall, more than 60% of the entire males had androstenone levels above 0.5mg / g and about 30% had levels above 1.0mg / g. For skatole, 15% of the entire males had levels above 0.2mg / g and more than 10% had levels above 0.25
mg / g, but there was a large variation between countries. In the Netherlands and Spain, about 20% of the entire males had skatole levels above 0.25 mg / g, while this was lower than 2% in Denmark. 1999 Elsevier Science B.V. All rights reserved.
Keywords: Entire males; Androstenone; Skatole; Meat quality; Carcass weight; Lean meat percentage
1. Introduction mentioned ones and Germany) by trained sensory panels and by normal consumers. The results of the Young entire male pigs have a better commercial sensory evaluation by sensory panels and of con-performance than castrates, mainly due to more sumer surveys are presented by Dijksterhuis et al. efficient food conversion and higher lean meat (1999) and Matthews et al. (1999), respectively. percentage of the carcass. However, entire males Main conclusions and recommendations are pre-often have a higher incidence of odours and flavours, sented by Bonneau et al. (1999b).
found unpleasant by some consumers, known as boar taint. This prevents rearing of young entire males on
a large scale in most countries. Androstenone (5a- 2. Materials and methods
androst-16-ene-3-one) (Patterson, 1968) and skatole
(3-methyl-indole) (Vold, 1970; Walstra and Maarse, 2.1. Sampling 1970) have long been perceived to be the compounds
responsible for boar taint. Samples were collected at various slaughterhouses An EU-supported research programme was con- from the six countries of production during June to ducted to improve the knowledge on the respective mid-July 1995 (replicate 1) and December 1995 to contributions of androstenone and skatole to boar mid-January 1996 (replicate 2). This resulted in a taint and their possible variations according to total number of 4,313 entire males and 223 gilts. To countries of production and consumption. A com- ensure as representative a sample of entire males prehensive description of the trial is given by available in a country as possible, animals originated Bonneau et al. (1999a). The present paper reports the from at least ten herds per replicate, representing results on androstenone and skatole concentrations various genotypes and production systems. France measured in 4,313 entire males raised during sum- and SE reared entire males especially for the trial; in mer (replicate 1) and winter (replicate 2) in six the other countries, they originated from normal European countries: France (FR), Sweden (SE), the production. As far as possible, herds with abnormal Netherlands (NL), Denmark (DK), the United King- feeding regimens were avoided in order to prevent dom (UK) and Spain (ES). The three first countries the occurrence of, for example, extremely lean have a very low percentage of entire males in pigs carcasses or very old pigs. Extreme, whether visual produced for slaughter; DK is intermediate, while, in or measured, PSE (pale, soft, exudative) or DFD the latter two countries, the majority of males are not (dark, firm, dry) carcasses were excluded at selection castrated. Samples were also taken from gilts as a in the slaughterhouses.
and deep-frozen at 2208C until analysis. Fat sam- of the conjugate (androstenone-peroxidase) was ples from each country were sent to the DLO– added. After mixing, the samples were maintained Institute for Animal Science and Health (ID–DLO; for 1 h at room temperature. The plates were then NL) for rapid analysis of androstenone and to the twice emptied and washed (with peroxidase diluted Danish Meat Research Institute (DK) for rapid in distilled water). After addition of 150 ml of a analysis of skatole. A sub-population of the fat solution of TMB chromogen and substrate, con-samples (those corresponding to the loin con-samples taining tetramethylbenzidine and urea peroxide, the used for sensory evaluation and consumer surveys) plates were further maintained for 30 min at room was sent to the University of Hohenheim (Germany) temperature. The reaction was stopped by the addi-for checking the results of the rapid measurements tion of 100 ml of a solution containing 0.25 mol / l for both androstenone and skatole by laboratory H SO .2 4 After mixing, extinction values were methods, as described by Bonneau et al. (1999a). measured at 450 nm. The standard curve included concentrations of 0, 0.05, 0.2, 0.5, 2.0 and 10.0mg / g
2.2. Carcass data androstenone in pig kidney fat. According to the
producer of the kits, the assay is most sensitive at the At slaughter, carcass weight and lean meat per- midpoint of the standard curve, corresponding to centage data were also collected. Hot carcass weights 0.5–0.6 mg androstenone / g undiluted fat. Concen-were representative of each national distribution. Hot trations found higher than 10mg / g were assigned a carcass weight was defined according to the EU value of 10.
definition (EU Regulations No. 3220 / 84 and No. The rapid measurements for skatole were carried 3513 / 93), i.e. with head and feet, but without flare out according to an automated colourimetric assay fat, kidneys and diaphragm. In those countries where (Mortensen and Sørensen, 1984; Hansen-Møller and the definition of carcass weight deviated from the EU Andersen, 1994). The analysis procedure was that 5 standard, it was corrected to this standard. Lean meat ml TRIS–HCl / acetone buffer was added to 0.5 g percentage was estimated by means of an instrument sample of backfat in a polypropylene beaker. After according to an EU-approved method (EU Regula- homogenization with a specially designed homogeni-tions No. 2967 / 85 and No. 3127 / 94) for each zation device and cooling to approximately 48C, the
particular country. homogenate was filtered through a sintered glass
filter. To 1 ml of the filtrate, 1.42 ml of colour 2.3. Analysis of androstenone and skatole reagent (di-methyl-amino-benzaldehyde / ethanol / sul-phuric acid solution) was added. After 3 min at room At the start of the analysis for androstenone, a temperature, 2 ml of the solution was transferred to slender cylinder of backfat, comprising both layers the 30-mm flowcell of a Lambda II
spectrophotome-¨
or, when present, three layers (skin trimmed off), ter (Perkin-Elmer, Uberlingen, Germany), and the was cut from the thawed sample and heated in a spectrum from 460–730 nm was recorded. The microwave oven (Miele electronic M720) at 450 W absorption at 580 nm was used for quantitation by for 4 min. The rapid analysis for androstenone was comparison with a known skatole standard curve. based on an ELISA method (Claus et al., 1997a) and The standard curve included concentrations of 0, was carried out according to the technical bulletin 0.025, 0.05, 0.075 and 0.1 mg / g skatole diluted in included in the commercial test kits (Riedel-deHaen, acetone / TRIS–HCL buffer.
Seelze, Germany). After melting, a 25-ml aliquot of Measurements for both androstenone and skatole melted fat was dissolved in 0.5 ml of methanol, were made in duplicate. The average concentrations which was heated to 558C and shaken for about 5 were used.
and, in the case of high concentrations (above 2 the rapid method overestimated the laboratory
con-mg / g), the samples were reanalysed after dilution centrations substantially. Therefore, it was decided to with androstenone-free fat. The HPLC method for correct all rapid androstenone results, for the whole androstenone was a fluorimetric quantification based population, on the basis of the manual ELISA (Lab-on a dansyl reacti(Lab-on (Oerhle, 1977; Hansen-Møller, ELISA) results using the following regression equa-1994). Both methods were described by Claus et al. tions for the values of androstenone transformed by (1997b). For the HPLC method for skatole and natural logarithms:
indole, fluorescence detection was used (Dehnhard et
2
al., 1993). RSD R
Replicate 1: Lab-ELISA5 20.14710.9483Rapid 0.40 0.91
2.4. Statistics
Replicate 2: Lab-ELISA5 20.59410.8573Rapid 0.56 0.85
Ordinary linear regression was applied to correct
2 where RSD is the residual standard deviation and R all rapid androstenone results based on the manual
is the variance accounted for. ELISA results. Frequency distributions for
Since the relationships between laboratory and androstenone and skatole are known to be skewed,
rapid methods, in terms of regression equations, were the majority of the samples being in the lower
not consistent across replicates, the corrections were concentration range and much less in the higher
calculated separately for each replicate. Quadratic range. Analyses of variance models were fitted to
terms offered no substantial improvement. The cor-log-transformed (natural logarithms) androstenone
rected rapid measurements were used for further data and skatole concentrations to test for differences
analyses. between country of production and replicates, and to
test for changes with carcass weight and lean meat
percentage. Results were back-transformed to the 3.2. Androstenone and skatole levels among original scale. Directly back-transformed means from countries and replicates
the logarithmic scale are medians on the original
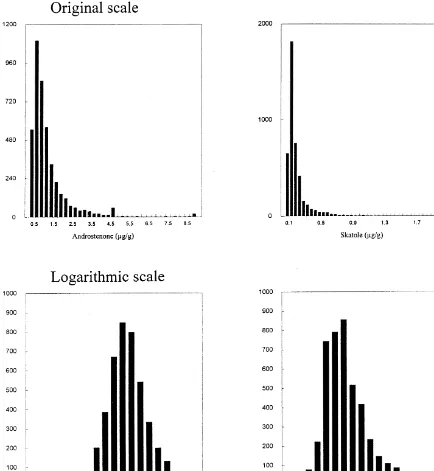
scale. Employing properties of the log-normal dis- The basic carcass data together with the number of tribution (Neyman and Scott, 1960), in addition to carcasses, abattoirs and herds is summarised for each these medians, means on the original scale were country in Table 1. The distributions of androstenone calculated as well, and these are presented in this and skatole in the entire males are given in Fig. 1 on paper. Additionally, frequency distributions for the original scale as well as on the logarithmic scale. androstenone and skatole for different countries were The histograms clearly show the skewness. In par-compared with the chi-square test. ticular, the distribution of skatole was skewed and this was not completely removed by logarithmic transformation, in contrast to androstenone. The joint
3. Results distribution of both compounds for the entire males is given in Fig. 2 and shows another impression of 3.1. Comparison between rapid and laboratory the skewness. A moderate positive relationship was
methods calculated between the transformed androstenone and
skatole concentrations. The correlation coefficient (r) There were some discrepancies between the rapid was 0.30.
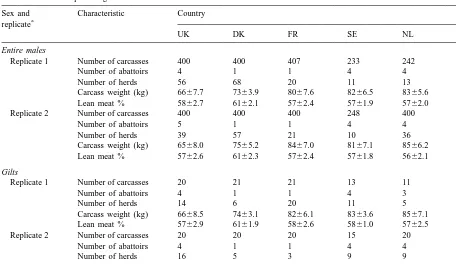
Table 1
Number of carcasses, abattoirs and herds in the various countries, plus mean (6S.D.) data collected for hot carcass weight (kg) and estimated lean meat percentage
Sex and Characteristic Country
a
replicate
UK DK FR SE NL ES
Entire males
Replicate 1 Number of carcasses 400 400 407 233 242 402
Number of abattoirs 4 1 1 4 4 1
Number of herds 56 68 20 11 13 14
Carcass weight (kg) 6667.7 7363.9 8067.6 8266.5 8365.6 7866.7
Lean meat % 5862.7 6162.1 5762.4 5761.9 5762.0 5763.4
Replicate 2 Number of carcasses 400 400 400 248 400 381
Number of abattoirs 5 1 1 4 4 1
Number of herds 39 57 21 10 36 10
Carcass weight (kg) 6568.0 7565.2 8467.0 8167.1 8566.2 7967.0
Lean meat % 5762.6 6162.3 5762.4 5761.8 5662.1 5663.5
Gilts
Replicate 1 Number of carcasses 20 21 21 13 11 20
Number of abattoirs 4 1 1 4 3 1
Number of herds 14 6 20 11 5 5
Carcass weight (kg) 6668.5 7463.1 8266.1 8363.6 8567.1 7966.3
Lean meat % 5762.9 6161.9 5862.6 5861.0 5762.5 5762.4
Replicate 2 Number of carcasses 20 20 20 15 20 22
Number of abattoirs 4 1 1 4 4 1
Number of herds 16 5 3 9 9 2
Carcass weight (kg) 6569.1 7564.2 84610.5 8267.6 8868.0 8266.3
Lean meat % 5762.4 6062.5 5762.9 5661.6 5662.7 6063.4
a
Replicate 1, summer period; replicate 2, winter period.
0.001). Androstenone levels were higher in replicate median and maximum concentrations were 0.03, 1 than 2 in UK, whereas the reverse was observed in 0.01 and 0.16 mg / g, respectively, for androstenone NL. For skatole, the differences between replicates and 0.07, 0.06 and 0.19 mg / g, respectively, for and between countries of production as well as the skatole.
interaction between replicate and country were
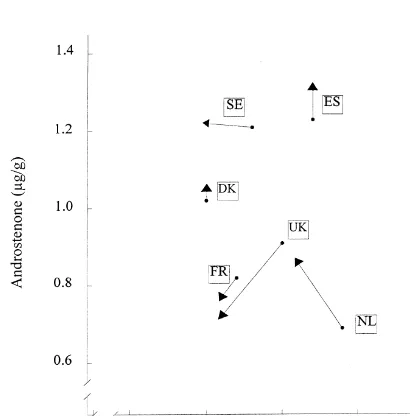
sig-nificant (P,0.001). Skatole levels were higher in 3.3. Frequency distributions of androstenone and replicate 1 than 2 in UK, SE and NL. skatole among countries and replicates
The means of androstenone and skatole for each
replicate and country are plotted in Fig. 3. Each pair The frequency distributions in entire males by of points represents one country with an arrow country and overall are given in Tables 4 and 5 for joining the two replicates. Overall, UK, FR and NL androstenone and skatole concentrations, respective-had the lowest means and medians for androstenone, ly. The frequency distributions were affected (P,
DK was intermediate, and SE and ES were highest 0.001) by country for both androstenone and skatole. (Table 2). For skatole, DK had the lowest con- There were many significant differences between centrations overall; UK, FR and SE were inter- countries in the frequency distributions. However, mediate, and NL and ES were highest (Table 3). the differences in distributions between replicates
Because of the limited numbers of gilts per were small.
Fig. 1. Distributions of androstenone (mg / g) and skatole (mg / g) of entire males across all six countries on the original scale and on the natural logarithmic scale.
lean meat percentage, the correlation coefficients were a little higher (around 20.15) across countries and replicates and went up to 20.23 in FR.
4. Discussion
The differences between the rapid and laboratory measurements, especially for androstenone in the second replicate, are discussed in detail in Bonneau et al. (1999a). It is stated there that the reasons are not definitely known, but might have arisen from moving all the rapid ELISA equipment and the samples between the replicates to a new location, so that the assay may have performed differently at the new laboratory.
The total variation in lean meat percentages, from 41 to 67%, was within the normal range. The lean meat percentages of the carcasses may not be entirely accurate for some countries, because entire
Fig. 2. Joint distributions of androstenone (mg / g) and skatole
males were not involved in the experimental designs
(mg / g) of entire males across all six countries.
for EC approval of estimation equations for carcass classification. There was a large variation for hot 3.4. Influence of weight and lean meat percentage carcass weights (from 48 to 107 kg) due to the variation in slaughter weights between the countries The analysis of variance showed that there was a of production.
significant positive influence of hot carcass weight The correlation coefficient between androstenone on skatole (P,0.01) and androstenone (P,0.001). and skatole (0.30) was not very high. In studies Lean meat percentage related negatively to both where androstenone and skatole were both investi-compounds (P,0.001). The correlation coefficients gated, others found very similar relationships: 0.30
¨
between androstenone or skatole concentrations and by Støier (1994); 0.31 by Lundstrom et al. (1984); ¨ carcass weight were about 0.10 across countries and 0.31 by Weiler et al. (1995); 0.32 by Lundstrom et replicates. In some countries, the values were about al. (1988); 0.34 by Annor-Frempong et al. (1997). 0.18 for androstenone (FR and NL). In the case of Lower coefficients were reported by Stamer et al.
Table 2
Mean and median levels of androstenone concentrations (mg / g) in entire males by country for the summer (replicate 1) and winter (replicate 2) periods, and overall
An asterisk in the same line depicts the countries with significant differences (P,0.05) between replicates.
2
Table 3
Mean and median levels of skatole concentrations (mg / g) in entire males by country for the summer (replicate 1) and winter (replicate 2) periods, and overall
An asterisk in the same line depicts the countries with significant differences (P,0.05) between replicates.
2
Countries with different superscripts significantly differ (P,0.05).
Although the correlation coefficients between the carcass characteristics (hot carcass weight and lean meat percentage) and the boar taint compounds were low, the relationship was significant due to the wide range of slaughter weights and the high number of animals involved. Also, within country, the correla-tion coefficients remained low and went up to a maximum of 20.23 for lean meat percentage in FR. Androstenone and skatole concentrations increased weakly with increasing carcass weight and decreased weakly with increasing lean meat percentage. The same was found by Walstra and Garssen (1995) with measurements of androstenone, also on a large number of animals (n.1900), using an automated device which was based on the rapid ELISA.
Falken-¨
berg and Blodow (1981), LeDenmat et al. (1993) and Neupert et al. (1995) found low and non-signifi-cant correlation coefficients for androstenone at
Fig. 3. Means of androstenone and skatole by replicate and
normal commercial slaughter weights. Bonneau
country. The arrow joins the summer replicate (dot) with the
(1987) also found significant correlations between
winter replicate (arrowhead).
Table 4
Frequency distributions (%) of androstenone concentrations in entire males by country and overall
Concentration Country of production Overall
(mg / g)
UK DK FR SE NL ES
# 0.1 3.1 1.0 2.2 2.5 2.7 1.7 2.2
0.1–0.2 8.2 4.8 8.4 4.4 6.8 2.8 6.0
0.2–0.3 11.6 8.1 10.5 6.4 9.8 7.1 9.1
0.3–0.4 13.3 8.8 12.6 7.9 13.0 8.2 10.8
0.4–0.5 10.7 9.9 13.8 6.2 11.4 8.7 10.4
0.5–0.6 8.0 10.9 8.7 6.2 10.0 6.7 8.5
0.6–0.7 6.8 7.0 7.3 7.3 9.6 9.2 7.9
0.7–0.8 6.2 6.2 7.2 5.0 8.8 5.4 6.5
0.8–0.9 5.8 6.0 4.8 7.9 5.2 3.5 5.4
0.9–1.0 4.1 6.4 3.5 4.2 4.4 4.7 4.6
1.0–1.5 9.7 16.1 11.0 15.4 10.6 14.2 12.7
1.5–2.0 4.4 5.4 4.8 10.4 3.0 9.6 6.1
2.0–3.0 4.8 4.8 3.5 6.4 3.0 8.1 5.1
3.0–4.0 1.6 3.1 1.1 4.0 0.9 3.0 2.2
.4.0 1.8 1.4 0.5 5.8 0.8 7.1 2.7
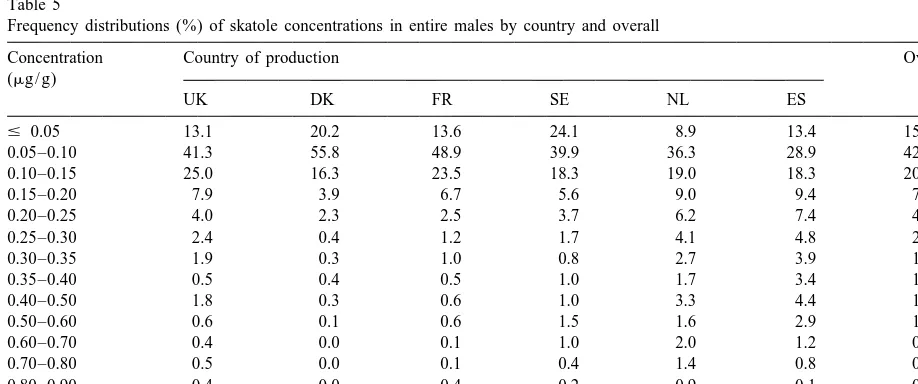
Table 5
Frequency distributions (%) of skatole concentrations in entire males by country and overall
Concentration Country of production Overall
(mg / g)
UK DK FR SE NL ES
# 0.05 13.1 20.2 13.6 24.1 8.9 13.4 15.2
0.05–0.10 41.3 55.8 48.9 39.9 36.3 28.9 42.3
0.10–0.15 25.0 16.3 23.5 18.3 19.0 18.3 20.3
0.15–0.20 7.9 3.9 6.7 5.6 9.0 9.4 7.1
0.20–0.25 4.0 2.3 2.5 3.7 6.2 7.4 4.3
0.25–0.30 2.4 0.4 1.2 1.7 4.1 4.8 2.4
0.30–0.35 1.9 0.3 1.0 0.8 2.7 3.9 1.8
0.35–0.40 0.5 0.4 0.5 1.0 1.7 3.4 1.2
0.40–0.50 1.8 0.3 0.6 1.0 3.3 4.4 1.9
0.50–0.60 0.6 0.1 0.6 1.5 1.6 2.9 1.2
0.60–0.70 0.4 0.0 0.1 1.0 2.0 1.2 0.7
0.70–0.80 0.5 0.0 0.1 0.4 1.4 0.8 0.5
0.80–0.90 0.4 0.0 0.4 0.2 0.9 0.1 0.3
0.90–1.00 0.1 0.0 0.0 0.2 0.9 0.5 0.3
.1.00 0.3 0.1 0.1 0.4 1.9 0.5 0.5
and above 1.0 mg / g fat increased sharply above 85 higher weights, androstenone levels will be increased and 95 kg carcass weight, respectively, probably and that this also holds for skatole. Although carcass reflecting the pubertal growth impetus. Sorting of weight significantly contributes to the prediction of entire males into 33.3 percentiles for weight, resulted the androstenone and skatole concentrations, in the in increasing androstenone levels with increasing present study as well as in the literature, the
per-2
weight, but this was not found for skatole (Hennessy centages of variance accounted for (R ) are low (in et al., 1995). In contrast, Squires and Lou (1995) the present study found to be lower than 4%) and, found higher skatole levels with increasing weight in thus, this seems to be of little practical value as long the Hampshire breed, but not in other breeds studied. as the normal weight ranges are involved.
study, for the correlation coefficients between lean monthly averages of more than 13,000 commercially meat percentage and androstenone and skatole con- slaughtered entire males. Levels were higher in late
¨ centrations (r5 20.13 and 20.17, respectively; spring than in late summer. Falkenberg and Blodow P,0.05), with small variations between countries. (1981) found higher androstenone concentrations in Also, on a large number of entire males, Walstra and winter than in early summer or autumn, but the Garssen (1995) reported a correlation coefficient of differences were not significant.
¨
at most r5 20.19 for androstenone. Lundstrom and The more obvious effect of season on skatole, as Malmfors (1993) reported a correlation coefficient of found by Andersson et al. (1995), is in line with our
20.17 (P,0.001) for skatole. Low coefficients results, but they could not ascribe the effect to higher between backfat thickness (which explains, as a temperatures as stated by Hansen et al. (1993) and
¨
parameter of prediction equations used at classifica- Lundstrom and Malmfors (1993). These groups tion in the various countries, much of the variation in explained the higher skatole concentrations by higher lean meat percentage) and androstenone were also skatole concentrations in the air and the higher
¨
found by Falkenberg and Blodow (1981) and Bon- skatole load from faeces favoured by higher tempera-neau and Sellier (1986). Nevertheless, crosses with tures during the summer. In the experiment of
´
breeds with higher lean meat yields, e.g. Pietrain Andersson et al. (1997b), there were no differences which is earlier maturing, and especially at higher between the light regime groups for skatole con-weights, may have higher androstenone and skatole centrations. Since slaughter was before or during levels (Weiler et al., 1995). It may be concluded that, June, the effect of the higher temperatures might not like the influence of carcass weight, lean meat yet have become apparent.
percentage is also only weakly (although signifi- Most findings for androstenone have a meaningful cantly) related to the amount of androstenone and physiological background, corresponding to wild skatole. This might be expected from the interrela- boars and older domesticated boars. The experiments tionship within types of pigs between carcass weight, mentioned are difficult to compare because of rearing backfat thickness and lean meat percentage. periods in different months of the year and not all of Overall, there was no significant difference be- them are consistent with regard to increasing and tween replicates for androstenone; there was in two decreasing daylength. However, it seems that, under countries but with reversed trends. For skatole, commercial conditions, differences between the sum-however, a seasonal effect was demonstrated: the mer and winter seasons are small. The present study concentrations of skatole were, on average, lower confirms this in the case of androstenone, where the when slaughtered in winter than in summer. differences between the replicates were small. The Claus (1979) noted higher concentrations for higher skatole concentrations in summer than in androstenone during autumn and up to January, but winter in the present study are consistent with most this was in older boars. This is in line with the previous findings, although the differences were findings of Keller et al. (1997) that androstenone smaller. However, in contrast to some other countries levels are affected by season in boars used for in the present study, the higher concentration of artificial insemination, decreasing with increasing skatole in summer was not found in ES, where one daylength, and increasing as daylength decreases. would expect higher temperatures in summer. Han-Artificial light regimes, mimicking spring and au- sen (1998) reported that, in the week before slaugh-tumn photoperiods, showed lower androstenone and ter, skatole concentrations may increase or decrease skatole concentrations with lengthening of days if the animals are heavily fouled or clean, respective-(Andersson et al., 1995; Andersson et al. (1997b), ly. Since we do not know the rate of fouling or the which was coincident with the development of the ventilation rate, explanations remain difficult. sexual maturation characteristics measured. Neupert All gilts had low androstenone concentrations. For et al. (1995), also using different light regimes, could skatole, however, higher levels were sometimes detect only weak effects on androstenone as well as found. In this study, the maximum value of 0.19 on skatole. Walstra and Garssen (1995) reported mg / g fat exceeded the mean and median concen-significant differences for androstenone between trations of the entire males.
androstenone and skatole concentrations indicated no levels above 0.25 mg / g whereas, for DK, this consistent change between the replicates. Countries percentage was lower than 2.
differed in concentrations of androstenone and The high percentages of androstenone and skatole skatole. High concentrations of androstenone do not concentrations above the mentioned cut-off levels of necessarily correspond with high concentrations of 0.5 and 0.25mg / g, respectively, in this study, is not skatole. A clear example is the NL: it is among the very promising for the production of entire males in countries with the lowest androstenone concentra- markets where boar taint is perceived as a problem, tions, but had the highest mean skatole concen- at least without further incentives. Walstra and tration. DK was intermediate for androstenone, but Vermeer (1993) concluded that, under the prevailing exhibited the lowest skatole concentration. The latter conditions in a number of countries, from the point is also reflected in the frequency distribution. So, it of view of economics, finishing entire males on a seems that the penalty system applied in that country large scale would not be easy to initiate. Neverthe-for delivering entire males only with lower con- less, consumption of meat from entire males is centrations of skatole to the slaughterhouses has been common in some countries, such as UK where, successful. Also, information to the farmers about although with the lowest carcass weights, more than feed composition, feeding strategies and housing 50% of the androstenone concentrations were above systems (Kjeldsen, 1993) may have contributed to 0.5 mg / g. Despite differences in the frequency these results. An explanation for the differences in distributions between countries, the percentage of androstenone concentrations between countries can- androstenone or skatole above the mentioned not be given. In contrast to skatole, where environ- thresholds was found, in general, to be high also in mental factors are more important, differences in the present study. Therefore, in those countries androstenone concentrations are more inherent to the applying such thresholds, there is poor reason to animals. On the other hand, the genetic background change from castration to rearing of entire males, of the animals between countries, although not unless drastic measures are taken to reduce andros-recorded, was unlikely to have differed greatly; all tenone and skatole levels in entire male pig popula-these countries use crossbreds in which the Landrace tions. Possible techniques to achieve that are pre-and Yorkshire / Large White breeds are the dominant sented in, for example, Bonneau (1997).
Recom-breeds. mendations for target maximum androstenone /
In the literature, some threshold values for skatole levels, in order to achieve given differences androstenone and skatole concentrations are given in acceptability between entire male and gilt pork, above which consumers would negatively react to have been calculated from the results of the whole meat from entire males. Many references are avail- EU study and are presented in Bonneau et al. able. For androstenone, these values were found to (1999b). They stated that it was not possible, based be 0.5 or 1.0 mg / g. For skatole, values of 0.2 and on the results of the study, to determine cut-off 0.25 mg / g were given. These boundaries have levels for androstenone and skatole. They also frequently been used (e.g. by Desmoulin et al., 1982; concluded that a sharp reduction in both compounds Walstra et al., 1986; Mortensen et al., 1986; Bonneau would be needed to achieve only a small difference et al., 1992; Claus, 1995) in sensory studies with in acceptability between entire male and gilt pork. consumers or for sorting of carcasses.
In the present study, overall, 38.5% of the entire
males had androstenone levels below 0.5 mg / g and Acknowledgements
71.4% of the entire males were below 1.0 mg / g.
Bonneau, M., 1997. Boar taint in entire male pigs–a review. Pig
SCAN (Sweden). The expert technical assistance of
News Inf. 18, 15N–18N.
D.L. Homer and D. Armall (United Kingdom),
Bonneau, M., Sellier, P., 1986. Fat androstenone content and
STEFF-HOULBERG (Denmark), Franc¸oise Giovan- development of genital system in boars. World Rev. Anim.
´ ´
ni, Jacques Portanguen and Valerie Ferre (France), B. Prod. XXII (1), 27–30.
Bonneau, M., LeDenmat, M., Vaudelet, J.C., VelosoNunes, J.R.,
Hulsegge, G.S.M. Merkus and T.C. van Dijk (The
Mortensen, A.B., Mortensen, H.P., 1992. Contributions of fat
Netherlands), M.J. Bautista and A. Quintana (Spain),
androstenone and skatole to boar taint: I. Sensory attributes of
¨
and L. Sjoberg and P. Ohlsson (Sweden) is greatly fat and pork meat. Livest. Prod. Sci. 32, 63–80.
acknowledged for sampling and preparing the sam- Bonneau, M., Kempster, A.J., Claus, R., Claudi-Magnussen, C., Diestre, A., Tornberg, E., Walstra, P., Chevillon, P., Weiler, U.,
ples, and of L. Larsen (Denmark), Dr E. Herbert and
Cook, G.L., 1999a. An international study on the importance of
E. Wieland-Rostan (Germany), and J.C. Verplanke
androstenone and skatole for boar taint: I. Presentation of the
and J. Jacobs (The Netherlands), for measuring programme and measurement of boar taint compounds with androstenone and skatole concentrations. Similarly, different analytical procedures. Meat Sci. (in press). the statistical advice and assistance of G.L. Cook Bonneau, M., Walstra, P., Claudi-Magnussen, C., Kempster, A.J.,
Tornberg, E., Fischer, K., Diestre, A., Siret, F., Chevillon, P.,
(United Kingdom), and B. Engel and W. Buist (The
Claus, R., Dijksterhuis, G.B., Punter, P., Matthews, K.R.,
Netherlands) is greatly acknowledged.
´
Agerhem, H., Beague, M.P., Oliver, M.A., Gispert, M., Weiler, U., Von Seth, G., Leask, H., Font i Furnols, M., Homer, D.B., Cook, G.L., 1999b. An international study on the importance of androstenone and skatole for boar taint: IV. Simulation studies References on consumer dissatisfaction with entire male pork and the effect of sorting out carcasses on the slaughter line, main ¨
Andersson, H., Lundstrom, K., Rydhmer, L., Hansson, I., For- conclusions and recommendations. Meat Sci. (in press). sberg, M., Andersson, K., 1995. Effects of spring and autumn Claus, R., 1979. Pheromones in mammals with special reference light regimens on puberty, boar taint and leanness in entire to boar taint and its relation to other testicular steroids.
¨
male pigs. In: Proc. Meeting EAAP Working Group Production Fortschritte in der Tierphysiologie und Tierernahrung. Beihefte ¨
and Utilisation of Meat from Entire Male Pigs, Milton Keynes, zur Z. Tierphysiol. Tierernahrg. u. Futtermittelkde 10, 136 pp. UK, Session III, 4 pp. Claus, R., 1995. Comparative evaluation of the results from the
¨
Andersson, K., Hullberg, A., Malmgren, L., Lundstrom, K., joint experiment on the fattening of entire male pigs. In: Die
¨ ¨
Squires, J., Rydhmer, L., 1997a. Relations between boar taint Ebermast. Schriftenreihe des Bundesministeriums fur Ernah-¨
and puberty in entire males. In: Bonneau, M., Lundstrom, K., rung, Landwirtschaft und Forsten. Reihe A: Angewandte Malmfors, B. (Eds.), Boar Taint in Entire Male Pigs, Wagen- Wissenschaft Heft 449, 84–92.
ingen Pers, Wageningen, pp. 70–73, EAAP Publication No. 92. Claus, R., Herbert, E., Dehnhard, M., 1997a. Comparative de-¨
Andersson, H., Lundstrom, K., Wallgren, M., Rydhmer, L., termination of the boar taint steroid androstenone in pig Andersson, K., Forsberg, M., 1997b. Photoperiodic influence adipose tissue by a rapid enzyme immunoassay and
HPLC-¨
on boar taint in entire male pigs. In: Bonneau, M., Lundstrom, method. Archiv Lebensmittelhygiene 48, 25–48.
K., Malmfors, B. (Eds.), Boar Taint in Entire Male Pigs, Claus, R., Weiler, U., Cook, G., Walstra, P., Claudi-Magnussen, C., Wageningen Pers, Wageningen, pp. 104–107, EAAP Publi- 1997b. EU research programme on boar taint: accuracy of the cation No. 92. rapid measurements of androstenone and skatole comparatively
¨ Andresen, Ø, Frøystein, T., Rødbotten, M., Mortensen, H.P., to laboratory methods. In: Bonneau, M., Lundstrom, K.,
Eik-Nes, O., Lea, P., 1993. Sensoric evaluation of boar meat Malmfors, B. (Eds.), Boar Taint in Entire Male Pigs, Wagen-with different levels of androstenone and skatole. In: Bonneau, ingen Pers, Wageningen, pp. 7–10, EAAP Publication No. 92. M. (Ed.), Measurement and Prevention of Boar Taint in Entire Dehnhard, M., Claus, R., Hillenbrand, M., Herzog, A., 1993. Male Pigs, INRA, Paris, pp. 69–74, Les Colloques No. 60. High-performance liquid chromatographic method for the Annor-Frempong, I.E., Nute, G.R., Whittington, F.W., Wood, J.D., determination of 3-methyl-indole (skatole) and indole in
adip-1997. The problem of taint in pork. III. Odour profile of pork ose tissue of pigs. J. Chromatogr. 616, 205–209.
fat and the interrelationships between androstenone, skatole Desmoulin, B., Bonneau, M., Frouin, A., Bidard, J.P., 1982. and indole concentrations. Meat Sci. 47, 63–76. Consumer testing of pork and processed meat from boars: the
¨
Babol, J., Squires, E.J., Lundstrom, K., 1997. Relationship be- influence of fat androstenone level. Livest. Prod. Sci. 9, 707– tween metabolism of androstenone and skatole. In: Bonneau, 715.
¨
M., Lundstrom, K., Malmfors, B. (Eds.), Boar Taint in Entire Dijksterhuis, G.B., Engel, B., Walstra, P., Font i Furnols, M., Male Pigs, Wageningen Pers, Wageningen, pp. 62–65, EAAP Agerhem, H., Fischer, K., Oliver, M.A., Claudi-Magnussen, C.,
´
¨
EC-Regulation No. 3220 / 84, 1984, for the assessment of the Lundstrom, K., Malmfors, B., Malmfors, G., Stern, S., Petersson, Community scale for grading pig carcases, amended by Regu- H., Mortensen, A.B., Sørensen, S.E., 1988. Skatole, andros-lation (EC) No. 3513 / 93, 1993. tenone and taint in boars fed two different diets. Livest. Prod. EC-Regulation No. 2967 / 85, 1985, laying down detailed rules for Sci. 18, 55–67.
the application of the Community scale for grading pig Malmfors, B., Lundstrom, K., Hansson, I., 1978. Interrelations¨ carcases, amended by Regulation (EC) No. 3127 / 94, 1994. between boar taint, 5a-androstenone and fatty acid composition
¨
Falkenberg, H., Blodow, G., 1981. Investigations on the 5a- in pigs. Swedish J. Agric. Res. 8, 161–169.
androst-16-en-3-on content in young boars and its relations to Matthews, K.R., Homer, D.B., Punter, P., Beague, M.-P., Gispert,´ fattening and slaughter performances. Arch. Tierzucht. 24, M., Kempster, A.J., Agerhem, H., Claudi-Magnussen, C., 521–532.
Fischer, K., Siret, F., Leask, H., Font i Furnols, M., Bonneau, Hansen, L.L., 1998. Influence of environmental factors and
M., 1999. An international study on the importance of andros-antibiotics on saktole in pigs. In: Klinth-Jensen, W. (Ed.),
tenone and skatole for boar taint: III. Consumer survey in Skatole and Boar Taint, Danish Meat Research Institute,
seven European countries. Meat Sci. (in press). Roskilde, Denmark, pp. 137–150.
Mortensen, A.B., Sørensen, S.E., 1984. Relationship between boar Hansen, L.L., Larsen, A.E., Jensen, B.B., Hansen-Møller, J.,
taint and skatole determined with a new analysis method. In: Barton-Gade, P., 1993. Influence of stocking rate and
tempera-Proc. 30th Eur. Meeting Meat Res. Workers, Bristol, pp. 394– ture on faeces deposition in the pen and its consequences on
396. skatole concentration in subcutaneous fat. In: Bonneau, M.
Mortensen, A.B., Bejerholm, C., Pedersen, J.K., 1986. Consumer (Ed.), Measurement and Prevention of Boar Taint in Entire
test of meat from entire males, in relation to skatole in backfat. Male Pigs, INRA, Paris, pp. 151–157, Les Colloques No. 60.
In: Proc. 32nd EMMRW, Ghent, Belgium I, pp. 23–26. Hansen-Møller, J., 1994. Rapid high-performance liquid
chro-Mortensen, H.P., 1988. Causes with regard to increased levels of matographic method for simultaneous determination of
andros-skatole in entire male pigs–preliminary remarks. Arbejde nr. tenone, skatole and indole in back fat from pigs. J. Chromatogr.
02.538–Notat. Slagteriernes Forskningsinstitut, Roskilde. 666, 219–230.
Moss, B., Beattie, V.E., Weatherup, N., 1997. Effect of increasing Hansen-Møller, J., Andersen, J.R., 1994. Boar taint–analytical
alternatives. Fleischwirtsch. 74, 766–768. slaughter weight on meat quality and boar taint. In: Bonneau,
¨ ¨
Hansson, K.-E., Lundstrom, K., Fjelkner-Modig, S., Persson, J., M., Lundstrom, K., Malmfors, B. (Eds.), Boar Taint in Entire 1980. The importance of androstenone and skatole for boar Male Pigs, Wageningen Pers, Wageningen, pp. 100–103, EAAP taint. Swed. J. Agric. Res. 10, 167–173. Publication No. 92.
Hennessy, D., Salvatore, L., Sali, L., 1995. Incidence and nature Neupert, B., Claus, R., Herbert, E., Weiler, U., 1995. Influence of of boar taint in Australian pigs. In: Proc. Meeting EAAP sex, energy supply and light on fattening traits and carcass Working Group Production and Utilisation of Meat from Entire composition and their relation to androstenone and skatole
¨
Male Pigs, Milton Keynes, UK, Session III, 5 pp. concentrations in adipose tissue of pigs. Zuchtungskunde 67, Hoppenbrock, K.H., 1993. Problems of the calculation of the 317–331.
profitability. Mitt. blatt Kulmbach 120 (32), 147–149. Neyman, J., Scott, E.L., 1960. Correction for bias introduced by a Keller, K., Wicke, M., Von Lengerken, G., 1997. Influencing the transformation of variables. Ann. Math. Stat. 31, 643–655.
androstenone concentration of entire male pigs by mating AI Oehrle, K.L., 1977. Specific thin-layer chromatographic determi-boars with known fat androstenone level. In: Bonneau, M., nation of trienic steroids and oestrogens in feedstuffs and urine
¨
Lundstrom, K., Malmfors, B. (Eds.), Boar Taint in Entire Male of calves with special reference to the dansyl reaction. Diss. ¨
Pigs, Wageningen Pers, Wageningen, pp. 119–122, EAAP rer. nat. TU Munchen, Weihenstephan.
Publication No. 92. Patterson, R.L.S., 1968. 5a-Androst-16-ene-3-one: Compound Kjeldsen, N., 1993. Practical experience with production and responsible for taint in boar fat. J. Sci. Food Agric. 19, 31–38. slaughter of entire male pigs. In: Bonneau, M. (Ed.), Measure- Seth, G. Von., Petersson, H., Tornberg, E., 1995. The influence of ment and Prevention of Boar Taint in Entire Male Pigs, INRA, slaughter-weight, feeding intensity and lysine level on the Paris, pp. 137–144, Les Colloques No. 60. content of androstenone and skatole and on the sensory LeDenmat, M., Hervo, N., Vaudelet, J.C., Bonneau, M., 1993. The properties of meat from entire males. In: Proc. Meeting EAAP effect of slaughter weight on fat androstenone and skatole Working Group Production and Utilisation of Meat from Entire levels and on the assessment of boar taint in entire male pigs. Male Pigs, Milton Keynes, UK, 6 pp, Session III.
¨
In: Bonneau, M. (Ed.), Measurement and Prevention of Boar Stamer, S., Nurnberg, K., Kanitz, W., Kalm, E., 1993. Assessment Taint in Entire Male Pigs, INRA, Paris, pp. 167–171, Les of boar taint by androstenone and skatole levels and organolep-Colloques No. 60. tic tests. In: Bonneau, M. (Ed.), Measurement and Prevention
¨
Lundstrom, K., Malmfors, B., 1993. Skatole levels as affected by of Boar Taint in Entire Male Pigs, INRA, Paris, pp. 87–92, Les inheritance and season. In: 39th ICoMST, Calgary, Canada, 6 Colloques No. 60.
pp, File: S2P13.WP. Støier, S., 1994. Deviating smell in Danish entire male pigs– ¨
Production and Utilisation of Meat from Entire Male Pigs, Working Group on Production and Utilisation of Meat from Milton Keynes, UK, 5 pp, Session III. Entire Male Pigs. Milton Keynes, United Kingdom, 6 pp, Vold, E., 1970. Meat production properties in entire male pigs and Session III.
castrates. IV. Organoleptic and gas chromatographic inves- Walstra, P., Engel, B., Mateman, G., 1986. The androstenone– tigations of steam volatile compounds of backfat of entire male skatole dilemma as applied in a consumer test. In: Proc. 32nd pigs. Meldinger fra Norges Landbrukshøgskole 49 (16), 25 pp. EMMRW, Ghent, Belgium I, pp. 27–29.
Walstra, P., Maarse, H., 1970. Investigation into sex odour of Weiler, U., Dehnhard, M., Herbert, E., Claus, R., 1995. Influence entire male pigs. IVO-Rapport C-147 (Sept.), 30 pp. of sex, genotype and weight at slaughter on the androstenone Walstra, P., Vermeer, A.W., 1993. Aspects of micro and macro and skatole concentrations in adipose tissue from fattening economics in the production of young boars. In: 44th Meeting pigs. In: Die Ebermast. Schriftenreihe des Bundesministeriums
¨ ¨
EAAP, Aarhus, Denmark, 9 pp, P2.2. fur Ernahrung, Landwirtschaft und Forsten. Reihe A: Walstra, P., Garssen, G.J., 1995. Influence of quality of the pigs Angewandte Wissenschaft Heft 449, 14–32.