Applying Kansei Engineering, the Kano model and
QFD to services
Markus Hartono*
Department of Industrial Engineering, University of Surabaya,
Jalan Raya Kalirungkut, Tenggilis, Surabaya, 60293, Indonesia Fax: +62-31-298-1376
E-mail: [email protected] *Corresponding author
Tan Kay Chuan and John Brian Peacock
Department of Industrial and Systems Engineering, National University of Singapore,
1 Engineering Drive 2, 117576, Singapore E-mail: [email protected]
E-mail: [email protected]
Abstract: This paper aims to present an integrative framework of Kansei Engineering (KE), the Kano model and quality function deployment (QFD) applied to services. An empirical study involving Indonesian and Singaporean tourists was conducted to showcase the framework’s applicability. The study utilises a sample of 100 Indonesian and 125 Singaporean tourists who stayed in luxury hotels and covers only services in luxury hotels. Interviews and face-to-face questionnaire surveys were carried out. Using stepwise linear regression analysis, this research models the effect of perceived hotel service performance on customer emotional needs (Kansei). House of quality (HOQ) is then used to formulate managerial strategies. We present the fruitfulness of integrating the Kano model, KE and QFD. Perceived attractive qualities have a direct significant impact on Kansei response. There is no analysis of the impact of cultural differences on Kansei. We provide insight on which service attributes deserve more attention with regard to their significant impact on customer emotions. It may guide service managers to provide and implement improvement strategies in satisfying customer emotional needs. The study proposes a unique methodology of integrative three concepts commonly used in manufacturing and service quality research to measure and model customer emotional needs.
Keywords: Kansei Engineering; the Kano model; quality function deployment; QFD; emotions; services; economics; management.
Biographical notes: Markus Hartono is an Assistant Professor in Engineering Management Research Group at the Department of Industrial Engineering, Faculty of Engineering, University of Surabaya, Indonesia. He received his BEng in Industrial Engineering from University of Surabaya, Indonesia, and MSc and PhD from National University of Singapore (NUS), Singapore in year 2005 and 2012, consecutively. In 2011, he received two prestigious awards (‘Best Paper Award’ and ‘Young Service Researcher Award’) at The 2nd International Research Symposium on Service Management (IRSSM-2) in Yogyakarta, Indonesia. Currently he is also a Certified Human Factors Professional (CHFP) issued by Board of Certification in Professional Ergonomics (BCPE), and a General Secretary of Indonesian Ergonomics Society (PEI).
Tan Kay Chuan received his PhD in Industrial Engineering and Operations Research (concentration in human factors engineering) from the Virginia Polytechnic Institute and State University, USA, in 1990. He has been with the Department of Industrial and Systems Engineering, NUS, since then. He is currently an Associate Professor and a Certified Human Factors Professional (CHFP) issued by Board of Certification in Professional Ergonomics (BCPE). His teaching expertise is in human factors engineering, engineering statistics, engineering economy, quality planning and management, and more recently service innovation and management, and Six Sigma. His research interests are in quality function deployment, quality award systems, and innovation in service design.
John Brian Peacock is an Adjunct Professor at the Department of Industrial and Systems Engineering, NUS. He received his PhD in Engineering Production from Birmingham University, UK. He is a registered Professional Engineer (PE), a Certified Professional Ergonomist (CPE), and a Fellow of the Ergonomics Society (USA). His career has included 18 years in academia, 15 years with General Motors’ vehicle design and manufacturing organisations and four years as Discipline Coordinating Scientist for the National Space Biomedical Institute/NASA. His teaching and research interests cover human factors/ergonomics, biomechanics, simulation, statistics, system safety, and socio-technical system design.
This paper is a revised and expanded version of a paper entitled ‘A proposed integrative framework of Kansei engineering and Kano model applied to services’ presented at The 2nd International Research Symposium on Service Management (IRSSM-2), Yogyakarta, Indonesia, 26–30 July 2011.
1 Introduction
factors. Inherently, emotional design and social status achievement are required to satisfy customer (Khalid and Helander, 2006).
In human factors and ergonomics, a term for emotions is known as ‘hedonomics’ (Khalid and Helander, 2006) and ‘Kansei’ (Nagamachi, 1995). Product development process involving customer emotions was initially introduced by Nagamachi in the 1970s. He introduced Kansei Engineering (KE) as a powerful product development tool. This method has been successfully adopted by Mazda Motor Corporation to design ‘Miyata’ model. This phenomenal car symbolises ‘human-machine unity’.
During service encounter and product experience, customer delight is positively linearly correlated with the performance of products and services. In some cases, however, this relationship is no longer applied (Kano et al., 1984; Chen and Chuang, 2008). Surprisingly, only a little performance and innovation might lead to significant effect on customer delight. In other words, a little provision of unexpected needs might produce significant satisfaction. The Kano model has the potential to fill out unspoken and latent needs (known as attractive quality), the satisfaction of which might lead to customer delight (Hartono and Tan, 2011b).
In dealing with customer emotional needs in services, this study presents an integrative framework of KE, the Kano model and quality function deployment (QFD). This integrative framework begins with a structured methodology to capture and measure customer Kansei. It is then followed by the Kano categorisation and proposed managerial strategies using QFD.
This paper is organised as follows. Following the introduction, a brief review of the Kano model, KE and QFD is presented. Thereafter, a proposed integrative framework and an empirical study on luxury hotel services are discussed. It is then followed by conclusion and further research recommendations.
2 Literature review
2.1 The Kano model
Kano et al. (1984) categorised customer attributes into three different types, i.e., Must-be (M), One-dimensional (O) and Attractive (A). A must-be (M) attribute refers to needs not mentioned explicitly by customers. Its presence will not lead to customer delight. A lack of it, however, will result in dissatisfaction. A friendly receptionist in a hotel is a common example. A one-dimensional (O) attribute explains the spoken needs of customer. The more it is fulfilled, the more customers are satisfied. An example of it is that express check-in process in hotels. It then comes to attractive attribute (A). This attractive category goes beyond customer expectation and desire, which only a little fulfilment can cause a significant increase of satisfaction. Creativity and innovation are expected in this Kano’s quality. An example of this attractive attribute is free ultra-speed wireless internet in airport.
In order to determine which Kano category a particular service item falls under, the Kano questionnaire is used (Kano et al., 1984). A subject is faced with either of the following two Kano situations:
In either situation, the subject must choose one of the responses as shown in Table 1 to express his feeling of satisfaction (Kano et al., 1984; Chen and Chuang, 2008). By compiling these two responses, the service attribute can be identified as A, O, M, I, R or Q.
Table 1 The Kano evaluation table
Dysfunctional Service criteria/attributes
Satisfied It should be that way
I am indifferent
I can live
with it Dissatisfied
Satisfied Q* A A A O
Notes: *A = Attractive, O = One-dimensional, M = Must-be, I = Indifferent, R = Reverse, Q = Questionable
Source: Kano et al. (1984)
The Kano model is useful in several regards. It can be used as a prioritisation tool if a trade-off needs to be made. According to Matzler and Hinterhuber (1998), it is not very beneficial to invest in improving must-be qualifications (M), which have already achieved a satisfactory level. Must-be (M) and one-dimensional (O) qualities are less sensitive and satisfaction-driving attributes (Yang, 2011). As a consequence, they are less contributed to strong emotions (Hartono and Tan, 2011b). Given limited resources, therefore, it is recommended to prioritise attractive quality attributes.
2.2 Kansei Engineering (KE) in services
KE is a technological methodology that unites customer Kansei (feelings and emotions) with the engineering discipline (Nagamachi and Lokman, 2011). This method has a strong ability to capture and translate customer emotions into concrete design parameters (Nagamachi and Imada, 1995; Nagamachi, 2002; Nagamachi et al., 2009; Schütte et al., 2004). In addition, KE is able to optimise product properties that are not directly visible, such as the atmosphere of a concert hall (Schütte et al., 2008).
Traditional KE focuses on physical products. In today’s complex environments, however, KE has to be capable of conducting examinations of both physical products and services in a single study (Schütte et al., 2004). For instance, in a luxury restaurant, customer emotions might be influenced not only by the cleanliness of dishes and cutleries, but also by the friendliness of staffs and accuracy of bills.
2.3 Quality function deployment (QFD)
(Lee et al., 2000). The critical part in QFD is to construct a house of quality (HOQ). It is where customer requirements meet with technical measures. HOQ serves as a product-planning matrix that consists of customer requirements, technical measures, target values and competitive analyses (see Figure 1). In short, HOQ provides useful information of target setting and improvement priority (Pawitra and Tan, 2003).
Figure 1 Elements of HOQ
Source: Hauser and Clausing (1988)
3 An integrative framework and empirical study
The idea of integrating Kano’s model into KE was discussed by Lanzotti and Tarantino (2008) and Llinares and Page (2011). However, there has been no research that analysed the relationship between service quality performance and Kansei. This research gap has been bridged by Hartono and Tan (2011b) by proposing an integrative framework of Kano’s model contribution to KE methodology. Essentially, this current study extends the work by Hartono and Tan (2011a, 2011b). It proposes an integrative framework explaining the impact of attractive service attributes on customer Kansei. It then proceeds to determine managerial actions priorities using HOQ (see Figure 2).
3.1 Selection of service domain
Luxury hotel was chosen as the service domain. The survey was conducted in luxury 4- and 5-star hotels in Singapore and Indonesia. According to Barsky and Nash (2002), luxury hotels were reported to have greater strength of emotions than any other hotel type.
3.2 Collection and selection of Kansei words
Kansei words were collected from interviews with seven tourists who stayed in luxury hotels. One of the interview responses was “…excellent stay, hotel is a little old but it is well maintained. The environment and surrounding are cozy. It is just a walking distance to the shopping downtown Orchard road, and it has an excellent Chinese restaurant…” According to this statement, the Kansei words captured were excellent, cozy and convenient. In order to obtain a broader collection of Kansei words, this process was extended to literature review of journals, magazines and other relevant sources.
There were 40 Kansei words selected. In order to obtain more structured Kansei words, these 40 words were reduced to 16 words using affinity diagram, involving five participants. These structured Kansei words were attached to questionnaire.
3.3 Participants
This study utilised face-to-face questionnaire. Pre-test was done involving experienced subjects and a KE expert. Those who stayed in luxury hotels for at least two days were the target. The interviewer explained the study objectives and unfamiliar terminologies and answered queries from the participants. In total, 225 tourists participated in this study (January 2010 – June 2010).
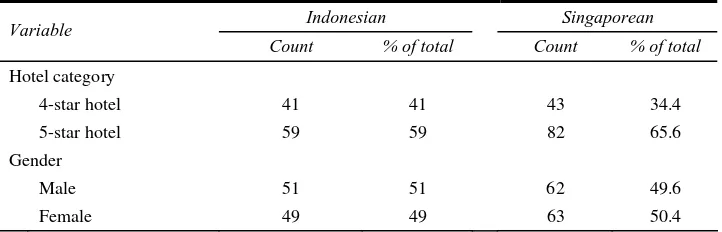
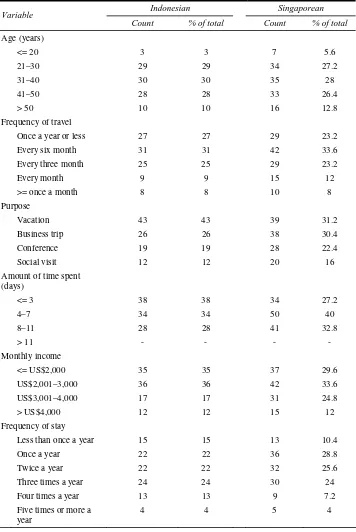
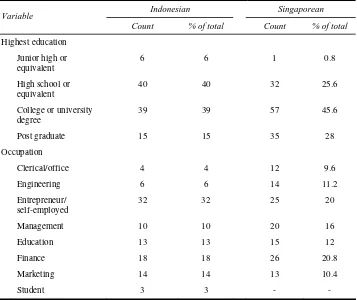
The participants were composed of 100 Indonesians (51 males and 49 females) and 125 Singaporeans (62 males and 63 females). The survey captured a balanced percentage of male and female respondents in each population group (see Table 2). Tourists aged between 31 and 40 were the largest percentage in both groups. In terms of purpose of stay, most Indonesians (43%) and Singaporeans (31.2%) indicated that they were on vacation. The longest amount of time spent was four to seven days (40% for Singaporeans), while most Indonesian tourists spent less than three days (38%).
Table 2 Profile of participants
Indonesian Singaporean
Variable
Count % of total Count % of total
Hotel category
4-star hotel 41 41 43 34.4
5-star hotel 59 59 82 65.6
Gender
Male 51 51 62 49.6
Table 2 Profile of participants (continued)
Indonesian Singaporean
Variable
Count % of total Count % of total
Age (years)
<= 20 3 3 7 5.6
21–30 29 29 34 27.2
31–40 30 30 35 28
41–50 28 28 33 26.4
> 50 10 10 16 12.8
Frequency of travel
Once a year or less 27 27 29 23.2
Every six month 31 31 42 33.6
Every three month 25 25 29 23.2
Every month 9 9 15 12
>= once a month 8 8 10 8
Purpose
Vacation 43 43 39 31.2
Business trip 26 26 38 30.4
Conference 19 19 28 22.4
Social visit 12 12 20 16
Amount of time spent (days)
<= 3 38 38 34 27.2
4–7 34 34 50 40
8–11 28 28 41 32.8
> 11 - - - -
Monthly income
<= US$2,000 35 35 37 29.6
US$2,001–3,000 36 36 42 33.6
US$3,001–4,000 17 17 31 24.8
> US$4,000 12 12 15 12
Frequency of stay
Less than once a year 15 15 13 10.4
Once a year 22 22 36 28.8
Twice a year 22 22 32 25.6
Three times a year 24 24 30 24
Four times a year 13 13 9 7.2
Five times or more a year
Table 2 Profile of participants (continued)
Indonesian Singaporean
Variable
Count % of total Count % of total
Highest education
Junior high or equivalent
6 6 1 0.8
High school or equivalent
40 40 32 25.6
College or university degree
39 39 57 45.6
Post graduate 15 15 35 28
Occupation
Clerical/office 4 4 12 9.6
Engineering 6 6 14 11.2
Entrepreneur/ self-employed
32 32 25 20
Management 10 10 20 16
Education 13 13 15 12
Finance 18 18 26 20.8
Marketing 14 14 13 10.4
Student 3 3 - -
3.4 Measures of Kansei
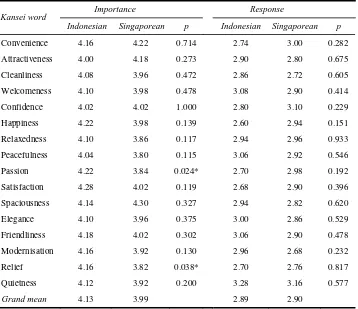
The importance and response to the Kansei words were measured using a five-point Likert semantic differential scale (Osgood et al., 1957). In order to reduce bias, relevant emoticons representing each Kansei word were provided in survey form. Emoticons are valuable addition to communication methods (Huang et al., 2008). This study utilised emoticons adopted from Yahoo! Messenger® as mentioned in the study by Huang et al. (2008) and through MSN messenger (Windows Live™ Messenger).
Table 3 Mean-values of Kansei words
Importance Response
Kansei word
Indonesian Singaporean p Indonesian Singaporean p
Convenience 4.16 4.22 0.714 2.74 3.00 0.282
Attractiveness 4.00 4.18 0.273 2.90 2.80 0.675
Cleanliness 4.08 3.96 0.472 2.86 2.72 0.605
Welcomeness 4.10 3.98 0.478 3.08 2.90 0.414
Confidence 4.02 4.02 1.000 2.80 3.10 0.229
Happiness 4.22 3.98 0.139 2.60 2.94 0.151
Relaxedness 4.10 3.86 0.117 2.94 2.96 0.933
Peacefulness 4.04 3.80 0.115 3.06 2.92 0.546
Passion 4.22 3.84 0.024* 2.70 2.98 0.192
Satisfaction 4.28 4.02 0.119 2.68 2.90 0.396
Spaciousness 4.14 4.30 0.327 2.94 2.82 0.620
Elegance 4.10 3.96 0.375 3.00 2.86 0.529
Friendliness 4.18 4.02 0.302 3.06 2.90 0.478
Modernisation 4.16 3.92 0.130 2.96 2.68 0.232
Relief 4.16 3.82 0.038* 2.70 2.76 0.817
Quietness 4.12 3.92 0.200 3.28 3.16 0.577
Grand mean 4.13 3.99 2.89 2.90
Note: *Significant at p < 0.05
3.5 Collection and evaluation of service attributes
Service attributes in luxury hotels were collected as the source of external stimuli. These service attributes referred to the SERVQUAL model (Parasuraman et al., 1988) with some modifications (Ladhari, 2009). In total, there were 39 service attributes categorised into five dimensions (Tangible, Reliability, Responsiveness, Assurance and Empathy). The result shows that up to 30% of the service attributes were categorised as Kano’s attractive quality (A), i.e., 13 out of 39 in Indonesian group and 11 out of 39 in Singaporean group. This study focused on Kano’s attractive (A) attributes. According to Yang (2011), attractive attributes provide competitive values, such as:
1 it produces little damage if there is any discrepancy 2 it serves as source of differentiation
3 it drives customer loyalty and total satisfaction.
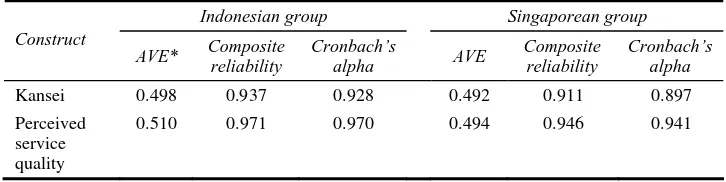
3.6 Construct validity and reliability
The proposed properties of constructs (i.e., ‘Kansei’ and ‘perceived service quality’) were tested using confirmatory factor analysis (CFA). This is to verify the factor structure of a set of observed measures (Suhr, 2006). Smart-Partial Least Square (Smart-PLS) 2.0 M3 (Ringle et al., 2005) was used. PLS makes few demands on any distributional form of measured variables and deals with small sample sizes (Chin, 1998). Three tests were reported, i.e., convergent validity, discriminant validity and reliability (see Table 4).
In terms of convergent validity, there are three criteria recommended by Fornell and Larcker (1981):
1 all item factor loadings should exceed 0.7 2 construct reliabilities should exceed 0.7
3 average variance extracted (AVE) of construct should exceed 0.5.
According to Chin (1998) and Hulland (1999), a loading of 0.5 can be used as a cut-off point. Based on the PLS output, all items of ‘Kansei’ construct had loadings above 0.5 except for the item ‘Passion’ (0.226) in Indonesian sample. As a consequence, this item was deleted. All items of ‘perceived service quality’ construct had loadings above 0.5 for both population groups. Overall, these two constructs had acceptable composite reliability and AVE values.
Regarding discriminant validity, two options are recommended (Gefen and Straub, 2005):
1 the square root of AVE for a particular construct must be greater than its corresponding inter-construct correlation coefficient
2 the loadings for the within-construct must exceed the inter-construct cross loadings by at least 0.1.
In both population groups, the constructs ‘Kansei’ and ‘perceived service quality’ showed acceptable discriminant validity.
Reliability is used to evaluate the internal consistency of a construct. Cronbach’s alpha and composite reliability are used (Gorla et al., 2010). A Cronbach’s alpha of 0.6 is deemed to be acceptable value of reliability (Nunnally, 1978; Churchill, 1979). These constructs ‘Kansei’ and ‘perceived service quality’ showed acceptable reliability.
Since the three tests were satisfied, the ‘Kansei’ and ‘perceived service quality’ constructs were assumed to be valid and reliable.
Table 4 Measurement of constructs
Indonesian group Singaporean group Construct
AVE* Composite reliability
Cronbach’s
alpha AVE
Composite reliability
Cronbach’s alpha
Kansei 0.498 0.937 0.928 0.492 0.911 0.897
Perceived service quality
0.510 0.971 0.970 0.494 0.946 0.941
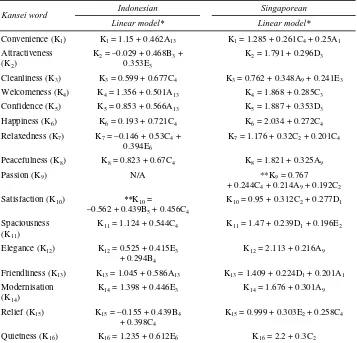
3.7 Model fitting: link and evaluation
The perceived service quality with ‘A’ category and the Kansei response were linked and modelled using stepwise linear regression (Efroymson, 1960). In each model, a five-point Likert score to each Kansei word and perceived service attribute, were used as dependent and independent variables, respectively (see Table 5). There was no significant model (N/A) for Kansei ‘Passion’ at Indonesian group since this ‘Passion’ item was deleted due to poor factor loadings (< 0.5).
Table 5 Significant Kansei model
Indonesian Singaporean Kansei word
Linear model* Linear model*
Convenience (K1) K1 = 1.15 + 0.462A13 K1 = 1.285 + 0.261C4 + 0.25A1
Notes: *Significant at p < 0.05. The names of service attribute are shown in Table 6. **The most significant model.
The most significant models were Kansei words ‘Satisfaction’ (p-value ≤ 0.01, R2 = 0.426) and ‘Passion’ (p-value≤0.01, R2 = 0.28) for the Indonesian and Singaporean groups, respectively. Both models show that the service attribute ‘Response to customer’s request’ (C4) had a slightly greater significant effect on Kansei. In other words, this result
reports that this service attribute (C4) was a more important predictor of Kansei
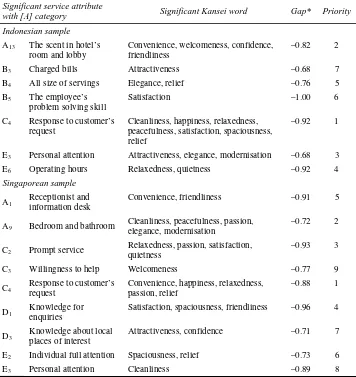
3.8 Analysis of action
This refers to the reverse of the significant models. The objective is to see the extent to which service attributes influence particular Kansei. By referring to the significant models, the reversed models were performed (see Table 6).
By taking into account the attractive service attributes (A) and the service gap scores; the next step was to decide appropriate action of continuous improvement and maintenance (see Hartono and Tan, 2011b). Since these service gaps were negative for both population groups, the actions were directed to the prioritised continuous improvement (see the ‘Priority’ column in Table 6). Both population groups shared the same significant service attribute for their first prioritised continuous improvement, i.e., ‘Response to customer’s request’ (C4). This service item was dominant to customer
Kansei. Happiness, relaxedness and relief tended to be the common Kansei for both population groups.
Table 6 Reversed significant Kansei model together with prioritised continuous improvement
Significant service attribute
with [A] category Significant Kansei word Gap* Priority
Indonesian sample A13 The scent in hotel’s
room and lobby
Convenience, welcomeness, confidence, friendliness
–0.82 2
B3 Charged bills Attractiveness –0.68 7
B4 All size of servings Elegance, relief –0.76 5
B5 The employee’s
problem solving skill
Satisfaction –1.00 6
C4 Response to customer’s
request
Cleanliness, happiness, relaxedness, peacefulness, satisfaction, spaciousness, relief
–0.92 1
E3 Personal attention Attractiveness, elegance, modernisation –0.68 3
E6 Operating hours Relaxedness, quietness –0.92 4
Singaporean sample
A1 Receptionist and information desk Convenience, friendliness –0.91 5
A9 Bedroom and bathroom Cleanliness, peacefulness, passion, elegance, modernisation –0.72 2
C2 Prompt service Relaxedness, passion, satisfaction, quietness –0.93 3
C3 Willingness to help Welcomeness –0.77 9
C4 Response to customer’s request Convenience, happiness, relaxedness, passion, relief –0.88 1
D1 Knowledge for enquiries Satisfaction, spaciousness, friendliness –0.96 4
D3 Knowledge about local places of interest Attractiveness, confidence –0.71 7
E2 Individual full attention Spaciousness, relief –0.73 6
Note: * Gap = perception – expectation
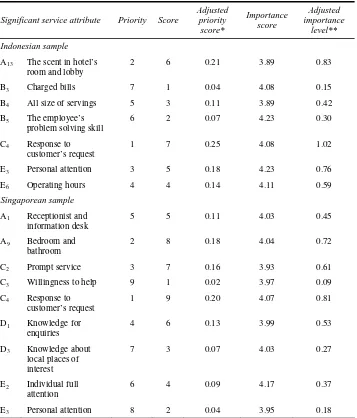
The subsequent step was to design action plans. It aimed to close the gaps between customers’ expectations and perceptions (Pawitra and Tan, 2003). An HOQ was established to develop action plans to continuously improve the weak attractive service attributes. The ‘Whats’ referred to the prioritised attractive attributes. The ‘Hows’ adopted the standards of luxury hotel services by Chang and Chen (2011).
Table 7 Adjusted importance level of ‘Whats’
Significant service attribute Priority Score
Adjusted
There were two steps done to finalise the measurement of ‘Whats’ and ‘Hows’. First, the score for each weak attractive attribute (called the ‘adjusted priority score’) was determined. The first priority service attribute was given the highest score and then normalised. For instance, at the Indonesian group, the attribute ‘C4’ was given the highest
score of 7 (see Table 7). Through normalisation, its ‘adjusted priority score’ became 0.25 [7/ (1 + 2 + 3 + 4 + 5 + 6 + 7)]. Second, we incorporated this ‘adjusted priority score’ and ‘current importance level’ to calculate ‘adjusted importance level’ score. The greater the ‘adjusted importance level’, the more important is the item.
In line with the ‘adjusted importance level’ of ‘Whats’, the importance scores of the ‘Hows’ were updated (see Figures 3 and 4). In Indonesian group, for example, ‘Response to customer’s request’ (C4) was given the highest score (1.02). This customer need
affected managerial strategies (see ‘Hows’, in Figure 3) as the following: 1 personnel management (27.26%)
2 general affairs management (19.37%) 3 employee training (21.39%)
4 customer relationship management (CRM) (15.12%) 5 additional services or facilities (6.78%).
Figure 4 HOQ using the integrated approach (Singaporean group)
4 Discussion
KE was invented in the 1970s when there was the necessity for a methodology capturing hidden emotions about products and services. It is called latent needs of customer. KE methodology is based on the semantic differentials and enhanced by adding different mathematical and service quality tools. This combined service quality tools in KE is important to deal with cases in many different purposes and contexts. This current study evaluated the existing services instead of a new service design. A focus on attractive attributes gives a deeper understanding on how to capture customers’ emotions/feelings and always to delight the customers through continuous improvements.
Affective process/affect/Kansei is the function of external stimuli (Nagamachi, 1995; Schütte et al., 2004, 2008). This study shows that perceived service quality is found to have a direct relationship with Kansei. Lin (2004) argues that when customers evaluate a servicescape, their individual perception serves a cognitive experience and stimulates their emotional responses (e.g., pleasure, arousal and dominance).
The Kano model with a focus on attractive category (delighter) is used in this study. The Kano’s attractive category is of interest to fulfil customer emotional needs/Kansei and to maximise customer overall satisfaction. According to Yang (2011), this attractive attribute provides several benefits, such as no risk if there is any discrepancy and as a source of differentiation and customer loyalty driver.
building, garden, lobby and its decorations and bedroom and bathroom. Non-physical elements of services refer to process and interaction between employees and customers, such as bill accuracy, prompt service and personal attention of staffs.
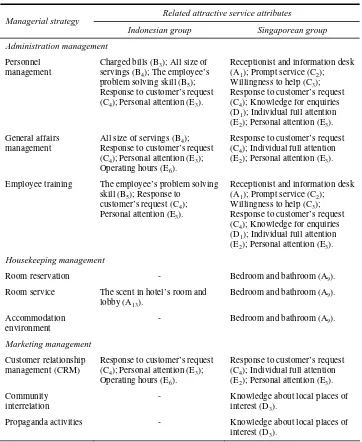
This study shows that intensive regular trainings about character building, leaderships, communication skills and focus on customers are necessary. Hotel management should assure sufficient number of staffs equipped with relevant knowledge and professionalism. To reinforce customer-delight consciousness, a campaign slogan (such as ‘Always there for customer’) might be adopted. The interaction of managerial strategies and their corresponding attractive service attributes is summarised in Table 8. Table 8 Summary of interaction between managerial strategies and service attributes
Related attractive service attributes Managerial strategy
Indonesian group Singaporean group
Administration management
Personnel management
Charged bills (B3); All size of
servings (B4); The employee’s
problem solving skill (B5);
Response to customer’s request (C4); Personal attention (E3).
Receptionist and information desk (A1); Prompt service (C2);
Willingness to help (C3);
Response to customer’s request (C4); Knowledge for enquiries
(D1); Individual full attention
(E2); Personal attention (E3).
General affairs management
All size of servings (B4);
Response to customer’s request (C4); Personal attention (E3);
Operating hours (E6).
Response to customer’s request (C4); Individual full attention
(E2); Personal attention (E3).
Employee training The employee’s problem solving skill (B5); Response to
customer’s request (C4);
Personal attention (E3).
Receptionist and information desk (A1); Prompt service (C2);
Willingness to help (C3);
Response to customer’s request (C4); Knowledge for enquiries
(D1); Individual full attention
(E2); Personal attention (E3).
Housekeeping management
Room reservation - Bedroom and bathroom (A9).
Room service The scent in hotel’s room and lobby (A13).
Response to customer’s request (C4); Personal attention (E3);
Operating hours (E6).
Response to customer’s request (C4); Individual full attention
(E2); Personal attention (E3).
Community interrelation
- Knowledge about local places of interest (D3).
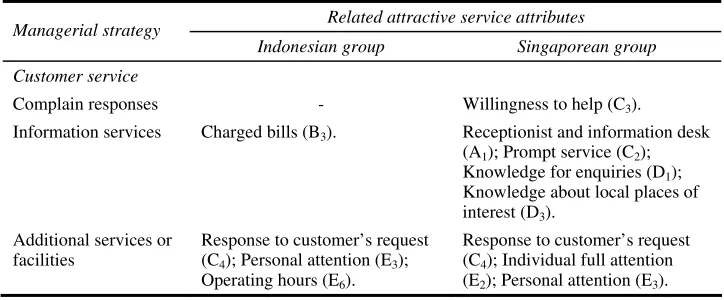
Table 8 Summary of interaction between managerial strategies and service attributes (continued)
Related attractive service attributes Managerial strategy
Indonesian group Singaporean group
Customer service
Complain responses - Willingness to help (C3).
Information services Charged bills (B3). Receptionist and information desk
(A1); Prompt service (C2);
Knowledge for enquiries (D1);
Knowledge about local places of interest (D3).
Additional services or facilities
Response to customer’s request (C4); Personal attention (E3);
Operating hours (E6).
Response to customer’s request (C4); Individual full attention
(E2); Personal attention (E3).
Another finding shows that Indonesian tourists concerned more on reliability, whereas Singaporeans put more attention on responsiveness. In other words, most Indonesian perceived proper and effective services, while Singaporean perceived responsive and prompt services. Both population groups responded more on customer-employee interaction rather than ‘servicescape’.
5 Conclusions and further research recommendation
The Kano model helps to identify different categories of service performance. The Kano attractive service attributes (A) can fulfil customer Kansei and overall satisfaction. An integrative framework of Kano’s model, KE and QFD has been tested through an empirical study on luxury hotel services. The result shows that perceived service attributes impacted on Kansei. The more influence on Kansei words, the more important are service attributes.
This study provides two contributions. As for theoretical and methodological contribution, this study showcases the fruitfulness of integrating Kano’s model, KE and QFD in providing in a more structured and formalised methodology. This methodology captures customer emotions and links them to service attributes performance. As for practical contribution, this study helps service designers and managers identify what efforts to be taken for continuous improvement and maintenance.
This research is subject to limitations. The survey covered only luxury hotel services and involved Indonesian and Singaporean tourists. Further research should focus on applying this integrative framework to other prospective service domains (e.g., high-end tourism industries). In addition, it might take into account cultural differences effects on Kansei.
References
Akao, Y. and Mazur, G.H. (2003) ‘The leading edge in QFD: past, present, and future’, International Journal of Quality & Reliability Management, Vol. 20, No. 1, pp.20-35.
Chang, K-C. and Chen, M-C. (2011) ‘Applying the Kano model and QFD to explore customers’ brand contacts in the hotel business: a study of a hot spring hotel’, Total Quality Management & Business Excellence, Vol. 22, No. 1, pp.1–27.
Chen, C-C. and Chuang, M-C. (2008) ‘Integrating the Kano model into a robust design approach to enhance customer satisfaction with product design’, International Journal of Production Economics, Vol. 114, No. 2, pp.667–681.
Chin, W.W. (1998) ‘The partial least squares approach to structural equation modeling’, in Marcoulides, G.A. (Ed.): Modern Methods for Business Research, pp.295–336, Erlbaum, Mahwah, NJ.
Churchill, G. (1979) ‘A paradigm for developing better measures for marketing constructs’, Journal of Marketing Research, Vol. 16, No. 1, pp.64–73.
Efroymson, M.A. (1960) ‘Multiple regression analysis’, in Ralston, A. and Wilf, H.S. (Eds.): Mathematical Methods for Digital Computers, pp.191–203, Wiley, New York.
Fornell, C. and Larcker, D.F. (1981) ‘Evaluating structural equation models with unobservable variables and measurement error’, Journal of Marketing Research, Vol. 18, No. 1,pp.39–50. Gefen, D. and Straub, D. (2005) ‘A practical guide to factorial validity using PLS-graph: tutorial
and annotated example’, Communications of the Association for Information Systems, Vol. 16, No. 5, pp.91–109.
Gorla, N., Somers, T.M. and Wong, B. (2010) ‘Organizational impact of system quality, information quality, and service quality’, Journal of Strategic Information Systems, Vol. 19, No. 3, pp.207–228.
Hartono, M. and Tan, K.C. (2011a) ‘A proposed integrative framework of Kansei Engineering and Kano model applied to services’, in The 2nd International Research Symposium on Service Management (IRSSM-2) Proceedings of the International Symposium in Yogyakarta, Indonesia, 2011, Universitas Pembangunan Nasional ‘Veteran’ Yogyakarta, Indonesia, pp.484–492.
Hartono, M. and Tan, K.C. (2011b) ‘How the Kano model contributes to Kansei Engineering in services’, Ergonomics, Vol. 54, No. 11, pp.987–1004.
Hauser, J.R. and Clausing, D. (1988) ‘The house of quality’, The Harvard Business Review, Vol. 66, No. 3, pp.63–73.
Huang, A.H., Yen, D.C. and Zhang, X. (2008) ‘Exploring the potential effects of emoticons’, Information & Management,Vol. 45, No. 7, pp.466–473.
Hulland, J. (1999) ‘Use of partial least squares (PLS) in strategic management research: a review of four recent studies’, Strategic Management Journal,Vol. 20, No. 2, pp.195–204.
Jordan, P.W. (2002) How to Make Brilliant Stuff that People Love and Make a Big Money Out of It, John Wiley and Sons, Chichester.
Kano, K.H., Hinterhuber, H.H., Bailon, F. and Sauerwein, E. (1984) ‘How to delight your customers’, Journal of Product and Brand Management, Vol. 5, No. 2, pp.6–17.
Khalid, H.M. and Helander, M.G. (2006), ‘Customer emotional needs in product design’, Concurrent Engineering: Research and Applications,Vol. 14, No. 3, pp.197–206.
Ladhari, R. (2009) ‘Service quality, emotional satisfaction, and behavioral intentions: a study in the hotel industry’, Managing Service Quality,Vol. 19, No. 3, pp.308–331.
Lanzotti, A. and Tarantino, P. (2008), ‘Kansei engineering approach for total quality design and continuous innovation’, Total Quality Management Journal, Vol. 20, No. 4, pp.324–337. Lee, S.F., Lo, K.K., Leung, R.F. and Sai, A.O.K. (2000) ‘Strategy formulation framework for
vocational education: integrating SWOT analysis, balanced scorecard, QFD methodology and MBNA education criteria’, Managerial Auditing Journal,Vol. 15, No. 8, pp.407–423. Lin, I.Y. (2004) ‘Evaluating a servicescape: the effect of cognition and emotion’, Hospitality
Llinares, C. and Page, A.F. (2011) ‘Kano’s model in Kansei Engineering to evaluate subjective real estate consumer preferences’, International Journal of Industrial Ergonomics,Vol. 41, No. 3, pp.233–246.
Matzler, K. and Hinterhuber, H.H. (1998) ‘How to make product development projects more successful by integrating Kano’s model of customer satisfaction into quality function deployment’, Technovation,Vol. 18, No. 1, pp.25–38.
Nagamachi, M. (1995) ‘Kansei engineering: a new ergonomic consumer-oriented technology for product development’, International Journal of Industrial Ergonomics, Vol. 15, No. 1, pp.3–11.
Nagamachi, M. (2002) ‘Kansei Engineering as a powerful consumer-oriented technology for product development’, Applied Ergonomics,Vol. 33, No. 3,pp.289–294.
Nagamachi, M. and Lokman, A.M. (2011) Innovations of Kansei Engineering,CRC Press, Boca Raton.
Nagamachi, M., Ishihara, S., Nakamura, M. and Morishima, K. (2009) ‘Kansei engineering and its application to developing new preventing bedsore mattress’ in The 17th International Ergonomics Association (IEA) 2009 Ergonomics World Congress Proceedings of the International Conference in Beijing, China, 2009, Chinese Ergonomics Society, China. Nagamachi. M. and Imada, A.S. (1995) ‘Kansei engineering: an ergonomic technology for product
development’, International Journal of Industrial Ergonomics,Vol. 15, No. 1,p.1.
Norman, D.A. (2004) Emotional Design: Why Do We Love (Or Hate) Everyday Things, Basic Books, New York.
Nunnally, J.C. (1978) Psychometric Theory, 2nd ed., McGraw-Hill, New York.
Osgood, C.E., Suci, G.J. and Tannenbaum, P.H. (1957) The Measurement of Meaning, University of Illinois Press, Illinois.
Parasuraman, A., Berry, L.L. and Zeithaml, V.A. (1988) ‘SERVQUAL: a multiple-item scale for measuring consumer perceptions of service quality’, Journal of Retailing, Vol. 64, No. 1, pp.12–40.
Pawitra, T.A. and Tan, K.C. (2003) ‘Tourist satisfaction in Singapore – a perspective from Indonesian tourists’, Managing Service Quality,Vol. 13, No. 5, pp.399–411.
Ringle, C.M., Wende, S. and Will, A. (2005) Smart PLS, University of Hamburg, Hamburg, Germany.
Schütte, S., Eklund, J., Axelsson, J.R.C. and Nagamachi, M. (2004) ‘Concepts, methods, and tools in Kansei engineering’, Theoretical Issues in Ergonomics Science,Vol. 5, No. 3, pp.214–232. Schütte, S., Eklund, J., Ishihara, S. and Nagamachi, M. (2008) ‘Affective meaning: the Kansei
engineering approach’, inSchifferstein, H.N.J. and Hekkert, P. (Eds.): Product Experience, pp.477–496, Elsevier Ltd., Oxford, UK.
Suhr, D.D. (2006) ‘Exploratory or confirmatory factor analysis?’, The 31st Annual SAS Conference (SAS Users Group International [SUGI] 31) Proceedings of the International Conference in San Fransisco, California, 2006,paper 200-31.
Sullivan, L.P. (1986) ‘Quality function deployment’, Quality Progress, Vol. 19, No. 6, pp.39–50. Tan, K.C. and Pawitra, T.A. (2001) ‘Integrating SERVQUAL and Kano’s model into QFD for
service excellence development’, Managing Service Quality,Vol. 11, No. 6, pp.418–430. Yang, C-C. (2011) ‘Identification of customer delight for quality attributes and its applications’,