On: 25 Oct ober 2011, At : 06: 04 Publisher: Taylor & Francis
I nform a Lt d Regist ered in England and Wales Regist ered Num ber: 1072954 Regist ered office: Mort im er House, 37- 41 Mort im er St reet , London W1T 3JH, UK
Ergonomics
Publicat ion det ails, including inst ruct ions f or aut hors and subscript ion inf ormat ion: ht t p: / / www. t andf online. com/ loi/ t erg20
How the Kano model contributes to Kansei engineering
in services
Markus Hart ono ab & Tan Kay Chuan a a
Depart ment of Indust rial and Syst ems Engineering, Nat ional Universit y of Singapore, Singapore
b
Depart ment of Indust rial Engineering, Universit y of Surabaya, Indonesia
Available online: 25 Oct 2011
To cite this article: Markus Hart ono & Tan Kay Chuan (2011): How t he Kano model cont ribut es t o Kansei engineering in services, Ergonomics, 54: 11, 987-1004
To link to this article: ht t p: / / dx. doi. org/ 10. 1080/ 00140139. 2011. 616229
PLEASE SCROLL DOWN FOR ARTI CLE
Full t erm s and condit ions of use: ht t p: / / w w w.t andfonline.com / page/ t erm s- and- condit ions
This art icle m ay be used for research, t eaching, and privat e st udy purposes. Any subst ant ial or syst em at ic reproduct ion, redist ribut ion, reselling, loan, sub- licensing, syst em at ic supply, or dist ribut ion in any form t o anyone is expressly forbidden.
How the Kano model contributes to Kansei engineering in services
Markus Hartonoa,b* and Tan Kay ChuanaaDepartment of Industrial and Systems Engineering, National University of Singapore, Singapore;bDepartment of Industrial
Engineering, University of Surabaya, Indonesia
(Received 18 November 2010; final version received 16 August 2011)
Recent studies show that products and services hold great appeal if they are attractively designed to elicit emotional feelings from customers. Kansei engineering (KE) has good potential to provide a competitive advantage to those able to read and translate customer affect and emotion in actual product and services. This study introduces an integrative framework of the Kano model and KE, applied to services. The Kano model was used and inserted into KE to exhibit the relationship between service attribute performance and customer emotional response. Essentially, the Kano model categorises service attribute quality into three major groups (must-be [M],
one-dimensional [O] and attractive [A]). The findings of a case study that involved 100 tourists who stayed in luxury 4- and 5-star hotels are presented. As a practical matter, this research provides insight on which service attributes deserve more attention with regard to their significant impact on customer emotional needs.
Statement of Relevance: Apart from cognitive evaluation, emotions and hedonism play a big role in service encounters. Through a focus on delighting qualities of service attributes, this research enables service providers and managers to establish the extent to which they prioritise their improvement efforts and to always satisfy their customer emotions beyond expectation.
Keywords:Kansei engineering; emotional feelings; Kano model; services
1. Introduction
Humans exhibit strong interest in products through emotion. Despite emotion being highly subjective and individualistic, Desmet (2008) was able to identify the relationship between product elements and customer expression. Products advantageous to consumers evoke pleasant emotions. As products or services are of equivalent quality in the market place, a subjective evaluation of aesthetics becomes a critical precursor to customer satisfaction. Apart from cognitive evalua-tion, emotions also play a big role in product interaction and service encounters.
Today’s customers are highly dynamic and quite demanding. They tend to be disloyal to particular products and services. Compared with their first launch, the sales of many products tend to decrease over time. This situation forces companies to reconsider their product design and development strategies (Shimizu et al. 2004). Companies must listen closely and carefully to the voices of their customers, especially their latent needs. Latent needs are the unspoken emotional needs that customers seek in products and services.
The development of products involving customer emotional needs was initially proposed by Nagamachi (1995). Nagamachi introduced Kansei engineering
(KE) as a powerful product development method, which takes into account the customer emotional needs (Kansei in Japanese). This method has been
successfully adopted by Mazda Motor Corporation for developing their Miyata model (MX5 in Europe). It symbolised ‘Human–Machine Unity’ (Jinba-Ittaiin Japanese) (Nagamachi 1995). The eminence of this method lies in its abilities to quantify customers’ Kansei needs and to build a quantitative relationship between these emotional needs and the design features of a product.
In many cases, the voice of customer is an important component for new product/service
development and the innovation process. A great deal of resources (working hours, methods and tools) is involved during the complex process. Since a few decades ago, the focus of business management and research has been intensively on customer satisfaction. In today’s competitive business environment, however, to satisfy customers is not sufficient. Rather, how to delight our customers has become a prominent issue for long-term business success (Yang 2011). Hence, companies must intensively strive for total customer satisfaction and loyalty to win over the competition (Schneider and Bowen 1999). In other words, there
*Corresponding author. Email: [email protected] Vol. 54, No. 11, November 2011, 987–1004
ISSN 0014-0139 print/ISSN 1366-5847 online
Ó2011 Taylor & Francis
http://dx.doi.org/10.1080/00140139.2011.616229 http://www.tandfonline.com
would be a competitive advantage for a company, which always focuses on desired attributes with the fulfilment of unexpected and memorable experiences to customers (Yang 2011).
The question is asked, ‘What design features really do have great impact on customer emotional needs and evoke a great deal of delight?’ Logically, customer impression is positively, linearly related to improved product or service features. However, in some cases, the relationship between product quality and customer impression is no longer linear (Kanoet al. 1984, Chen and Chuang 2008). As a consequence, continuous or even radical improvement on certain product or service attributes without intensively considering what custo-mers desire, might not be sufficient. Contrast this to a situation where only a little innovation might lead to a large amount of customer delight. The Kano model has the potential to eke out unspoken or latent human needs, the satisfaction of which might lead to customer delight. Delighted customers will remain loyal and refer favourably to others about the company and its services or products.
According to Kano et al. (1984), the Kano model provides the categorisation of customer needs into three major groups (i.e. must-be [M], one-dimensional [O] and attractive [A]). A brief explanation of each of these groups is discussed in section 2.1. This model provides a unique way of distinguishing the impact of different customer needs (voice of customer) on total customer satisfaction in the early stage of product/ service development (Rahardjo 2007). In highly competitive market place, companies need to create and offer product/service attributes targeted specifi-cally at exciting customers and over-satisfying them (Tan and Pawitra 2001). Not only does the Kano model promotes understanding of product/service requirements, but also provides valuable guidance in trade-off situation due to technical and financial reasons (Matzler and Hinterhuber 1998). In this situation, the attractive attributes should be treated carefully as they are the key to beating the competition in the market place (Tan and Pawitra 2001).
The Kano model has shown its contribution to quality fields such as integrating it with quality function deployment (QFD) (Tan and Pawitra 2001), the dynamics of Kano in design for six sigma (Rahardjo 2007) and the role of Kano’s model in robust design (Chen and Chuang 2008). In line with developments of the Kano model, KE has also a strong ability to integrate with other statistical and quality tools (Schu¨tte 2002). A recent study by Lanzotti and Tarantino (2008) addressed the issue of KE and other methods in the field of quality design.
There is no formal methodology, however, to investigate the contribution of the Kano model on
KE. Therefore, to fill in this niche, this study proposes two objectives. The first is to develop an integrative framework of the Kano model and KE in services. This research will show the applicability of modified KE in services, apart from products. The second objective is to conduct a preliminary test of this proposed framework by taking a case study on luxury hotel services in Singapore and Indonesia. The Kano model is incorporated into the KE methodology as an enhancement tool that can determine the performance level of service attributes. Specifically, the proposed integrative framework will provide insights to service designers to not only be able to classify the service attributes, but also to prioritise the improvement of service attributes taking into account the impact on customer emotional needs/ Kansei.
This article is organised as follows. Following the introduction, a short literature review of the Kano model and KE is presented. Thereafter, a proposed integrative framework of the Kano model and KE as the key contributions of this article is presented. In order to provide practical insight, an empirical study on luxury hotel services is provided in the next section. Then comes the discussion and implications sections.
2. Literature review
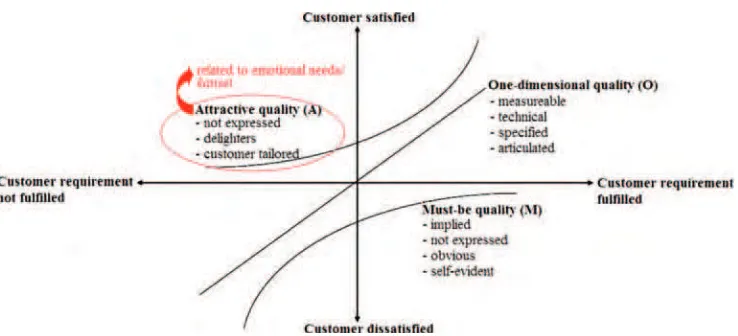
2.1. The Kano model and its potential benefits Inherently, the Kano model categorises customer attributes into three different types, namely, must-be (M), one-dimensional (O) and attractive (A). A must-be (M) or basic attribute is related to something taken for granted and not mentioned explicitly by customers. The absence will cause significant dissatisfaction while the existence will not give any significant impression. A provision of toilet papers in hotel restroom is a common example. Late availability of them brings complaints from customers. A one-dimensional (O) attribute shows the linearity relationship between customer satisfaction and performance of the attribute. The better the performance, the higher the level of customer satisfaction is. For instance, a faster hotel check-in process results in higher customer
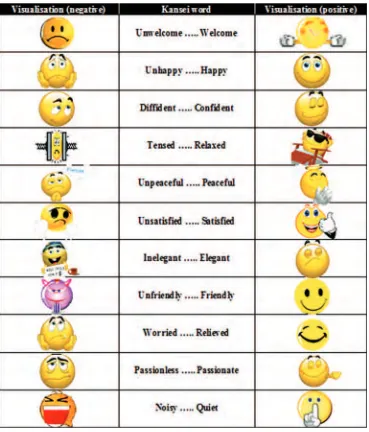
satisfaction. While the attractive (A) attribute, known as delighter, is beyond customer expectation. A little fulfilment on it brings a great deal of satisfaction. Free wireless internet access in a hotel is an example of this attribute. Figure 1 shows the visualisation of these three categories.
Five approaches are valid and reliable in categorising product/service attributes in the Kano model (Mikulic´ and Prebezˇac 2011) such as ‘Kano’s questionnaire’, ‘penalty-reward contrast analysis’, ‘importance grid’, ‘qualitative data methods’ and
‘direct classification’. According to their findings, only the Kano’s questionnaire and the direct classification methods are capable of classifying Kano attributes in the product/service development phase.
Inherently, the Kano model is similar to the Herzberg’s motivation-hygiene theory inspired by the Maslow’s theory of a need hierarchy (Maslow 1943). The characteristic of Kano’s and Herzberg’s models is that a reminder that in working to satisfy customers, it is highly required to minimise customer dissatisfaction. According to a study by Herzberg (1968) which involved 1685 employees, there have been two major classifications of employee satisfaction generator. They were (i) motivator (satisfier) which refers to achievement, recognition, work itself, responsibility, advancement and growth; and (ii) hygiene factor (dissatisfaction-avoidance) that concerns company policy, supervision, relationship with boss, work conditions, salary and relationship with peers. Job characteristics related to motivator factors will lead to employee satisfaction and happiness. However, similar to Kano’s attractive category, the absence of such gratifying jobs will not appear to lead to dissatisfaction. Instead, the unfavourable assessments of jobs concerning the hygiene factor will cause dissatisfaction. Clearly, the improved hygiene factors will not lead to any significant increase in employee satisfaction. Thus, a company should promote self-enhancement jobs rather than administration-related jobs in order to achieve a high level of employee satisfaction.
The Kano model concerns quality for customer, whereas Herzberg focuses more on the relationship between the employer and the employees within an organisation. Kano named the Herzberg’s motivation-hygiene theory as the quality’s M-H theory and redefined it as attractive and must-be qualities (Lee
and Chen 2006). Basically, Kano has three main satisfaction drivers (attractive [A], must-be [M] and one-dimensional [O]), whereas Herzberg has two main satisfaction drivers (hygiene and motivator). Kano typically completed the Herzberg model by
incorporating a diagonal line moving from southwest to northeast that refers to linearity of satisfaction level (known as one-dimensional). In general, the Kano model provides a formal methodology as a unique way of distinguishing the impact of different customer needs (i.e. the voice of customer) on total customer satisfaction in the very early stage of product/service development. Moreover, this method has been incorporated into an existing quality tool (such as QFD) in fitting accurate customer needs (Tan and Pawitra 2001). This refined Kano method has a wider scope than Herzberg’s model, since it has been applied intensively and widely in products and services (see, Shenet al. 2000, Tan and Pawitra 2001). According to Wittel and Fundin (2005), the
Kano model is potentially used to determine the dynamics of customer needs. Rahardjo (2007) proposed a study to quantitatively model the limited historical data, which are derived from the results of Kano questionnaires, in order to forecast the future Kano’s category for each of the quality attributes.
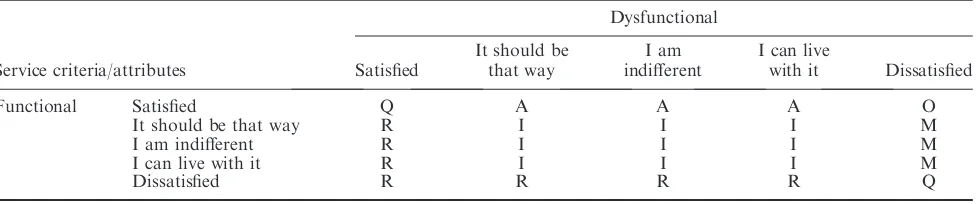
In identifying which Kano category a particular service attribute falls under, the Kano questionnaire is used (Kanoet al. 1984). A subject is faced with two Kano situations. The first is where the quality of the service attribute is present or functional. The second situation is where the quality of the service attribute is absent or insufficient or dysfunctional. In either situation, the subject must choose one of the responses as shown in Table 1 to express his feeling of
satisfaction (Kanoet al. 1984, Chen and Chuang Figure 1. Where Kansei potentially affected by Kano quality categorisation is, modified from Bergeret al. (1993).
2008). By integrating these two responses, the service attribute criterion can be identified as attractive (A), must-be (M) or one-dimensional (O).
There are two potential benefits of incorporating the Kano model into product or service development. First, it gives a better understanding of customer requirements as classified into several categories (A, O, M or I). Second, it can be used as a prioritisation tool if a trade-off needs to be made. If the improvement of certain product or service attributes cannot be effected (due to, for example, financial, technical or operational reasons), the attributes in the higher categories (e.g. attractive qualification [A]) would be given higher priority. As argued by Matzler and Hinterhuber (1998), it is not very beneficial to invest in improving must-be qualifications (M), which have already attained a satisfactory outcome.
2.2. Kansei engineering
The trend of the 21st century is in hedonism, pleasure and individuality. Such notions stimulate customers to shift their focus on hedonic ergonomics in product design rather than functionality (Helander 2003). KE has a strong ability to deal with such trends and to accommodate customer emotional needs/Kansei (Nagamachi and Imada 1995).
KE has been considered superior to other similar methods. It has the ability to translate customer emotional needs into concrete design parameters through engineering (Nagamachi 2002, Schu¨tte et al. 2004, Nagamachiet al. 2009). As a consequence, it can minimise the subjective interpretation of emotions/ Kansei. Also, this method is able to modify and optimise product properties which are not directly visible, such as the atmosphere of a concert hall or the comfort of a hospital (Schu¨tteet al. 2008). In addition, there has been some success in integrating KE with QFD (Schu¨tte et al. 2004). Llinares and Page (2011) highlight KE as an appropriate framework for linking the user perceptions expressed in words to symbolic attributes.
2.3. Kansei engineering in services
Traditional approaches of KE focus only on designing products that generate significant impact on customer emotional needs. In complex circumstances, customers experience both mixed physical and non-physical objects. For instance in a restaurant, customer emotions may be influenced not only by the cleanliness of meals and other physical/tangible stuffs, but also by the friendliness of staffs, accuracy of bills and prompt service. KE has to be capable of conducting examination of both products and services in a single study (Schu¨tteet al. 2004).
Service attributes are the causal agents for affective responses/emotions/Kansei. Emotions have been shown to play a pertinent role in many service contexts (Laros and Steenkamp 2005) such as advertisement (Derbaix 1995), customer satisfaction (Philips and Baumgartner 2002), complaint handling (Stephens and Gwinner 1998), service failure (Zeelenberg and Pieters 1999), product attitudes (Dubeet al. 2003) and loyalty (Barsky and Nash 2002). A mixture of physical, social and psychological emotions may contribute to service experiences (Tiger 1992, Desmet 2008). Laros and Steenkamp (2005) classified consumer emotions in services into three hierarchies, namely: super (both negative and positive affects); basic (e.g. anger, fear and contentment) and subordinate (e.g. angry, scared and optimistic).
Essentially, there are two kinds of service attributes (i.e. physical and non-physical attributes). What constitutes the physical part may be referred to as ‘servicescape’ (Bitner 1992) or the ‘Tangible’
dimension of the service quality (SERVQUAL) model (Parasuramanet al. 1988). Lin (2004) classified this into several parts, such as visual cues (e.g. colour, lighting and layout), auditory cues (e.g. musical and non-musical sounds) and olfactory cues (e.g. scents, ambient odours). Regarding non-physical attributes, this includes the application of specialised
competencies (knowledge and skills) through processes, activities and interaction (Lovelock 1991, Vargo and Lusch 2004).
Table 1. Kano evaluation table.
Dysfunctional
Service criteria/attributes Satisfied
It should be that way
I am indifferent
I can live
with it Dissatisfied
Functional Satisfied Q A A A O
It should be that way R I I I M
I am indifferent R I I I M
I can live with it R I I I M
Dissatisfied R R R R Q
Notes: A, attractive; O, one-dimensional; M, must-be; I, indifferent; R, reverse; Q, questionable.
3. Proposed integrative framework of the Kano model and KE
The idea of integrating Kano’s model and KE was first investigated by Lanzotti and Tarantino (2008) who took the case study of designing the interior of a train. Their study looked at the quality of product features. A recent study by Llinares and Page (2011) revealed the uses of the Kano model in analysing the impact of emotional attributes on customer purchase decision. Another similar study on investigating customer delight for quality attributes was conducted by Yang (2011). Her study developed a critical delight-driver model known as the customer-delight barometer (CDB). There is little research, however, that analysed the relationship between the category of product performance and customer emotional needs/Kansei.
This study proposes an integrative framework to explain the impact of service attributes categorised as attractive quality (A) on customer emotional needs in services. The motivation of this idea includes: (i) it will create little damage if there is any discrepancy, (ii) it will bring sources of differentiation where this per-forms well, (iii) potentially, it will drive customer loyalty and ‘Wow’ instead of eliminate problems and (iv) it will obtain total customer satisfaction (Yang 2011). According to Collins and Porras (2004), it is essential to invest in proactive and generative markets which are reflected by customer delight. Due to today’s complexity, it is worth noting that to invest potential resources (e.g. financial and technical constraints) in a proportional way is to create the best event possible (Senge 2006).
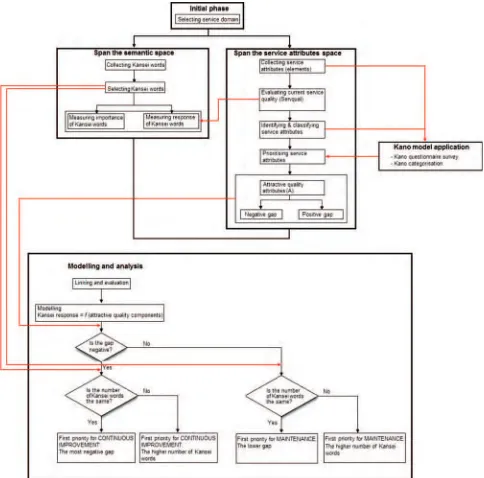
The framework consists of four phases, and is inspired by the work of Schu¨tteet al. (2004).
3.1. Initial phase
The first phase is to identify a service area/domain in which emotions and customer satisfaction play a large role. One would then need to identify the target group of users to survey.
3.2. Span the semantic space
Spanning the semantic space is also known as affective processing. This consists of three activities. The first is the collection of Kansei words. Due to the complexity of emotions interpretation, this study uses the evalua-tion of words (spoken) as the sources of emoevalua-tional impact on the human mind (i.e. Kansei words). Words can describe emotions evoked by products or services (Desmet 2003). Kansei words can be collected through magazines, pertinent literature, manuals, experts, experienced users and ideas. The second activity is the selection/structure of the Kansei words. The purpose is
to find high level Kansei words (the main category of Kansei words) that represent the service domain in question. This step can be done either manually (using, for example, affinity diagram and interview) or statistically (using, for example, factor analysis). The third activity is the measurement of the importance and response of Kansei words. This may be
accomplished by using a 5-point Semantic Differential (SD) Scale as proposed by Osgoodet al. (1957).
3.3. Span the service attribute space and the Kano model application
Spanning the service attribute space is also known as cognitive processing. Three activities are involved here. The first is the collection of service attributes through technical documents, comparison of competing services, pertinent literature, experienced users, related Kansei studies, concept studies, analysis of the usage of existing services and related service groups (Schu¨tteet al. 2008). A frequency analysis or Pareto diagram can be used to obtain the most relevant service attributes. The second activity is the evaluation of current service quality that includes the
measurement of importance, expectation, perception and gap of the service attributes. In the third activity, the Kano model is inserted. This is in order to give a better understanding of service attribute performance. The Kano questionnaire is used to classify each service attribute as attractive, one-dimensional, must-be, indifferent, questionable or reverse.
3.4. Modelling and analysis
At this stage, the semantic space is linked with the service attributes space. The selected Kansei words and the attractive service attributes (A) are met and linked together. This is facilitated by multiple linear regression (Schu¨tte 2002) or ordinal logistic regression (Lanzotti and Tarantino 2008). Afterwards, it proceeds to the analysis stage by engaging the significant models only.
Analysis is first done by checking for negative service gaps (i.e. a negative difference between perceived and expected service quality mean-values). For each negative gap, it is then checked whether the number of affected Kansei words among significant service attributes is the same. If it is the same, then the action is to choose service attributes with the most negative service gap as the first priority for
improvement. Otherwise, we choose service attributes with the higher number of Kansei words. Following similar steps, if the gap is positive, then it also checks whether the number of Kansei words among
significant service attributes is the same. If it is the
same, the next step is to choose service attributes with the lower gap as the first priority for enhancement/ maintenance; otherwise, we choose those with the higher number of Kansei words. A graphical repre-sentation of the proposed research model is provided in Figure 2.
4. Empirical study: a case in luxury hotel services 4.1. Selection of service domain
A luxury hotel type was chosen as the service domain. Services in hotel are very complex involving many
customer activities. In a hotel, people can perform all their activities and needs throughout the day.
The survey was conducted in luxury 4- and 5-star hotels in Singapore and Indonesia. Luxury hotels have relatively complete services which affect all the human senses. According to a study by Barsky and Nash (2002), luxury hotels were reported to have greater strength of emotion than any other hotel segment. In other words, they are able to give ‘wow’ factors to customers. This is in line with KE concept that all the human senses should be experienced (Nagamachi 2002). For example, when entering a hotel’s lobby
Figure 2. A proposed integrative framework of the Kano model and KE in services.
and doing a check-in process, customers’ hearing and vision are the relevant sensory systems. Furthermore, taste and smell are used to evaluate the quality of meals provided in hotel’s restaurants.
4.2. Collection and selection of Kansei words
At the initial stage, a short interview with potential subjects was conducted. The number of participants for an interview session depends on the purpose of the study. In common studies, the number of interviews is usually around 15+10 (Steinar 2007). The Kansei words were collected from interviews with seven tourists who stayed in luxury hotels. By adopting the concept of ‘contextual inquiry’, on-site interviews were carried out (i.e. at a place nearby the hotels where the tourists stayed), since this allows for a valuable customer touch opportunity. One example of an interview response was ‘. . . excellent stay, hotel is a little old but it is well maintained. The environment and surrounding are cozy. It is just a walking distance to the shopping downtown Orchard road, and it has an excellent Chinese restaurant . . .’. From the statement, the Kansei words captured were excellent, cozy, and convenient. Inherently, interview is one of the ways to collect Kansei words. The result is a list of 40 Kansei words that describe the emotional engagement between customers and hotel services. In order to obtain more manageable and relevant Kansei words, these words were reduced to 16 by using affinity diagrams. The final result was a set of refined Kansei words attached to the questionnaire.
4.3. Subjects
One hundred Indonesian tourists participated in this study. Those who stayed in luxury hotels for at least two days were targeted. A face-to-face questionnaire was used. The interviewer explained the study objective and some unfamiliar terminology, and answered any relevant queries from the participants. They were asked for their responses based on questions in the paper survey, and these were recorded by the interviewer. This process took around 20 min per subject.
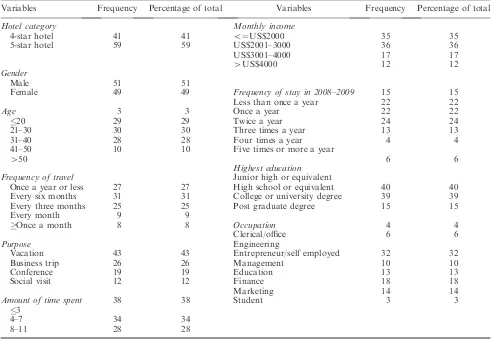
The gender split was 51% males and 49% females, while the hotel category composition was 41% 4-star and 59% 5-star. The average age was at a range of 31–40 years. Their household monthly incomes ranged from less than US$2000 (35 of the sample) to over US$4000 (12% of the sample). The most frequently encountered income range was US$2001 to US$3000 (36% of the sample). Regarding the frequency of travel, over 30% of the participants travelled once every six months. The most frequent purpose for the
stay at the hotel was for vacation (43% of respondents) with less than or equal to three days for the majority of the respondents (38% of the sample). In terms of the highest education level, 39% of the respondents indicated that they were college or university degree holders. Most of them were entrepreneur/self-employed (32% of the sample). The details of the respondent profile are shown in Table 2.
4.4. Measurement of Kansei response and importance Kansei responses and importances were collected using a five-point Likert semantic differential scale (Osgood et al. 1957). Participants were asked to rate the importance of the emotional needs/Kansei of hotel services using the same scale (1¼‘not at all important’ and 5 ¼‘absolutely important’). In addition, with respect to experience in hotel services, they were asked to rate the fulfilment (response) of emotional needs/ Kansei on the same scale (1¼‘absolutely to negative Kansei’ and 5¼‘absolutely to positive Kansei’).
In order to reduce the bias/misinterpretation influenced potentially by a language barrier, graphical emoticons representing each Kansei word were attached to the survey form. An emoticon is a graphical icon that expresses emotion and is language-independent. It can eliminate some
difficulties in expressing emotions using words. Thus, this tool is a valuable addition to the communication process (Huanget al. 2008). Emoticons convey voice inflections, facial expressions and bodily gestures without any language distraction. According to Huang et al. (2008), the use of emoticons also correlates with direct personal interaction (i.e. it allows people to express their emotions easily, freely and quickly) and indirect information richness (i.e. an ability to carry information and, thus, change a user’s perception). This study utilised emoticons adopted from Yahoo! Messenger1as mentioned in the study by Huanget al. (2008), MSN messenger (Windows LiveTM
Messenger), and also internet browsing. The emoticons as shown in Figure 3 only covered 11 out of 16 Kansei words due to their appropriateness of expression.
The 16 Kansei words used were: ‘convenience’, ‘attractiveness’, ‘cleanliness’, ‘welcomeness’,
‘confidence’, ‘happiness’, ‘relaxedness’, ‘peacefulness’, ‘passion’, ‘satisfaction’, ‘spaciousness’, ‘elegance’, ‘friendliness’, ‘modernization’, ‘relief’ and ‘quietness’.
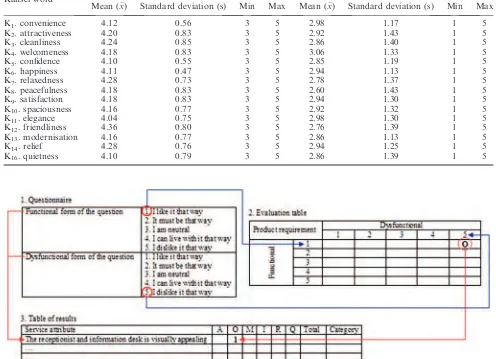
Related to the ‘importance’ criterion, ‘friendliness’ had the highest mean score (x¼4:36), whereas
‘elegance’ had the lowest mean score (x¼4:04).
Since all Kansei words had importance scores above 4, all were assumed to be equally important. For the ‘response’ criterion, ‘welcomeness’ had the highest mean score (x¼3:06;s¼1.33), whereas
‘peacefulness’ had the lowest (x¼2:06;s¼1.43). The
descriptive statistics of the Kansei word are reported in Table 3.
4.5. Collection and evaluation of service attributes incorporated into the Kano model
In being connected with customer emotional needs/ Kansei, common service attributes in luxury hotels were collected. The proposed service attributes referred to the SERVQUAL model developed by Parasuraman et al. (1988) with some modifications for use in luxury hotels. The modifications considered some sources of relevant information (such as web pages, hotel brochures and related studies in journals or articles). In total, there were 39 service items categorised into five dimensions: (1) tangibles (consisting of fourteen items, such as ‘the receptionist and information desk is visually appealing’); (2) reliability (consisting of eight items, such as ‘your hotel reservation is handled efficiently and effectively); (3) responsiveness (consist-ing of five items, such as ‘the employees tell you exactly when services will be performed); (4) assurance
(consisting of six items, such as ‘the employees have knowledge in answering your enquiries’) and (5) empathy (consisting of six items, such as ‘the employees are helpful, friendly, and respectful’).
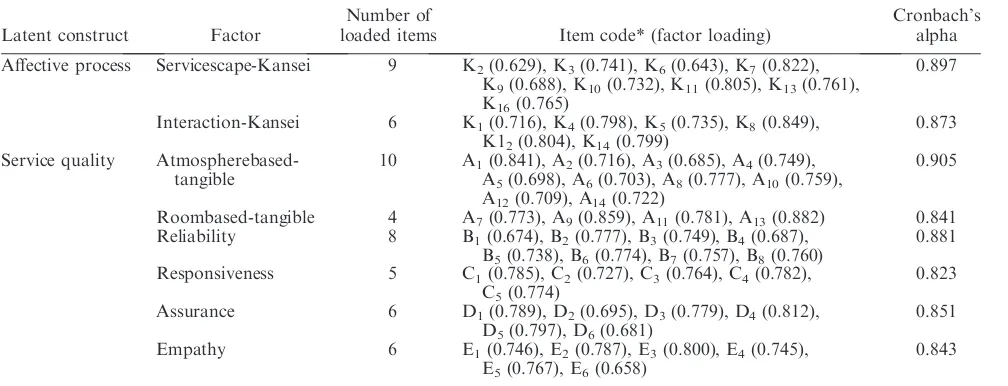
Respondents were asked to rate the importance, expectation and perception of the hotel services with respect to the 39 service quality items using a five-point Likert scale. In addition, the Kano questionnaire was used to rate the service attribute performance. Regarding the Kano questionnaire, in each of the service attributes, a pair of questions was formulated to which the customer should answer in one of five different ways. The first question deals with the response of the customer due to the availability of services, whereas the second one concerns his/her reaction due to the absence of services (see Figure 4 for an example of evaluation process). In other words, those questions should refer to the provision/non-provision of the benefits to be expected through the provision of an attribute (Mikulic´ and Prebezˇac 2011). The questions utilised the 39 service quality items as the representative of the voice of the customer (Sauerweinet al. 1996). After having combined all Table 2. Profile of respondents.
Variables Frequency Percentage of total Variables Frequency Percentage of total
Hotel category Monthly income
4-star hotel 41 41 5¼US$2000 35 35
5-star hotel 59 59 US$2001–3000 36 36
US$3001–4000 17 17
4US$4000 12 12
Gender
Male 51 51
Female 49 49 Frequency of stay in 2008–2009 15 15
Less than once a year 22 22
Age 3 3 Once a year 22 22
20 29 29 Twice a year 24 24
21–30 30 30 Three times a year 13 13
31–40 28 28 Four times a year 4 4
41–50 10 10 Five times or more a year
450 6 6
Highest education
Frequency of travel Junior high or equivalent
Once a year or less 27 27 High school or equivalent 40 40
Every six months 31 31 College or university degree 39 39
Every three months 25 25 Post graduate degree 15 15
Every month 9 9
Once a month 8 8 Occupation 4 4
Clerical/office 6 6
Purpose Engineering
Vacation 43 43 Entrepreneur/self employed 32 32
Business trip 26 26 Management 10 10
Conference 19 19 Education 13 13
Social visit 12 12 Finance 18 18
Marketing 14 14
Amount of time spent 38 38 Student 3 3
3
4–7 34 34
8–11 28 28
answers from the participants to each functional and dysfunctional question, the results of each service attribute were listed. Thereafter, the evaluation and interpretation of each Kano category was done by using a frequency analysis (Sauerwein et al. 1996). An example of the requirement categories of the individual service attributes and their descriptive statistics are shown in Tables 4 and 5, respectively.
This study showed that customers have high expectation where all service quality items received mean score above 4 (see the ‘expectation’ column in Table 5). The highest mean score was 4.54 for two items, i.e. ‘the hotel’s interior and exterior are well managed and maintained’, and ‘the atmosphere of restaurant is inviting appetite’. Both are categorised in the ‘tangible’ dimension. As for customer perception,
the highest mean score was 3.64 (i.e. ‘all size of servings are given correctly the first time’), and the lowest one was 3.28 (i.e. ‘the employees tell you exactly when services will be performed’, and ‘the employees are never too busy to respond to your request’). The findings also showed that customers had low
perception on the ‘responsiveness’ dimension. Overall, their expectation was greater than perception.
Afterwards, the Kano categorisation was applied. Thirteen out of 39 items were of the attractive/exciter category, such as ‘the hotel’s lobby is comfortable’, ‘the bill is charged accurately’, etc. Three items were categorised as attractive quality (A) within the ‘reliability’ dimension. They discussed and shared a common issue, i.e. correctness and sureness. Since most tourists were on vacation (please refer to Figure 3. Emoticons used and attached in survey paper.
Table 2), it was naturally understood that they expected a secure place and its surroundings, and a related certainty. Surely, it would provide them great surprise, positive impression and sense of complete delight. According to Herzberg (1968), this condition is discussed in one of his principles related to responsibility and recognition motivator, i.e. increas-ing the accountability of individuals for their own
work. It shows that employee accountability has a positive impact on customer emotional satisfaction. Through a gap analysis, the three attractive service attributes as mentioned above had relatively low service gaps as compared to the average gap score (70.87) shown in Table 5. It means that they had relatively positive evaluation feedback on those three items which positively correlated with emotions Table 3. Descriptive statistics of Kansei word.
Kansei word
Importance Response
Mean (x) Standard deviation (s) Min Max Mean (x) Standard deviation (s) Min Max
K1. convenience 4.12 0.56 3 5 2.98 1.17 1 5
K2. attractiveness 4.20 0.83 3 5 2.92 1.43 1 5
K3. cleanliness 4.24 0.85 3 5 2.86 1.40 1 5
K4. welcomeness 4.18 0.83 3 5 3.06 1.33 1 5
K5. confidence 4.10 0.55 3 5 2.85 1.19 1 5
K6. happiness 4.11 0.47 3 5 2.94 1.13 1 5
K7. relaxedness 4.28 0.73 3 5 2.78 1.37 1 5
K8. peacefulness 4.18 0.83 3 5 2.60 1.43 1 5
K9. satisfaction 4.18 0.83 3 5 2.94 1.30 1 5
K10. spaciousness 4.16 0.77 3 5 2.92 1.32 1 5
K11. elegance 4.04 0.75 3 5 2.98 1.30 1 5
K12. friendliness 4.36 0.80 3 5 2.76 1.39 1 5
K13. modernisation 4.16 0.77 3 5 2.86 1.13 1 5
K14. relief 4.28 0.76 3 5 2.94 1.25 1 5
K16. quietness 4.10 0.79 3 5 2.86 1.39 1 5
Table 4. An overview of the requirement categories of the individual service attributes.
Service attribute A O M I R Q Total Category
The receptionist and information desk is visually appealing 23 39 18 20 0 0 100 O
The hotel has modern-looking equipment 22 25 27 26 0 0 100 M
The employees are never too busy to respond to your requests 51 10 4 35 0 0 100 A . . .
Note: Bold values signify the highest frequencies that determine the Kano categories. Figure 4. Kano evaluation process.
(Hartono and Tan 2010). Hence, most of the items in the ‘reliability’ dimension were categorised as delighters.
4.6. Instrument validation
Reliability and validity tests of a measurement instrument are needed to ascertain the quality of a Table 5. Descriptive statistics of service quality incorporated with Kano category.
Service attribute
Means (x)
Kano category** Importance Expectation Perception Gap*
Tangible
A1.The receptionist and information desk is visually appealing
4.23 4.38 3.42 70.96 O
A2.The employees’ uniforms are clean, nice, and neat 3.96 4.52 3.40 71.12 O
A3.The hotel has modern-looking equipment 3.96 4.46 3.40 71.06 M
A4.The hotel’s interior and exterior are well managed and maintained
3.94 4.54 3.52 71.02 I
A5.The outdoor environment is visually clean 4.13 4.46 3.44 71.02 O
A6.The atmosphere of restaurant is inviting appetite 4.08 4.54 3.42 71.12 I
A7.The shops are attractive 4.06 4.44 3.36 71.08 A
A8.The hotel’s lobby is comfortable 4.17 4.22 3.32 70.90 A
A9.The bedroom and bathroom are clean and convenient 4.04 4.20 3.44 70.76 M
A10.The hotel is well lighted 4.06 4.20 3.48 70.72 I
A11.The sports facilities are well maintained, clean, and convenient
3.94 4.26 3.36 70.90 M
A12.The music in hotel’s lobby is soft and nice 4.09 4.14 3.34 70.80 M
A13.The scent in hotel’s room and lobby is refreshing 3.89 4.30 3.52 70.78 A
A14.The meals served at the hotel are delicious 4.13 4.18 3.50 70.68 I
Reliability
B1.Your hotel reservation is handled efficiently and effectively
4.04 4.34 3.32 71.02 M
B2.Your booked guestroom is ready as promised 4.06 4.26 3.44 70.82 O
B3.The bill is charged accurately 4.08 4.16 3.62 70.54 A
B4.All size of servings are given correctly the first time 3.89 4.12 3.64 70.48 A B5.The employees show a sincere interest in solving
your problem
4.23 4.40 3.42 70.98 A
B6.The hotel insists on error-free records 4.09 4.28 3.30 70.98 I
B7.AC, TV, radio, lights, mini bar, & other equipment work properly
3.96 4.14 3.42 70.72 O
B8.Overall, you got what you paid for 4.08 4.40 3.42 70.98 M
Responsiveness
C1.The employees tell you exactly when services will be performed
4.09 4.26 3.28 70.98 I
C2.The employees give you prompt service 3.87 4.22 3.34 70.88 M
C3.The employees are always willing to help you 4.06 4.30 3.44 70.86 A
C4.The employees are never too busy to respond to your requests
4.08 4.32 3.28 71.04 A
C5.Informative literature about the hotel facilities is provided
4.09 4.32 3.38 70.94 A
Assurance
D1.The employees have knowledge in answering your enquiries
4.13 4.18 3.40 70.78 O
D2.The behavior of employees instills confidence in you 3.92 4.20 3.48 70.72 I
D3.The employees know well about local places of interest 4.15 4.26 3.36 70.90 A
D4.The hotel provides a safe environment 4.13 4.32 3.42 70.90 O
D5.The employees are consistently courteous with you 4.17 4.30 3.38 70.92 M
D6.The staff explains clearly charges on your account 3.89 4.20 3.56 70.64 O
Empathy
E1.The employees are helpful, friendly, and respectful 4.21 4.36 3.44 70.92 M
E2.The hotel gives you individual full attention 3.96 4.28 3.44 70.84 A
E3.The hotel has employees who give you personal attention 4.23 4.20 3.32 70.88 A
E4.The employees understand your specific needs 3.81 4.38 3.52 70.86 I
E5.The hotel has your best interests at heart 4.04 4.24 3.60 70.64 O
E6.The hotel has operating hours convenient to you 4.11 4.16 3.36 70.80 A
Grand mean 4.29 3.42 70.87
Notes: *Gap¼perception – expectation; **O, one-dimensional; A, attractive; M, must-be; I, indifferent.
survey. Initially, potential subjects were approached and explained about the purpose of the study. After that, the questions and survey procedures (including survey duration) were explained. If they were comfor-table and convinced enough, survey began. Otherwise, it was cancelled. This is the face validity test which influences the motivation of the subjects participating in a study (Sanders and McCormick 1993). The question items (service attributes) were designed based on the relevant theories and significant research findings proposed by previous scholars. They include the SERVQUAL 22-item scale by Parasuraman et al. (1988) and the 26-item scale of hotel service quality by Ladhari (2009). These were previously empirically tested by scientific research techniques and have shown good tolerable validity. It explains that an acceptable content validity has been showed in this study and is helpful to common sense interpretation of the scale scores (Malhotra 2007, Lai and Wu 2011).
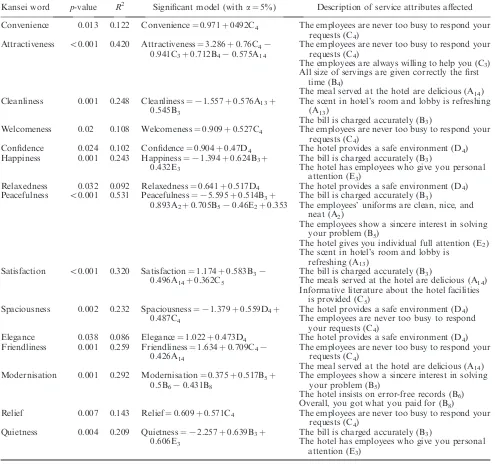
To assess construct validity, the proposed proper-ties of the constructs in this study were tested using confirmatory factor analysis (CFA, using AMOSTM version16). This technique is utilised to verify the factor structure of a set of observed measures and to test the hypothesis that a relationship between observed variables and their principal latent constructs exists (Suhr 2006). In other words, it is used to confirm relationships among observed and latent measures which move beyond regression. According to Fabrigar et al. (1999), simulation studies show that samples as small as 100 can provide stable factor models. To address the validity of the measurement model, this study used several model fit indices, such as goodness-of-fit index (GFI), root mean square error of approximation (RMSEA) with a 90% confidence interval (CI), chi-square test, Tucker-Lewis Index (TLI) and a comparative fit index (CFI). The threshold values for each of model indices are as follows. GFI of at least 0.9 is deemed to be the standard adopted by many scholars. It, however, has been criticised that less restrictive value may be appropriate, depending on the specific area of inquiry (Firat et al. 2009). RMSEA with a value of 0.06 or less is acceptable (Hu and Bentler 1999). According to Browne and Cudeck (1993), its values around 0.08 indicate moderate fit, and values above 0.1 seem to be poor fit. Related to chi-square test, the fit is best if the chi-square test is statistically insignificant. TLI and CFI values of 0.9 or greater indicate acceptable model fit (Hu and Bentler 1999). To obtain a reasonably good fit, therefore, it is recommended to report not only chi-square but also RMSEA, GFI, TLI and CFI.
Regarding validity test, Kansei-service quality model revealed acceptable or near acceptable model fit in some criteria. The CFA revealed an adequate fit
of the model to the current data based only on the RMSEA (0.054 with CI¼0.004–0.104), and closed to an adequate fit based on the GFI (0.807). However, there was a poor fit based on chi-square (121.52 with p-value¼0.005), TLI (0.767) and CFI (0.785). An effort to improve the model (i.e. check individual item properties) was undertaken. Inspection of the
individual items indicated that several items did not appear to have sufficient relationship with the
hypothesised factor/latent variable, according to their factor loadings. Thus, this model was modified. For instances, we added a new latent variable for ‘affective process’ construct. In total, there were two latent variables (factors) formed in ‘affective process’ construct, i.e. (i) servicescape-Kansei and (ii) interaction-Kansei. Servicescape-Kansei connected to items ‘modernization’, ‘elegance’, ‘relaxedness’, ‘attractiveness’, ‘cleanliness’, ‘spaciousness’, ‘quietness’, ‘happiness’, ‘satisfaction’; whereas the remaining items connected to interaction-Kansei. In addition, item ‘passionate’ was removed due to very low loadings. Another modification was to split ‘tangible’ variable into two latent variables (factors): (i) atmospherebased-tangible and (ii) roombased-tangible. Roombased-tangible connected to four items, i.e. ‘the bedroom and bathroom are clean and
convenient’, ‘the scent in hotel’s room and lobby is refreshing’, ‘the shops are attractive’, and ‘the sports facilities are well maintained, clean, and convenient’; whereas the remaining items connected to
atmospherebased-tangible. Please refer to Table 6 for details of factor structure.
A final test after modifying and improving the overall model was done. The results indicated that the overall model improved; the RMSEA improved to 0.034 (with CI¼0.024–0.044), the GFI improved to 0.925, the chi-square improved to 15.125
(p-value¼0.088) and the TLI and CFI improved to 0.901 and 0.941, respectively. Thus, this model had a reasonably good fit.
Apart from validity test, reliability test was conducted to evaluate the internal consistency of a construct/latent variable. This study used Cronbach’s alpha to test the construct reliability. It measures how well a set of items (or variables) measures a single one-dimensional latent construct. Nunnally (1978) suggests 0.7 as a benchmark for ‘modest’ reliability, while Churchill (1979) suggests that a Cronbach’s alpha value of 0.6 is acceptable. Reliability analyses indicated adequate scores for all factors (Cronbach’s alpha coefficients were: servicescape-Kansei¼0.897, interaction-Kansei¼0.873, atmospherebased-tangible¼0.905, roombased-tangible¼0.841, reliability¼0.881, responsiveness ¼0.823,
assurance¼0.851 and empathy ¼0.843). Thus, this
model also demonstrated adequate reliability. Table 6 shows all findings of factor structure, including the number and names of factors, loaded items of each factor, factor loading of each item and Cronbach’s alpha of each factor. Regarding factor loading of each item, Hulland (1999) argued that, in general terms, items with loadings of less than 0.5 should be dropped. According to Chin (1998), where scales are adapted from other settings and some are new scales, a loading of 0.5 can be used as a cut-off point. In this study, all individual items showed adequate factor loadings.
4.7. Model fitting: link and evaluation
The perceived service quality and Kansei responses were met, linked and analysed by using stepwise linear regression (Efroymson 1960). This method had an automatic procedure in cases where there was a large number of potential independent/explanatory vari-ables (for example, there were 39 service attributes in this study), and no underlying theory on which to base the model selection. Basically, at each iteration process, after a new independent variable is added in the model, a test will be made to check whether other variables can be deleted without increasing the residual sum of squares (RSS). This process is terminated when the measure is locally maximised (Efroymson 1960).
In each model, the five-point Likert based scores given by respondents to each Kansei word (i.e. Kansei response scores) and perceived service attribute were used as dependent and independent variables, respec-tively. The data were then analysed using SPSS1 13 for Windows. The statistical output is presented in Table 7. The most significant model was for the Kansei
word ‘peacefulness’ (p-value50.001,R2¼0.531). Five service attributes had statistical influence on the Kansei word ‘peacefulness’, including ‘the bill is charged accurately’, ‘the employees’ uniforms are clean, nice, and neat’, ‘the employees show a sincere interest in solving your problem’, ‘the hotel gives you individual full attention’ and ‘the scent in hotel’s room and lobby is refreshing’. By observing the model coefficients, it is concluded that the service attribute ‘the employees’ uniforms are clean, nice and neat’ (coefficient¼0.893) had a slightly greater effect on the Kansei word ‘peacefulness’ in comparison with the other Kansei words.
4.8. Analysis of action
This refers to the reverse of the significant models, to see the extent to which service attribute influences particular emotions/Kansei. By referring to the significant models as provided in Table 7, the reversed models are shown in Table 8.
By engaging the attractive service attributes (A) only and taking into account the service gap, the next step was to decide an action whether to proceed with continuous improvement or with enhancement/ maintenance. As shown in Table 8, there were nine attractive service attributes (A) having the significant relationship with several Kansei words (shown in grey background). They were related to the ‘tangible’ dimension (‘the scent in hotel’s room and lobby is refreshing’), the ‘reliability’ dimension (‘the bill is charged accurately’, ‘all size of servings are given correctly the first time’, and ‘the employees show a sincere interest in solving your problem’), the Table 6. Factor structure.
Latent construct Factor
Number of
loaded items Item code* (factor loading)
Cronbach’s alpha
Affective process Servicescape-Kansei 9 K2(0.629), K3(0.741), K6(0.643), K7(0.822), K9(0.688), K10(0.732), K11(0.805), K13(0.761), K16(0.765)
0.897
Interaction-Kansei 6 K1(0.716), K4(0.798), K5(0.735), K8(0.849), K12(0.804), K14(0.799)
0.873
Service quality Atmospherebased-tangible
10 A1(0.841), A2(0.716), A3(0.685), A4(0.749), A5(0.698), A6(0.703), A8(0.777), A10(0.759), A12(0.709), A14(0.722)
0.905
Roombased-tangible 4 A7(0.773), A9(0.859), A11(0.781), A13(0.882) 0.841 Reliability 8 B1(0.674), B2(0.777), B3(0.749), B4(0.687),
B5(0.738), B6(0.774), B7(0.757), B8(0.760)
0.881
Responsiveness 5 C1(0.785), C2(0.727), C3(0.764), C4(0.782), C5(0.774)
0.823
Assurance 6 D1(0.789), D2(0.695), D3(0.779), D4(0.812), D5(0.797), D6(0.681)
0.851
Empathy 6 E1(0.746), E2(0.787), E3(0.800), E4(0.745), E5(0.767), E6(0.658)
0.843
Note: *Please refer to Tables 3 and 5 for details of item name.
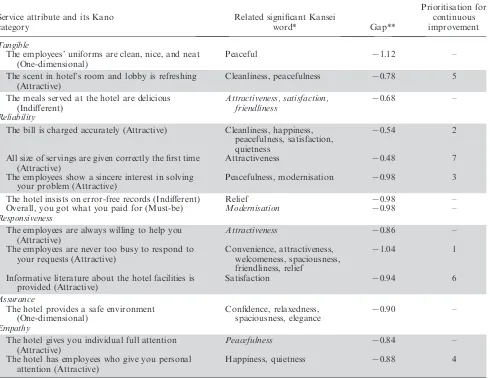
‘responsiveness’ dimension (‘the employees are always willing to help you’, ‘the employees are never too busy to respond to your requests’, and ‘Informative literature about the hotel facilities is provided’) and the ‘empathy’ dimension (‘the hotel gives you indivi-dual full attention’, and ‘the hotel has employees who give you personal attention’). There was no significant item related to the ‘assurance’ dimension.
Since all service gaps were negative, the action was directed to the prioritised continuous improvement. The attribute ‘the employees are never too busy to respond to your requests’ was considered to be the first priority for improvement. It had the greatest influence
on emotion, since it was significantly related to the largest number of Kansei words (i.e. seven Kansei words). They include ‘convenience’, ‘attractiveness’, ‘welcomeness’, ‘passion’, ‘spaciousness’, ‘friendliness’ and ‘relief’. The other results of the prioritisation for continuous improvement are shown in Table 8.
5. Discussion and implications
During service encounters, customers experience both the physical (servicescape) and the non-physical parts of services. Their individual perception serves as a cognitive process which stimulates their emotional Table 7. Significant regression model for each Kansei word.
Kansei word p-value R2 Significant model (with
a¼5%) Description of service attributes affected
Convenience 0.013 0.122 Convenience¼0.971þ0492C4 The employees are never too busy to respond your requests (C4)
Attractiveness 50.001 0.420 Attractiveness¼3.286þ0.76C47
0.941C3þ0.712B470.575A14
The employees are never too busy to respond your requests (C4)
The employees are always willing to help you (C3) All size of servings are given correctly the first
time (B4)
The meal served at the hotel are delicious (A14) Cleanliness 0.001 0.248 Cleanliness¼71.557þ0.576A13þ
0.545B3
The scent in hotel’s room and lobby is refreshing (A13)
The bill is charged accurately (B3)
Welcomeness 0.02 0.108 Welcomeness¼0.909þ0.527C4 The employees are never too busy to respond your requests (C4)
Confidence 0.024 0.102 Confidence¼0.904þ0.47D4 The hotel provides a safe environment (D4) Happiness 0.001 0.243 Happiness¼71.394þ0.624B3þ
0.432E3
The bill is charged accurately (B3)
The hotel has employees who give you personal attention (E3)
Relaxedness 0.032 0.092 Relaxedness¼0.641þ0.517D4 The hotel provides a safe environment (D4) Peacefulness 50.001 0.531 Peacefulness¼75.595þ0.514B3þ
0.893A2þ0.705B570.46E2þ0.353
The bill is charged accurately (B3)
The employees’ uniforms are clean, nice, and neat (A2)
The employees show a sincere interest in solving your problem (B5)
The hotel gives you individual full attention (E2) The scent in hotel’s room and lobby is
refreshing (A13) Satisfaction 50.001 0.320 Satisfaction¼1.174þ0.583B37
0.496A14þ0.362C5
The bill is charged accurately (B3)
The meals served at the hotel are delicious (A14) Informative literature about the hotel facilities
is provided (C5) Spaciousness 0.002 0.232 Spaciousness¼71.379þ0.559D4þ
0.487C4
The hotel provides a safe environment (D4) The employees are never too busy to respond
your requests (C4)
Elegance 0.038 0.086 Elegance¼1.022þ0.473D4 The hotel provides a safe environment (D4) Friendliness 0.001 0.259 Friendliness¼1.634þ0.709C47
0.426A14
The employees are never too busy to respond your requests (C4)
The meal served at the hotel are delicious (A14) Modernisation 0.001 0.292 Modernisation¼0.375þ0.517B5þ
0.5B670.431B8
The employees show a sincere interest in solving your problem (B5)
The hotel insists on error-free records (B6) Overall, you got what you paid for (B8)
Relief 0.007 0.143 Relief¼0.609þ0.571C4 The employees are never too busy to respond your requests (C4)
Quietness 0.004 0.209 Quietness¼72.257þ0.639B3þ
0.606E3
The bill is charged accurately (B3)
The hotel has employees who give you personal attention (E3)
response (affective process). It has been empirically proven that cognition has a very significant correlation with affection (Hartono and Tan 2010). Cognitive processing may relate to form pre-consumption expec-tancies, observe perceived performance of product or service attributes, compare performance with expecta-tions, form disconfirmation perceptions and form satisfaction judgments (Oliver 1980, 1993, Tse and Wilton 1988). Affective processing, however, may refer to the emotional response given by the customers due to product interaction or service encounter. It implies that all processes within the span of the service attributes space form cognitive processing, whereas those that are within the span of the semantic space form affective processing.
The Kano model helps to identify different categories of service attribute quality. The attractive (A) category is of interest to fulfil customer emotional
needs/Kansei and to maximise customer overall satisfaction. This is the service quality category which is neither taken for granted nor expressed by
customers. Consequently, service attributes of the attractive category (A) were chosen to be the main focus for modelling and analysis in this study. The other two common categories (i.e. one-dimensional (O) and must-be (M)) were considered as primary features to be satisfied on a regular basis. According to Maslow (1943), one-dimensional and must-be qualities are positioned below the self-actualisation level. They are mostly covered in the hygiene factors (Herzberg 1968). Yang (2011) argued that those qualities were less sensitive and satisfaction-driving attributes. As a consequence, they are unlikely to be associated with strong emotions such as delight. Thus, they are deemed to be compulsory qualities to be well performed on a daily basis.
Table 8. The significant relationship between service attribute and Kansei word along with prioritised continuous improvement.
Service attribute and its Kano category
Related significant Kansei
word* Gap**
Prioritisation for continuous improvement
Tangible
The employees’ uniforms are clean, nice, and neat (One-dimensional)
Peaceful 71.12 –
The scent in hotel’s room and lobby is refreshing (Attractive)
Cleanliness, peacefulness 70.78 5
The meals served at the hotel are delicious (Indifferent)
Attractiveness, satisfaction, friendliness
70.68 –
Reliability
The bill is charged accurately (Attractive) Cleanliness, happiness, peacefulness, satisfaction, quietness
70.54 2
All size of servings are given correctly the first time (Attractive)
Attractiveness 70.48 7
The employees show a sincere interest in solving your problem (Attractive)
Peacefulness, modernisation 70.98 3
The hotel insists on error-free records (Indifferent) Relief 70.98 –
Overall, you got what you paid for (Must-be) Modernisation 70.98 –
Responsiveness
The employees are always willing to help you (Attractive)
Attractiveness 70.86 –
The employees are never too busy to respond to your requests (Attractive)
Convenience, attractiveness, welcomeness, spaciousness, friendliness, relief
71.04 1
Informative literature about the hotel facilities is provided (Attractive)
Satisfaction 70.94 6
Assurance
The hotel provides a safe environment (One-dimensional)
Confidence, relaxedness, spaciousness, elegance
70.90 –
Empathy
The hotel gives you individual full attention (Attractive)
Peacefulness 70.84 –
The hotel has employees who give you personal attention (Attractive)
Happiness, quietness 70.88 4
Notes: *Kansei words with italic texts have significant negative relationship with service attributes; **Gap¼perception – expectation; Service attributes in grey background signify ‘attractive’ (A) category.
An integrative framework of the Kano model and KE has been proposed and tested through an empirical study on luxury hotel services. This study postulated that the perceived service attributes/qualities impacted on emotions/Kansei response. This proposition was significantly supported. By using stepwise linear regression, emotions/Kansei words elicited and im-pacted by particular perceived service attributes were investigated, modelled and evaluated. It explains that a certain Kansei word has been significantly influenced by one or more service attributes. In other words, a service attribute might have impact on one or more Kansei words. The more the Kansei words were significantly influenced, the more important the services attribute was.
As a practical implication, this study gives a useful insight to service designers. It helps them identify what efforts in terms of continuous improve-ment or enhanceimprove-ment/maintenance should be directed towards the attractive attributes (A) which have significant impact on Kansei words. According to research findings, the attribute ‘the employees are never too busy to respond to your requests’ should be given the first priority for continuous improvement. Intensive regular training in topics such as character building, leaderships, communication skills and focus on customers for staffs are encouraged. In addition, the hotel management should assure sufficient num-ber of staffs equipped with their relevant knowledge and professionalism. In order to be customer conscious, a campaign slogan (such as ‘always there for customer’) might be useful for daily awareness by all hotel staff.
Totally, there were seven prioritised service attri-butes to be taken care of by the hotel service providers as shown in Table 8 (in grey background). Two service attributes were neglected for prioritisation of improve-ment (i.e. ‘the employees are always willing to help you’ and ‘the hotel gives you individual full attention’), since they had negative relationships with particular Kansei words.
6. Conclusion and further research
The trend of the 21st century is towards hedonism and pleasure. Delighting customers is an essential key for achieving customer retention and total emotional satisfaction. It requires positive surprise of customers beyond their expectation. KE has shown its ability to deal with customer emotional needs. This method is able to capture and translate those emotional needs, and to build a mathematical model that represents the relationships between emotion and product elements/ service attributes. Traditional KE methodology has been applied intensively and successfully in product
design and development. As quality control has been introduced in the service industry, it is a great opportunity to apply KE to services. This newly KE applied to hospitality services is called Kansei Quality Management (KQM) (Nagamachi and Lokman 2011).
As reviewed, recent research in KE lacks a relationship between product/service performance and customer emotional needs/Kansei. This study
presented and discussed the integrative framework of the Kano model and KE. It promoted the Kano model incorporated into the systematic KE methodology with a focus on attractive/delighting/exciting quality of service attributes. The Kano categorisation of service attributes incorporated into the proposed framework offers competitive benefits in terms of prioritised improvement and efficiency. An attractive attribute was found to have the greatest influence on customer Kansei. In addition, it was the first step of
prioritisation of service quality improvement with regard to limited resources (e.g. budget, time, workforce and other technical reasons). Since the domain of study was luxury hotels which potentially give more impact on customer emotional feelings, appropriate strategies should be applied to win the business competition. They include how to always stand out and focus on attractive requirements, and fulfil all basic/must-be and proportional/
one-dimensional requirements on a regular basis. Essentially, KQM focuses on something beyond usability and functionality. Thus, it fits the attractive attributes which are neither explicitly expressed nor expected by customers. The business strategy should be directed to delight or excite customers immediately. In other words, the focus for business improvement should be on customer loyalty and total satisfaction, rather than on minimising dissatisfaction.
This study provides a theoretical contribution to the academic literature on Kansei ergonomics, service science and quality management by proposing an integrated conceptual framework and methodology of KE and the Kano model. In addition, a practical contribution is presented by giving a guideline for service managers in investigating which service attributes are significantly sensitive to customer delights and given a priority for improvement or maintenance. Its practical potential benefit and impact can be large as service is the fastest growing sector in today’s businesses.
Since this study is relatively new in nature and of limited data, the findings obtained may not be generalised for all service industries. Some future work on the integration of the Kano model and KE are still of interest in addressing, for example, the following issues:
. Collect more data with regard to different cultural backgrounds of respondent. It seemed that research findings might be influenced by the customer cultural background. This study was done by looking at Indonesian tourist perspec-tives only. Future research should test the significance of proposed integrative framework on other groups of tourist.
. Apply this integrative framework to access and to evaluate the relationship of customer emotional needs/Kansei and perceived service attributes in other service industries or domains.
. Extend the framework of the Kano model and KE into a systematic framework for improve-ment. It is possible to incorporate this frame-work into QFD.
. Investigate the implication of this integrative framework with other interaction with customer (e.g. effects on customer behavioural intention/ customer loyalty).
References
Barsky, J. and Nash, L., 2002. Evoking emotion: affective keys to hotel loyalty. Cornell Hotel and Restaurant Administration Quarterly, 43, 39–46.
Berger, C., et al., 1993. Kano’s methods for understanding customer-defined quality.Center for Quality of Manage-ment Journal, 4, 3–36.
Bitner, M.J., 1992. Servicescapes: the impact of physical surroundings on customers and employees. Journal of Marketing, 56, 57–71.
Browne, M.W. and Cudeck, R., 1993. Alternative ways of assessing model fit.In: K.A. Bollen and J.S. Long, eds.
Testing structural equation models. Newbury Park, CA: Sage, 136–162.
Chen, C.-C. and Chuang, M.-C., 2008. Integrating the Kano model into a robust design approach to enhance customer satisfaction with product design.International Journal of Production Economics, 114, 667–681.
Chin, W.W., 1998. The partial least squares approach to structural equation modeling.In: G.A. Marcoulides, ed.
Modern methods for business research. Mahwah, NJ: Erlbaum, 295–336.
Churchill, G., 1979. A paradigm for developing better measures for marketing constructs.Journal of Marketing Research, 16 (1), 64–73.
Collins, J. and Porras, J., 2004.Built to last: successful habits of visionary companies. New York: Harper Collins Publishers.
Derbaix, C.M., 1995. The impact of affective reactions on attitudes toward the advertisement and the brand: a step toward ecological validity. Journal of Marketing Research, 32, 470–479.
Desmet, P.M.A., 2003. Measuring emotions: development and application of an instrument to measure emotional responses to products.In: M.A. Blythe, A.F. Monk, K. Overbeeke, and P.C. Wright, eds. Funology: from usability to enjoyment. Dordrecht: Kluwers Academic Publisher, 111–123.
Desmet, P.M.A., 2008. Product emotion.In: H.N.J. Schifferstein and P. Hekkert, eds.Product experience. Oxford: Elsevier Ltd., 379–397.
Dube, L., Cervellon, M.-C., and Jingyuan, H., 2003. Should consumer attitudes be reduced to their affective and cognitive bases? Validation of a hierarchical model.
International Journal of Research in Marketing, 20, 259–272.
Efroymson, M.A., 1960. Multiple regression analysis.In: A. Ralston and H.S. Wilf, eds.Mathematical methods for digital computers. New York: Wiley, 191–203.
Fabrigar, L.R.,et al., 1999. Evaluating the use of exploratory factor analysis in psychological research.Psychological Methods, 4, 272–299.
Firat, M.Z.,et al., 2009. Menstrual attitude questionnaire: confirmatory and exploratory factor analysis with Turkish samples.Journal of Advanced Nursing, 65 (3), 652–662.
Hartono, M. and Tan, K.C., 2010. The role of Kansei engineering in influencing overall satisfaction and behavioral intention in service encounters.In:
Proceedings of the 1st southeast Asian network of ergonomics societies (SEANES) conference, 14–17 December 2010, Cebu City, Philippines. Manila: Philippine Ergonomics Society, 16–28.
Helander, M.G., 2003. Hedonomics-affective human factors design.Ergonomics, 46, 1269–1272.
Herzberg, F., 1968. One more time: how do you
motivate employees?Harvard Business Review, 46 (1), 53–62.
Hu, L. and Bentler, P.M., 1999. Cutoff criteria for fit indexes in covariance structure analysis: conventional criteria versus new alternatives.Structural Equation Modeling, 6, 1–55.
Huang, A.H., Yen, D.C., and Zhang, X., 2008. Exploring the potential effects of emoticons.Information & Management, 45, 466–473.
Hulland, J., 1999. Use of partial least squares (PLS) in strategic management research: a review of four recent studies.Strategic Management Journal, 20, 195–204. Kano, K.H.,et al., 1984. How to delight your customers.
Journal of Product & Brand Management, 5, 6–17. Ladhari, R., 2009. Service quality, emotional satisfaction,
and behavioral intentions: a study in the hotel industry.
Managing Service Quality, 19 (3), 308–331.
Lai, H.-J. and Wu, H.-H., 2011. A case study of applying Kano’s model and Anova technique in evaluating service quality. Information Technology Journal, 10 (1), 89–97.
Lanzotti, A. and Tarantino, P., 2008. Kansei engineering approach for total quality design and continuous innovation.The TQM Journal, 20, 324–337.
Laros, F.J.M. and Steenkamp, J.-B.E.M., 2005. Emotions in consumer behavior: a hierarchical approach.Journal of Business Research, 58, 1437–1445.
Lee, Y.-H. and Chen, T.-L., 2006. A Kano two-dimensional quality model in Taiwan’s hot spring hotels service quality evaluations.Journal of American Academy of Business, 8 (2), 301–306.
Lin, I.Y., 2004. Evaluating a servicescape: the effect of cognition and emotion.International Journal of Hospitality Management, 23, 163–178.
Llinares, C. and Page, A.F., 2011. Kano’s model in Kansei Engineering to evaluate subjective real estate consumer preferences.International Journal of Industrial
Ergonomics, 41, 233–246.