Sociolinguistic Survey Report
of the Romanian
Deaf Community
Daniel Eberle, Sarah Eberle,
Romanian Deaf Community
Daniel Eberle, Sarah Eberle, Ionut Cuceuan, and Daniela Cuceuan
SIL International
®2015
SIL Electronic Survey Report 2015-003, October 2015 © 2015 SIL International®
The goal of this rapid appraisal survey was to gain reliable information about the linguistic and sociolinguistic situation in Romania, as well as identify needs and partners for language development. The basis of the report was two weeks of fieldwork in Romania in early 2012, conducted by four team members. We visited and gathered information from roughly 100 participants in 9 locations in five cities, in an attempt to assess language attitudes, needs, and desires. Our research tools included participant observation, sociolinguistic questionnaires, wordlist comparison, and dialect network analysis. Here we discuss the general situation of the deaf in Romania, summarize our findings, and recommend possible directions for future development. While our limited time in the country does not allow us to draw definite conclusions, it permits us to formulate a general summary of the sociolinguistic situation of the Romanian deaf community.
We found no evidence that Romanian Sign Language (LSR) is related to sign languages used in other countries; however, from our fieldwork, we can safely say that LSR varies significantly from region to region within Romania, with the three major variants being located in the Transylvania (northwest), Moldavia (northeast), and Wallachia (south) regions. While it is unclear exactly how different these variations are and how much they impede communication, it is clear that deaf Romanians recognize the differences and require some level of negotiation for communication between regions. Romania has a strong network of deaf organizations, including government support, established deaf churches, and several deaf schools. Deaf education varies widely from region to region and school to school; many schools continue traditions of oral education, while others employ deaf teachers and offer classes in LSR.
iv
Figure 1. Is your sign language like the sign language of any other country? Figure 2. Do all deaf people in Romania sign the same?
Figure 3. Levenshtein Distance Cluster Dendrogram. Figure 4. Dialect Network Analysis results.
Figure 5. Do you want all deaf people in Romania to sign the same? Figure 6. Where did you learn to sign?
Figure 7. Do deaf parents sign with hearing children? Figure 8. Do hearing parents sign with deaf children?
Figure 9. Participants without deaf family members: age of LSR acquisition. Figure 10. Participants with deaf family members: age of LSR acquisition. Figure 11. Who do you interact with more—deaf or hearing?
Figure 12. How do you communicate with the hearing community? Figure 13. Are hearing people supportive of the deaf community?
Figure 14. Which language is best for the deaf community: spoken or signed? Figure 15. Qualities desired in community leaders.
Figure 16. Cities with most services for the deaf. Figure 17. Desired publications.
List of tables
Table 1. Deaf population estimates
1
The goal of this report is to provide useful and valid sociolinguistic information about the deaf1
community of Romania. We gathered this information through internet and library research followed by two weeks of fieldwork in Romania in early 2012. Our team consisted of two U.S.-based researchers and two Romanian colleagues with ties to the deaf community. During fieldwork, we visited four cities in an attempt to gain a broad understanding of the linguistic and sociolinguistic situation of deaf communities in the country. We are deeply grateful to all the communities that opened their doors to us and were willing to participate in our research.
Romania is situated in southeastern Europe, and shares borders with Ukraine, Hungary, Serbia, Bulgaria, and Moldova, and has 225 km of coastline on the Black Sea. It is a country with a recent history of border changes, with three major border changes since 1940. Romania is noted for its large ethnic populations, both Hungarian at 6.6% of the total population and Roma at 2.5%. See map 1.
Map 1. Romania
© Bundesamt für Kartographie und Geodäsie, Frankfurt am Main
Reproduction, distribution, and publication allowed only with indication of the sources We conducted research in four cities during our fieldwork in Romania: Zalau, Cluj-Napoca, Bucharest, and Bacău. We chose those cities in an attempt to gather data from a variety of regions, factoring in population, travel logistics, availability of research participants, and respondents to our research questionnaire. See map 2 for a summary of cities visited.
1Some deaf people identify themselves as capital-D ‘Deaf’, in order to focus on their cultural identity, rather than a
Map 2. Romania focus map
The World Factbook: Romania
According to the latest 2012 estimate, Romania has a general population of nearly 22 million. Almost 90% of that population is ethnically Romanian; other major people groups include Hungarian (6.6%) and Roma (2.5%) ethnicities. The religious makeup of the country is overwhelmingly Eastern Orthodox at 86.8%, with Protestantism (7.5%) and Roman Catholicism (4.7%) accounting for most of the rest of the population (The World Factbook: Romania). Below we discuss the general social environment for deaf populations in Romania.
2 Disability in context
In this section, we attempt to describe the general situation of the deaf in Romania in the areas of population, disability law, and organizations that work with deaf communities.
2.1 Deaf population
Deaf population figures are notoriously difficult to establish for several reasons. Firstly, as primarily sociolinguistic researchers, we must make a distinction between audiological deafness, defined as hearing loss, and cultural deafness, which refers to members of a culturally and linguistically distinct community which self-identifies as deaf. Unless otherwise noted, we use the term “deaf” in this paper to refer to members of the cultural deaf community. That said, it is often challenging to establish reportable population figures for such a community, primarily because most statistics simply count people with hearing disabilities which is often a much higher number than people who consider themselves members of the deaf community.
Secondly, statistics vary as to who is even considered to have a hearing disability: depending on the requirements set by the reporting agency, populations can be greatly over- or underestimated.
Table 1. Deaf population estimates
Estimate Source Deaf Population
Gallaudet University Website (Gallaudet University Library 2012)
350,000
European Union of the Deaf (European Union of the Deaf 2013)
20,000–30,000
The Romanian Ministry of Labour, Family and Social Protection (Direcţia Protecţia Persoanelor cu Handicap, DPPH; People with Disabilities Division of the Ministry of Labour, Family, and Social Protection) 2012)
21,879
In reality, the number of people who fit into the population targeted by this report is inherently subjective. From experience in other countries, we would propose that a safe figure of 20,000 sign language users is a good estimate, though probably low.
2.2 Romanian disability law
In 2011, Romania ratified the United Nations Convention of the Rights of Persons with Disabilities, a document designed to ensure appropriate treatment of disabled people (United Nations Enable 2012). This broad document promotes human rights by defining disability and establishing legislation which promotes equal access to education and jobs, combats discrimination, and holds national governments accountable for their treatment of disabled persons (Academic Network of European Disability Experts 2012). In related legislation, Romanian Law no. 448/2006, which came into effect in January 2006, guarantees several rights to disabled persons. Article 69 states that authorized interpreters must be made available for communicating with local and central authorities and that the National Association of Deaf People of Romania (ANSR) be part of the approval process for interpreters (Direcţia Protecţia
Persoanelor cu Handicap (People with Disabilities Division of the Ministry of Labour, Family, and Social Protection) 2012).
2.3 Deaf and disability organizations
The primary governmental organization responsible for disability law policy implementation is the Autoritatea Nationala Pentru Persoane cu Handicap (National Authority for People with Disabilities), which works with educators, health workers, and other related fields (Autorităţii Naţionale pentru Persoanele cu Handicap 2012). The leading non-government organization in the country is the Organizatia Nationala a Persoanelor cu Handicap din Romania, or National Organization of Disabled People in Romania (ONPHR), which “promotes the rights of persons with disabilities in Romania and also represents the general interests of the member organizations of persons with disabilities at national and international level” (Organizatia Nationala a Persoanelor cu Handicap din Romania 2012).
The primary deaf organization in Romania is the Associatia Nationala a Surzilor din Romania, the National Association of the Deaf in Romania (ANSR). ANSR’s focus is on encouraging deaf culture, education, and improving quality of life for deaf people in Romania (Associatia Nationala a Surzilor din Romania 2012).
3 Methodology
language vitality. In this section, we will introduce these tools, describe our sampling method, and present our research questions.
3.1 Informed consent
Informed consent was gathered from each of our participants using a standardized form, included at the beginning of the sociolinguistic questionnaire. We made this form available in written English and Romanian, but in most cases we signed the information to participants. We included the following key information for each participant:
• The goal of the study
• Possible outcomes of the study
• The role of the participant
• That their participation was totally voluntary and that no compensation would be given
• That they could choose to stop their participation at any time
• That data they provided would be shared at the level they designated: only within the researcher’s organization, with strategic partners, or with the public
• That their name would never be associated with the information, opinions, or other data they shared, and that their name would not be shared with anyone.
We then obtained typed signatures for each participant that understood and agreed to the above information. See an example of this form in appendix A.
3.2 Sampling method
Sampling deaf communities is inherently difficult for the same reasons as identifying them, as discussed in the population section. Members of the deaf community are self-identifying, blend in well with the hearing community around them, and can be difficult to contact through email and internet. No two members of the deaf community are the same, and do not often congregate as much as spoken language minority groups, making traditional sampling methods ineffective. We rely instead on chain sampling and social networking to meet our research participants. Practically, this means visiting deaf associations and clubs, introducing ourselves, and gathering data from those present, then asking them to recommend places, organizations, or individuals who might be willing to participate in our research. It is common for one individual to lead us to several others in different cities. While we recognize that this is not the most statistically sound sampling method, we feel that it is appropriate for our broad information needs and time constraints.
3.3 Participant observation
Participant observation is a combination of dedicated note-taking, informal interviews, and interacting with members of the target people group in a variety of settings. Information gathered in this way can include attitudes that do not come to light in a more formal interview, names and locations of deaf clubs or organizations, political events or situations, personal opinions, and general information about the state of the country and the deaf community. Our note-taking practices consist of taking notes
throughout the day as needed, and meeting at the end of each work day to consult, discuss, and compile our notes into a master document. Pertinent information is then included in this report where
appropriate.
3.4 Sociolinguistic questionnaires
Sociolinguistic questionnaires are a quantifiable tool used to conduct detailed interviews with research participants. They consist of both open and closed questions regarding a range of topics, including demographic information, deaf services and meeting places, language use and attitudes, and perceived needs. We implemented these questionnaires in face-to-face interviews, and collected eighteen different questionnaires in four different cities.
Responses from these questionnaires were compiled and processed at the end of the survey. Conclusions are discussed in section 4.3.
3.5 Wordlists
Wordlist elicitation and analysis is a tool designed to measure the lexical similarity between dialects or language groups. We use this tool to estimate the language variation inside the country or people group we are targeting (E. Parks and J. Parks 2011). Wordlists consist of 241 digital presentation slides, each with a word in the spoken language of wider communication, and in most cases a picture of the object. See the wordlist in appendix B. Before elicitation, the researcher will demo the process in front of the camera to be sure the participant understands. Each participant was asked to use all of the signs they knew for the concept on the slide, whether they were signs they would use themselves or not.
After collection we used methodology developed by Jason Parks (J. Parks 2011). This methodology consists of coding each individual sign based on four characteristics: initial and final location and initial and final handshape, using the ELAN annotation software (ELAN 2011). These parameters were then compared using SLLED and Rugloafer, software developed for comparing linguistic parameters and producing Levenshtein distance (White 2011), using built-in algorithms developed by Kleiweg (Kleiweg 2011). Levenshtein distance is a basic measurement of the differences between each item on the wordlist, compared to each other item. It ranges from 0, in which all parameters of a pair of items are different, to 1, in which all parameters are identical. Individual entries are then scored, totaled and averaged to measure the similarity between each pair of varieties, giving the researcher a general idea of which language varieties are more or less similar to the others.
When implemented with spoken languages, wordlist elicitation and analysis is used primarily as a measure of intelligibility. However, in sign languages, it is common for two signers to communicate well with significantly lower percentages of common vocabulary than is the case for spoken languages. As a result, wordlists are a less useful measure of intelligibility. They are, however, a good measure of language standardization, and highlight major instances of language variation, such as generational differences or major regional differences.
3.6 Dialect network analysis
In addition to wordlists and questionnaires, we use a tool called dialect network analysis to identify perceived dialectal variation among the languages we study. This tool is based on the Participatory Methods for Engaging Communities framework (Truong and Garcez 2009). It consists of working with a focus group to identify cities and geographical regions which use the same or different dialect as that of the focus group. This method provides a safe environment for group consensus, where all participants are encouraged to contribute.
At the end of the survey, the results from each of these focus groups are assembled in a spreadsheet and the results are charted, providing us with a general idea of the perceived dialect differences in the country.
We compiled the DNA data in a Microsoft Excel spreadsheet and imported it into UCINET, a social network analysis program, developed by Analytic Technologies and in use since 2000 (Analytic
Technologies 2010). We used UCINET to graphically represent the dialect network and show us the number of times two given cities were said to sign similarly. We can then make preliminary conclusions about perceived language variation within the country. See section 4.3.3 for the results of this tool.
3.7 Research questions
The following research questions guided us during fieldwork:
1. RQ1. What/how many sign languages are used in Romania, what is their relationship to sign languages of other countries, and what attitudes exists between those languages? To answer this question we used Participant Observation (PO), Sociolinguistic Questionnaires (SLQ), and Dialect Network Analysis (DNA), and Wordlists (WL).
2. RQ2. What are the causes and impact of language variation with the Romanian deaf community? PO, SLQ, WLs, and DNA were used to determine the existence and extent of variation within the country.
3. RQ3. What are the opportunities for language development and Bible translation within Romania and who are the primary stakeholders and potential partners? PO and SLQ’s were used to identify interested and important individuals and groups in the language development process.
4 Sign language in Romania
Here we will discuss our findings relating to the sign languages in use among the Romanian deaf community, its relationship to neighboring sign languages, and the results of individual research tools discussed in the methodology section.
4.1 Prior research and documentation
We were able to find very little background information on sign language use in Romania. The
Ethnologue mentions a single sign language: Romanian Sign Language, (ISO Code 639-3: RMS), but gives no further information (Lewis et al 2015). Alternative names for the language are Limbajul Mimico-Gestual Romanesc, roughly translated as the ‘language of mime and gesture of Romania’ (Wycliffe Global Alliance 2012), and Limbajul Semenelor Romanesc, translated as ‘Romanian Sign Language’. Research participants told us that these names are contested among Romanians because of connotations that sign language is not a true language, but is just pantomime and gesture. They claimed that the second name, Limbajul Semenelor Romanesc (LSR), is preferred by the deaf community. Both names refer to the same language, however. For this paper, we will us the English name Romanian Sign Language and the abbreviation LSR.
4.2 Similarity to other sign languages
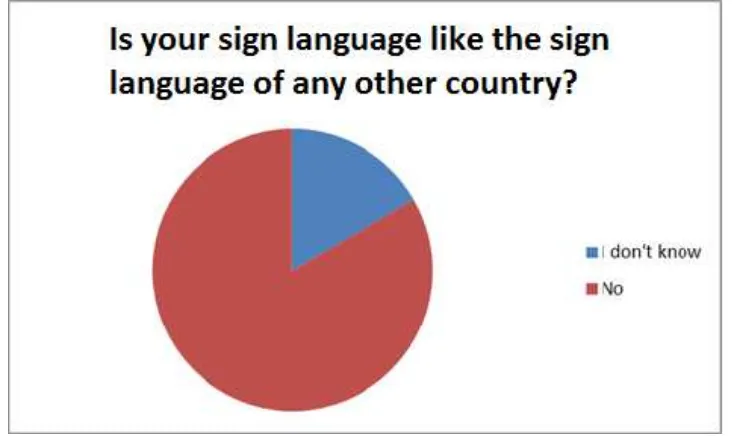
From our findings, Romanian sign language appears to be a language unique to Romania. Throughout our time spent in the country we had numerous conversations with native signers, who all strongly told us that Romanian sign language is not related to sign languages from other countries. Some mentioned that other sign languages in Europe were similar, while others said that when they went to other countries, communication was difficult. On the SLQ, 83% of our participants said that LSR is not related to the sign language of any other country; the rest of the participants claimed they did not know. See figure 1 for a summary of our SLQ findings. This data strongly suggests that Romanian sign language is not significantly related to any other sign languages.
Figure 1. Is your sign language like the sign language of any other country?
4.3 Variation within Romanian sign language
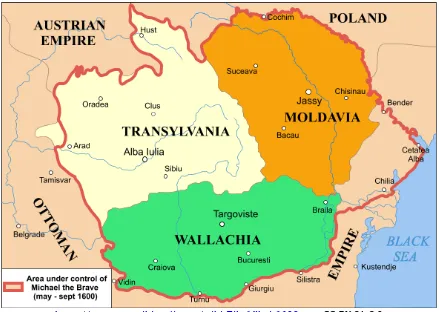
Our first research question also addressed language variation within Romania. We used several tools to gather information on this topic. Participants in several locations told us that people sign differently in three different regions of the country: Transylvania, Moldavia (part of which is Romania, and part is the Republic of Moldova), and Wallachia, the southern half of present day Romania. They attributed the variation primarily to region and the regularly changing borders. When asked about the specifics, participants claimed that the language variation was not strong enough to make communication very difficult, and that they could negotiate fairly easily with signers from other regions. See map 3 for a map of these historical areas.2
Map 3. Historical regions of Romania
https://commons.wikimedia.org/wiki/File:Mihai_1600.png, CC BY SA 3.0
4.3.1 Sociolinguistic questionnaires
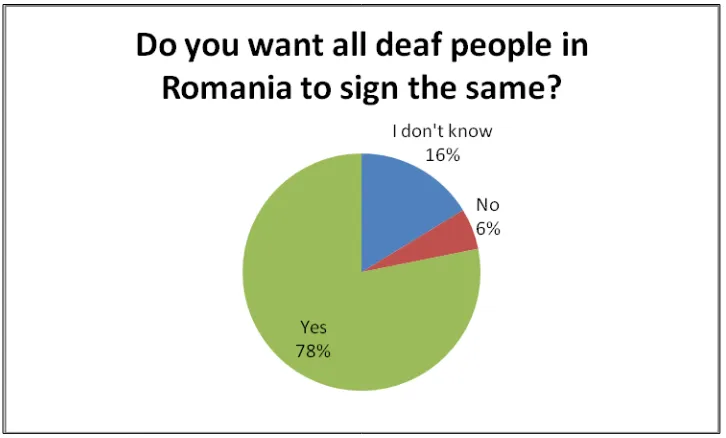
SLQ responses were clear; only 22% of participants said that all the deaf people in Romania sign same. The rest of our participants offered reasons for variation including different teachers, schools, regions, and age. See figure 2 for details.
4.3.2 Wordlist analysis
During fieldwork in Romania we collected wordlists from 6 participants in three cities, with at least one city from each of the major regions of Romania. Each collected wordlist was compared to each other list using Levenshtein distance (http://www.levenshtein.net/), which ranges from 0, in which all parameters of a given pair of entries are identical, to 1, in which all parameters are different. All scores between a pair of wordlists are then tallied and averaged to give a score for the complete lists. The results produced are relative only within this study, and allow us to compare the amount of variation between language varieties within Romania. See table 2 for the comparison results in a matrix.
Table 2. Levenshtein distances for Romania wordlists
1 Cluj Napoca
0.37557 2 Cluj Napoca
0.366503 0.350903 3 Bucharest 0.369848 0.331291 0.300021 4 Bacau
0.389484 0.350046 0.322625 0.271163 5 Bacau
0.404754 0.37587 0.36533 0.321516 0.344381 6 Bacau
Table 2 shows Levenshtein distances ranging from the most similar, Bacau 4 and Bacau 5, which were a husband and wife couple from the same city, to the most different, Cluj 1 and Bacau 6, which were both adult males from different regions. These results support the data from our other research tools which suggests that Romania is divided into regions, as it shows that geography is one of the most influential factors of language variation.
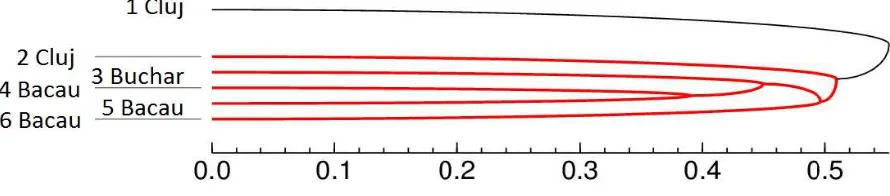
Another presentation of the data involves using the unweighted pair-group method algorithm (UPGMA—see http://www.icp.ucl.ac.be/~opperd/private/upgma.html to produce clusters based on Levenshtein distance. The output of this analysis allows us quickly and graphically see which variants are the most and least similar. See the output of this tool in figure 3.
Figure 3. Levenshtein Distance Cluster Dendrogram.
As we examine the dendrogram in figure 4, we can easily see that the participants from Cluj, the largest and most centrally located city in Transylvania, show the most evidence of variation when compared with the rest of the country, supporting the conclusions from our other tools.
In conclusion, our wordlist results agree with the results from our other tools, suggesting that the language variants in Transylvania show the most difference from the rest of the country.
4.3.3 Dialect Network Analysis
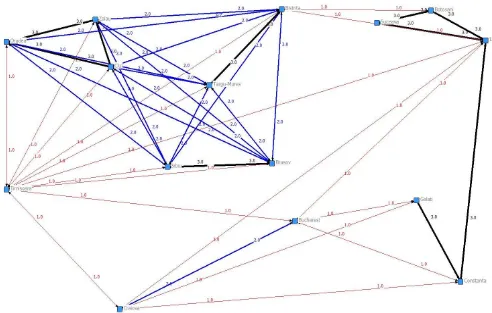
lines and number next to each line indicate how many focus groups made the same statement. If there is no line connecting two cities, no focus groups told us that those cities signed the same. We can see from the chart that language variation is centered in roughly three areas: the northwest Transylvania,
Moldavia, and the southern Wallachia region. While this tool does not define the Moldavia and Wallachia regions as clearly as Transylvania, it serves to triangulate our findings from the SLQ and suggests that signers in Transylvania sign more like each other than elsewhere in the country.
Figure 4. Dialect Network Analysis results.
4.4 Dialect prestige
Using the SLQ, we asked participants to identify the regions with which they found communication to be easiest. The goal of this was primarily to measure dialect prestige. Participants showed a strong
preference for communicating with other cities in close proximity to their hometown, which suggests two possibilities. First, that there is in fact dialectal variation within Romania, and second, that there is not an overriding desire to learn a more prestigious dialect from a larger city or more prestigious school, as is often the case.
Figure 5. Do you want all deaf people in Romania to sign the same?
4.5 Summary
In summary, we can conclude that there is significant evidence of language variation within Romania. The largest differences can be seen between Transylvania and the rest of the country, as supported by participant observation, questionnaires, wordlists, and dialect network analysis. The extent of the
variation and the impact it has on understanding fall mostly outside the scope of this survey; our primary tool for measuring this is the opinion and perception of our participants, which is inherently subjective. Also, we must distinguish between oral or signed communication, in the form of conversation or storytelling, and published communication, in the form of video publications. Face-to-face
communication will almost always contain some level of negotiation, and will vary from person to person, depending on their background, their relationship with the other party, and a host of other factors, making evaluation of language variation between sign language variants very difficult. In light of this, we must make our “best guess” regarding the amount of difference between two varieties, and rely heavily on subjective means of evaluation until community testing and more detailed analysis of larger bodies of data can be completed.
5 Language use
Here we discuss our data on language use, acquisition, and attitudes, using primarily interview and sociolinguistics questionnaire data. We find this data is useful for understanding the vitality of the language and the deaf community in Romania.
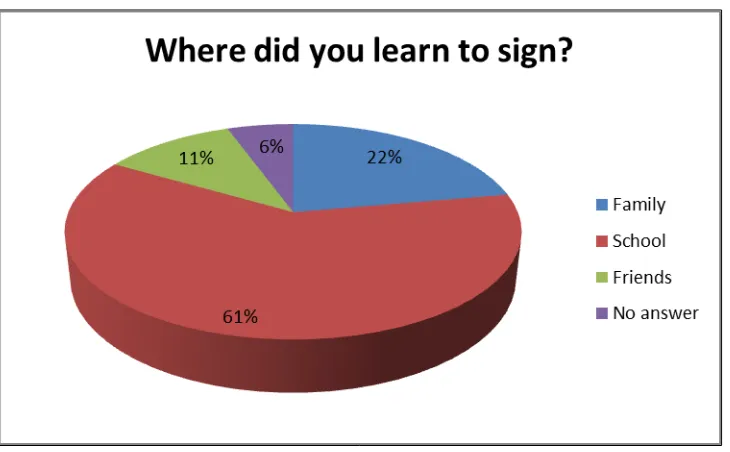
5.1 Language acquisition
Figure 6. Where did you learn to sign?
In addition to general language acquisition, we asked participants questions about cross-modality and cross-cultural language transmission, specifically between hearing parents and deaf children and the reverse. Responses to these questions were surprising: deaf parents were said to sign with their children by only 39% of participants, while 55% of hearing parents were said to sign with their deaf children. See figures 7 and 8 for detailed answers.
Figure 8. Do hearing parents sign with deaf children?
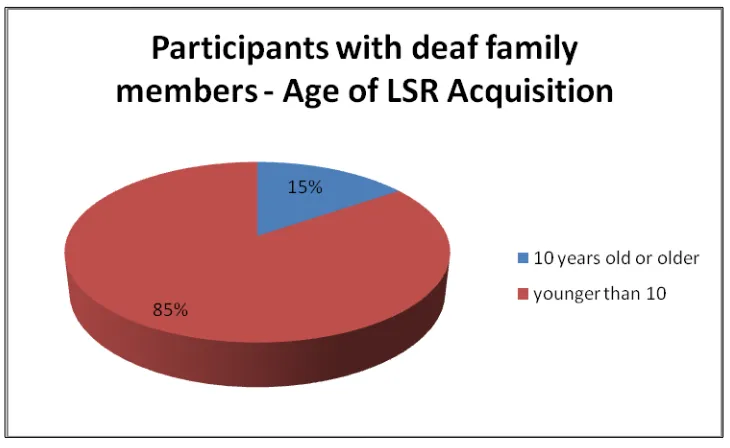
Our SLQ data also shows that having deaf family members has a significant effect on how young deaf community members begin to learn sign language. We found that 60% of our participants without deaf family members began to learn sign at ten years old or older, well after the age by which they would have been expected to have language competency. Participants with deaf family, however, showed a strong tendency to learn sign language at a younger age. We found that 85% of our participants with deaf family started signing before the age of ten. This suggests that generational language transmission within the deaf community is much stronger than outside the community. See figure 9 and figure 10 for details.
Figure 10. Participants with deaf family members: age of LSR acquisition.
5.2 Language attitudes
A large portion of our research was focused on measuring the language attitudes present in the Romanian deaf community. Participant observation and the SLQ were the tools we used to gather information in this area. Our general impressions were that of a deaf community with positive views of sign language and deaf culture and a desire for improvement in deaf education.
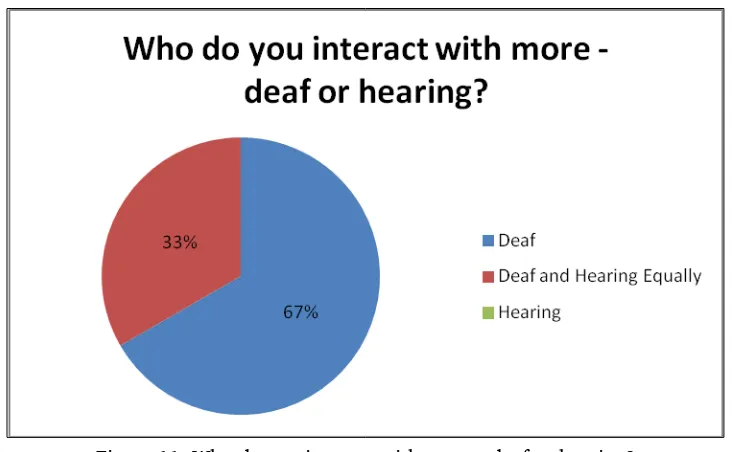
We begin with the SLQ question regarding who our participants interact with most on a daily basis. Responses to this question indicated very strongly that our participants spend most of their time with other members of the deaf community. None of participants claimed that they interact more with the hearing community. This suggests cohesion in the deaf community and indicates a vital language base. See figure 11 for more details. When we asked why each participant answered the way they did, answers fell into the following categories (generalized for anonymity).
• I interact with deaf people more because it’s easier to understand each other.
• It’s easier to socialize with deaf people.
• Sign language is easiest for me to communicate.
• The internet makes it possible for me to interact with hearing people.
Figure 11. Who do you interact with more—deaf or hearing?
In a related question, we asked participants how they communicated with the hearing community. Top responses included writing and texting (38%), speaking (31%), and lip reading (17%). See figure 12 for details.
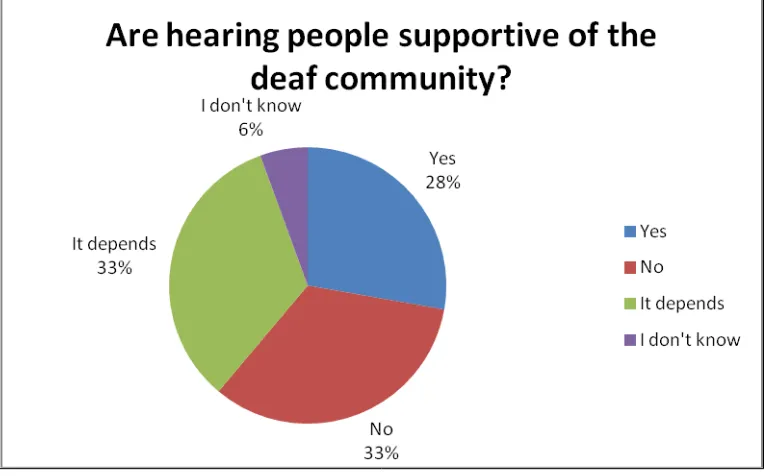
Participants were asked whether the Romanian hearing population was supportive of the deaf community; responses were split between yes, no, and it depends. See figure 13 for details. When asked to explain, participants gave the following responses, summarized below:
• Hearing people don’t learn to sign.
• Hearing people aren’t willing to communicate.
• Deaf people are paid less than hearing people.
• Hearing people oppress deaf people.
• Discrimination against deaf people is common.
• Hearing people are not patient with deaf people.
• Hearing people often help to interpret at the bank or the doctor.
• People who know sign language are supportive of deaf.
• Only a deaf person’s hearing family and friends are supportive.
These responses suggest that there are still significant strides to be made before the deaf community is recognized and fully supported by the hearing population.
Figure 13. Are hearing people supportive of the deaf community?
Figure 14. Which language is best for the deaf community: spoken or signed? Another indicator of language attitudes is the communities’ opinion of leadership, particularly which qualities they value in leadership. We asked participants to rank the qualities they expect in an effective leader—in our example—an association president. The following traits were ranked: deaf status, signing skill, education, literacy, and spoken language skills. Deaf status and signing skills were ranked highest, while spoken language skills were much less important. See figure 15 for details.
5.3 Summary
In summary, the Romanian deaf community shows several indicators of language vitality: pride in their language, regular interaction within the community, emphasizing deaf native signers in leadership, and passing the language and culture on to future generations.
6 Sociolinguistic environment
This section contains information about the general sociolinguistic environment in Romania, discussing topics relevant to the deaf community.
6.1 Cities and regions
Participant observation confirmed what our dialect network analysis suggested: that Romanian deaf perceive three separate regions, and that people from each region sign differently. We noted specifically that participants made a distinction between Transylvania and the rest of the country, and Hungarian signers as opposed to Romanian signers. We were told that the same is true for the hearing population. In many cases, we found that participants had a poor opinion of the capital city of Bucharest; several deaf parents told us that they avoid sending their children there to school.
We asked participants to identify the Romanian cities offering the best services for the deaf, such as schools, associations, and availability of interpreters. Cluj-Napoca came out on top by a wide margin, followed by Oradea and Bucharest. This is significant since we commonly find that cities with larger populations or centers of government offer more services. The fact that participants listed Bucharest third on the list (by a wide margin) suggests that Cluj-Napoca or Oradea would likely be a better choice of location for language development projects. See figure 16 for details.
6.2 Education and deaf schools
We were unable to obtain extensive information about deaf schools in Romania. While we were able to identify several dedicated deaf schools in the country, we were unable to contact many of them. We visited one school in Bucharest, and were given a tour and a chance to interview one of the teachers. He told us that teachers are required to be able to sign and must pass a test before teaching, and that deaf teachers are employed there, but was unable to give us information about the general state of deaf education in the country. Participants told us that most schools use oral education and that most teachers are hearing.
6.3 Deaf churches and ministries
Romania has a significant number of deaf churches. We were able to visit a deaf church in Zalau, and there are deaf-lead churches in Bucharest , Timisoara, Cluj, Piatra Neamt, Oradea, and Satu Mare (The Deaf Romanian Baptist Community 2012). Participants told us that they themselves or other members of the deaf community attend the following churches: Orthodox, Baptist, Roman Catholic, and Jehovah’s Witnesses. There are apparently very few published religious materials available in LSR. One significant mention is the Jesus Film, interpreted into LSR, available for purchase on DVD.
6.4 Associations, meeting places, and events
The foremost deaf organizer in the country is the Asociatia Nationala a Surzilor din Romania (ANSR), or the National Association of the Deaf in Romania. ASNR organizes over thirty associations, and offers legal aid to members of the deaf community. During our time in Romania, we were unable to meet with the leadership of ANSR because the organization was experiencing a change in leadership (Asociatia Nationala a Surzilor din Romania 2012).
6.5 Existing and desired language projects
Figure 17. Desired publications.
7 Conclusion and recommendations
Here we discuss the general situation of the deaf in Romania, summarize our findings, and recommend possible directions for future development. While our limited time in the country does not allow us to draw definite conclusions, it permits us to formulate a general summary of the sociolinguistic situation of the Romanian deaf community.
We found no evidence that LSR is related to sign languages used in other countries; however, from our fieldwork, we can safely say that LSR varies significantly from region to region within Romania, with the three major variants being located in Transylvania, Moldavia, and Wallachia. While it is unclear exactly how different these variations are and how much they impede communication, it is clear that deaf Romanians recognize the differences and require some level of negotiation for communication between regions. Although the different variants seem to interact regularly, we suspect that negotiation plays a large part in their communication. While face-to-face conversation seems feasible, we expect that published sign language materials such as Bible translation, dictionaries, or teaching materials, would have difficulty reaching all three regions.
Romania has a strong network of deaf organizations, including government support, established deaf churches, and several deaf schools. At the time of writing, though, the national deaf federation, ANSR, was undergoing significant change in leadership, and the outcome of these changes remains to be seen. Deaf education varies widely from region to region and school to school; many schools continue traditions of oral education, while others employ deaf teachers and offer classes in LSR.
21
Questionnaire templates were formed in Microsoft Word and include both open and closed questions. Table 3 contains the list of questions asked. Questions 1–6 examined the SLQ participant’s metadata (personal background information). Questions 7–12 collected basic information regarding the participant’s perception of the social situation of the deaf community. These questions could be used with either hearing or deaf people. Questions 13–28 gathered information about the participant’s language use and attitudes. The SLQ also included a brief explanation of the research, gave an opportunity for the participant to show consent for being involved in the project, and showed which level of accessibility the participant was willing to give for the use of any data they provided.
Table 3. Example Sociolinguistic Questionnaire
Participant Metadata
1. Roughly how old are you now?
2. Do you have any deaf family members? If so, who? 3. Where do you currently live?
4. How many years of education have you completed? 5. Please name the school(s) you have attended.
6. At what age did you first start signing? Where and instructed by whom? Name:
Deaf Services and Meeting Places
7. List associations and organizations serving deaf people in your area, or informal places where deaf people socialize, indicating their role/activities.
8. Do you attend religious services? If no, explain why not. If yes, please answer the following: What religious service/church do you attend? Why do you attend services? What language(s) does the service use? How many deaf people attend these services?
9. Please list the deaf schools in your area. How many years of education do these schools offer students? Please identify the communication philosophy of each school (oral, bilingual, TC (Total Communication), etc.).
10. Please list any published materials (videos, books, dictionaries, etc.) about/using the sign language in your area. Do deaf people use and/or like them?
11. Do deaf people in your community interact with deaf people from other regions in Romania? If so, please answer the following: Which other communities? Where and why do they meet?
12. Have deaf people here interacted with deaf people from other countries? If so, which countries?
Language Use and Attitudes
13. How well do deaf people sign in your community?
14. Do you interact more with deaf or hearing people? Why? How do you communicate with hearing people?
15. Do deaf parents sign with their hearing children? 16. Do hearing parents sign with their deaf children?
17. Are hearing people supportive of the deaf community? Explain your answer.
18. Do all deaf people in Romania sign the same? If no, what factors lead to different signing? 19. Do you want everyone in Romania to sign the same? Explain your answer.
21. Do you think that it is better for deaf people to use sign language or spoken language? Explain your answer.
22. How well do you read and write Romanian?
23. What does your deaf community need most to succeed in life?
Comparisons
24. Rank the need of language materials from highest to lowest (SL dictionary, interpreter training materials, Bible, signed educational materials).
25. When choosing a president in your deaf association/organization, how would you rank the importance of the following five characteristics (deaf, sign well, able to speak, able to read/write, well educated)?
26. Best city for deaf people to live in (most services, education, support, etc.). 27. City with sign language that is the easiest to understand.
28. City with the most beautiful sign language.
40 land 89 long 138 doctor 187 to search 236 devil
41 river 90 short 139 police 188 to meet 237 Jesus
42 island 91 old 140 king 189 to ask 238 Mary
43 rock 92 young 141 judge 190 to
understand
239 angel
44 water 93 weak 142 law 191 to lie 240 thank you
45 sun 94 strong 143 teacher 192 to kill 241 you’re
welcome
46 moon 95 fat 144 morning 193 sharp
47 stars 96 skinny 145 afternoon 194 pain
48 ice 97 poor 146 day 195 blood
25
Academic Network of European Disability Experts. 2012. Romania Information Page 2012. Accessed 10/8/2015. http://www.disability-europe.net/countries/romania.
Analytic Technologies. UCINET Homepage. 10 21, 2010. Accessed 10/8/2015.
http://www.analytictech.com/ucinet/.
Asociatia Nationala a Surzilor din Romania. 2012. Accessed 10/8/2015. http://www.ansr.org.ro.
Autorităţii Naţionale pentru Persoanel cu Handicap. 2012. General Information. Accessed 7/9/2015.
http://www.mmuncii.ro/j33/index.php/ro/protectie-sociala-2/124-directia-generala-protectia-persoanelor-cu-handicap.
Direcţia Protecţia Persoanelor cu Handicap (DPPH). People with Disabilities Division of the Ministry of Labour, Family, and Social Protection. 2012. Homepage Romanian Ministry of Labour, Family, and Social Protection. 2012. Accessed 7/9/2015.
http://www.crj.ro/userfiles/editor/files/RO-AR2013_publicat%281%29.pdf.
ELAN. Program documentation. The Language Archive. 2011. Nijmegen, The Netherlands: Max Planck Institute for Psycholinguistics. Accessed 7/9/2015. https://tla.mpi.nl/tools/elan/
European Union of the Deaf. 2013. European Union of the Deaf—Romania. Accessed 10/8/2015.
http://www.eud.eu/Romania-i-197.html.
Gallaudet University Library. 2012. Deaf Statistics 2012. Accessed 10/8/2015.
http://libguides.gallaudet.edu/content.php?pid=119476&sid=1061103.
Kleiweg, Peter. 2011. RuG/L04: Software for dialectometrics and cartography. Accessed 7/9/2015.
http://www.let.rug.nl/~kleiweg/L04/.
Lewis, M. Paul, Gary F. Simons, and Charles D. Fennig (eds.). 2015. Ethnologue: Languages of the world, Eighteenth edition. Dallas, Texas: SIL International. Accessed 7/9/2015. Online version:
http://www.ethnologue.com.
Lonely Planet. 2012. Accesssed 7/9/2015. http://www.lonelyplanet.com/romania/history. Ministerul Muncii, Familiei şi Protecţiei Sociale 2013. Accessed 7/9/2015.
http://www.mmuncii.ro/j33/index.php/ro/
Organizatia Nationala a Persoanelor cu Handicap din Romania. 2012. About Us. Organizatia Nationala a Persoanelor cu Handicap din Romania 2012. Accessed 7/9/2015. http://www.onphr.ro/.
Parks, Elizabeth, and Jason Parks. 2011. Rapid appraisal sign language survey procedures. ms. Parks, Jason, and John M. Clifton. 2011. Sign language word list comparisons: Toward a replicable
coding and scoring methodology. M.A. thesis. University of North Dakota. The Deaf Romanian Baptist Community. 2012. Accessed 10/8/2015.
http://deafbaptistusa.blogspot.com/.
The World Factbook: Romania. Accessed 10/8/2015. https://www.cia.gov/library/publications/the-world-factbook/geos/ec.html.
Treptow, Kurt, ed. 1997. A history of Romania. Iasi: Center for Romanian Studies.Accessed 10/8/2015.
https://networks.h-net.org/node/19384/reviews/19682/livezeanu-treptow-history-romania
Truong, Christina Lai, and Lilian Garcez. 2009. Participatory methods for language documentation and conservation: Building community awareness and engagement. Paper presented at the 1st
United Nations Enable. 2012. Convention and Optional Protocol Signatures and Ratifications. 2012. Accessed 7/9/2015. http://www.un.org/disabilities/countries.asp?navid=12&pid=166. White, Chad. 2011. Rugloafer. Website. Accessed 10/8/2015.
https://sites.google.com/site/rugloafer/home. Wycliffe Global Alliance. 2012. Accessed 7/13/2015.