Title: A novel solution for remote sensing of air quality: From satellite reflectance to ground PM2.5
Authors: Tongwen Li a, Huanfeng Shen a,b,c,*, Qiangqiang Yuan b,d, Liangpei Zhang b,e
Affiliations:
a School of Resource and Environmental Sciences, Wuhan University, Wuhan, Hubei, 430079,
China.
b The Collaborative Innovation Center for Geospatial Technology, Wuhan, Hubei, 430079,
China.
c The Key Laboratory of Geographic Information System, Ministry of Education, Wuhan
University, Wuhan, Hubei, 430079, China.
d School of Geodesy and Geomatics, Wuhan University, Wuhan, Hubei, 430079, China.
e The State Key Laboratory of Information Engineering in Surveying, Mapping and Remote
Sensing, Wuhan University, Wuhan, Hubei, 430079, China.
* Corresponding author:
Huanfeng Shen ([email protected])
Highlights:
We estimate ground PM2.5 from satellite reflectance rather than satellite-derived AOD.
The Ref-PM modeling achieves a satisfactory performance with deep learning.
ABSTRACT
With a large spatiotemporal coverage, the satellite-derived aerosol optical depth (AOD) has
been widely used to estimate ground-level PM2.5 concentrations (AOD-PM modeling).
However, the retrieval errors exit in the AOD products, and they will be accumulated in PM2.5
estimation. To avoid the intermediate error/process, a novel solution to estimate PM2.5 directly
from satellite top-of-atmosphere (TOA) reflectance (denoted as Ref-PM modeling) is
proposed. Using multiple linear regression, neural networks, and deep learning to establish
the specific relationship between PM2.5, satellite reflectance, and other predictors, the Ref-PM
modeling is validated with data from Wuhan Metropolitan Area in 2016. Furthermore, the
geographical correlation is incorporated into deep belief network (Geoi-DBN) to better
estimate PM2.5 concentrations. The results show that the performance of Ref-PM modeling
(cross-validation R2=0.64 for DBN) has a competitive advantage than that of conventional
AOD-PM modeling (cross-validation R2=0.46 for DBN). Moreover, the out-of-sample
cross-validation R2 and RMSE for Geoi-DBN in Ref-PM modeling are 0.87 and 9.89
g m
/
3,respectively. On this basis, the daily distributions of PM2.5 with a resolution of 0.01 degree are
mapped, and they have similar spatial patterns with ground station measurements. These
results demonstrate that the proposed Ref-PM modeling is effective for estimating
ground-level PM2.5 concentrations from satellite reflectance. This study will significantly
promote the application of satellite remote sensing in environmental monitoring.
1. Introduction
Fine particular matter (PM2.5, airborne particles less than 2.5
m
in the aerodynamicdiameter) has been reported to be associated with many adverse health effects including
cardiovascular and respiratory morbidity and mortality (Habre et al., 2014; Madrigano et al.,
2013). Previous studies have indicated that the severe PM2.5 pollution resulted in more than
1.2 million premature deaths in 2010 (Lim et al., 2012) and 1.6 million deaths in 2014 (Rohde
and Muller 2015). It is thus an urgent need to obtain accurate spatiotemporal distributions of
ground-level PM2.5 concentration for the environmental health concerns.
With a large spatiotemporal coverage, the satellite-derived aerosol optical depth (AOD) has
been widely used to expand PM2.5 estimation beyond those only provided by ground
monitoring stations (Di et al., 2016; Li et al., 2016; van Donkelaar et al., 2016). Many AOD
products have been adopted in the estimation of ground PM2.5, including those retrieved from
the Moderate Resolution Imaging Spectroradiometer (MODIS) (Li et al., 2017b), Multi-Angle
Implementation of Atmospheric Correction (MAIAC) (Xiao et al., 2017), Multiangle Imaging
SpectroRadiometer (MISR) (You et al., 2015), Geostationary Operational Environmental
Satellite Aerosol/Smoke Product (GASP) (Paciorek et al., 2008), and Visible Infrared Imaging
Radiometer Suite (VIIRS) (Wu et al., 2016). In addition, many models are developed to
establish the relationship between AOD and PM2.5 (AOD-PM2.5 relationship), such as multiple
linear regression (MLR) (Gupta and Christopher 2009b), geographically weighted regression
(GWR) (Hu et al., 2013), back-propagation neural network (BPNN) (Gupta and Christopher
2009a), linear mixed effects (LME) model (Lee et al., 2011), and so on. These models have
ground-observed PM2.5 (AOD-PM modeling).
The AOD products are retrieved from satellite top-of-atmosphere (TOA) reflectance by the
atmospheric radiative transfer model (e.g., 6S,MODTRAN) (Kaufman et al., 1997a; Levy et
al., 2007). Hence, the previous process of satellite-based PM2.5 estimation is to firstly retrieve
AOD from satellite TOA reflectance (for AOD-PM2.5 studies, the AOD products are usually
provided by others), and subsequently estimate ground-level PM2.5 from satellite-derived
AOD. Previous studies have reported that a great uncertainty exists in the retrieval of AOD,
especially in urban area (Munchak et al., 2013). The retrieval error of AOD will inevitably be
accumulated in the estimation of PM2.5. To avoid the intermediate error/process, whether can
we estimate ground-level PM2.5 directly from satellite reflectance?
To estimate ground PM2.5 from satellite reflectance is actually a process to model the
relationship between them (denoted as Ref-PM modeling) using statistical approaches.
Previous studies (Radosavljevic et al., 2007; Ristovski et al., 2012) adopted neural networks
to learn a functional relationship between MODIS observations and ground AOD, and the
results show that neural-network-based AOD retrievals were more accurate than the
physically based products. In addition, neural network models were developed to estimate
ground-level PM2.5 using satellite-derived AOD, and outperform the conventional models (Li
et al., 2017b; Wu et al., 2012). We can find that the physical process of AOD retrieval can be
simulated by neural networks, and the same to AOD-PM2.5 relationship. Therefore, previous
studies provide sufficient evidences for the potential to estimate ground PM2.5 from satellite
reflectance, and neural network models are a preferred choice. According to our previous
may be a better tool for Ref-PM modeling. It is thus promising to estimate ground PM2.5
directly from satellite reflectance.
In this study, we propose a deep learning-based solution to estimate ground-level PM2.5
using satellite reflectance rather than AOD products. The Ref-PM modeling is validated with
the data from Wuhan Metropolitan Area (Fig. 1) in 2016. We also establish the AOD-PM
modeling using 3-km MODIS AOD products for comparison. The proposed solution for air
quality assessment will significantly promote the application of satellite remote sensing in
environmental monitoring.
2. Study region and data
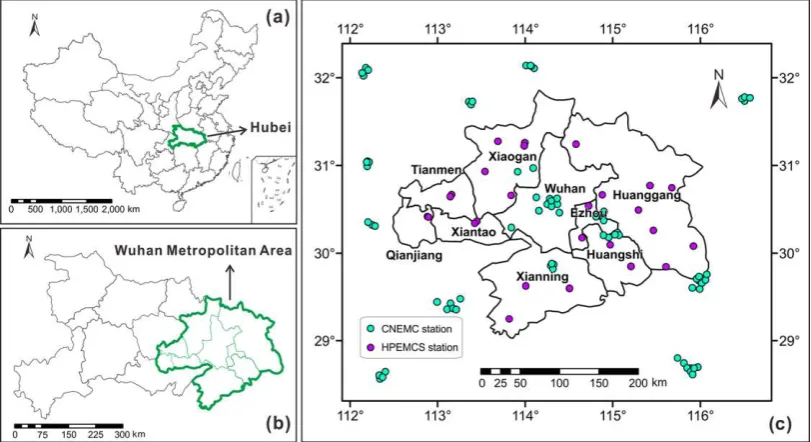
Figure 1. Study region and the spatial distribution of PM2.5 stations. (a) The location of Hubei province in China. (b) The boundary of Wuhan Metropolitan Area in Hubei province. (c) The Wuhan Metropolitan Area and the distribution of PM2.5 monitoring stations.
The study region is Wuhan Metropolitan Area (WMA), which is presented in Fig. 1. The
study period is a total year of 2016. WMA is located in Hubei province, central China (as
latitude of 28.4° ~32.3 ° and longitude of 112.0° ~116.7° are all adopted in our analysis.
WMA is an urban group with the center of Wuhan, covering the vicinity 8 cities (Huangshi,
Ezhou, Huanggang, Xiaogan, Xianning, Xiantao, Qianjiang, and Tianmen). It has the total
population of greater than 30 million, which account for more than a half of the total
population of Hubei province. With over 60% of Gross Domestic Product (GDP) of Hubei
province, WMA is one of the largest urban groups in central China. In 2007, it is authorize as
one of the pilot areas for national resource-saving and environment-friendly society reforming
by the Chinese government.
Due to the dense urbanization and industrial activities, WMA is suffering serious air
pollution. Wuhan is especially populated with fine-mode particles (Wang et al., 2015), and the
mean atmospheric PM2.5 mass concentration was about 160 ± 50
3
/
g m
(Wang et al., 2014).Moreover, with the rapid economic development, the other cities in WMA (e.g., Ezhou and
Huangshi) also have a high level of PM2.5 concentration. It is thus very urgent and necessary
to obtain the spatiotemporal information of PM2.5 in this area.
2.1. Ground-level PM2.5 measurements
Hourly PM2.5 concentration data across WMA in 2016 were obtained from the China
National Environmental Monitoring Center (CNEMC) website (http://www.cnemc.cn) and the
Hubei Provincial Environmental Monitoring Center Station (HPEMCS) website
(http://www.hbemc.com.cn/). In this study, 77 CNEMC stations and 27 HPEMCS stations
(104 stations in total) are included. The distribution of PM2.5 stations is shown in Fig. 1 (c).
We can find that the CNEMC stations are unevenly distributed, while the HPEMCS stations
(CNAAQS, GB3905-2012), the ground PM2.5 concentrations are measured by the tapered
element oscillating microbalance method (TEOM) or with beta attenuation monitors (BAMs
or beta-gauge), with an uncertainty of 0.75% for the hourly record (Engel-Cox et al., 2013).
We averaged hourly PM2.5 to daily mean PM2.5 data for the estimation of ground-level PM2.5.
2.2. Satellite observations
The Aqua Moderate Resolution Imaging Spectroradiometer (MODIS) Level 1B calibrated
radiances (MYD02) product was downloaded from the Level 1 and Atmosphere Archive and
Distribution System (LAADS) website (http://ladsweb.nascom.nasa.gov). They have a spatial
resolution of 1 km at nadir. We extracted top-of-atmosphere reflectance on channels 1, 3 and
7 (B1, B3 and B7 reflectance), and observation angels, i.e., sensor azimuth (SensorA), sensor
zenith (SensorZ), solar azimuth (SoarA) and solar zenith (SolarZ), from this product. To
screen cloud contamination, the MODIS cloud mask product (MYD35_L2) was adopted.
They are available at a resolution of 1 km every day. Furthermore, the MODIS normalized
difference vegetation index (NDVI) product (Level 3, MYD13) with a resolution of 1 km
every 16 days, were also downloaded from the LAADS website. For a comparison purpose,
the MODIS aerosol optical depth (AOD) product of Collections 6 was utilized to establish
AOD-PM2.5 model. They have a spatial resolution of 3 km (Munchak et al., 2013).
2.3. Meteorological data
The Goddard Earth Observing System Data Assimilation System GEOS-5 Forward
Processing (GEOS 5-FP) (Lucchesi 2013) meteorological data were used in this study. GEOS
5-FP uses an analysis developed jointly with NOAA’s National Centers for Environmental
take advantage of the developments at NCEP and the Joint Center for Satellite Data
Assimilation (JCSDA). Details can be found at the website
(https://gmao.gsfc.nasa.gov/forecasts/). It has a spatial resolution of 0.25° latitude × 0.3125°
longitude. We extracted relative humidity (RH, %), air temperature at a 2 m height (TMP, K),
wind speed at 10 m above ground (WS, m/s), surface pressure (PS, kPa), and planetary
boundary layer height (PBL, m) from the GEOS 5-FP dataset. Each variable was regridded to
0.01° to be consist with satellite observations.
2.4. Data integration
Firstly, a 0.01-degree grid was created for the data integration, model establishment, and
mapping. For each 0.01-degree grid, ground-level PM2.5 measurements from multiple stations
are averaged. Meanwhile, we resampled the meteorological data with a spatial resolution of
0.25°× 0.3125° to 0.01° to match with satellite observations. All the data were re-projected to
the same coordinate system. Finally, we extracted satellite observations, meteorological
parameters on locations where PM2.5 measurement are available.
3. Methodology
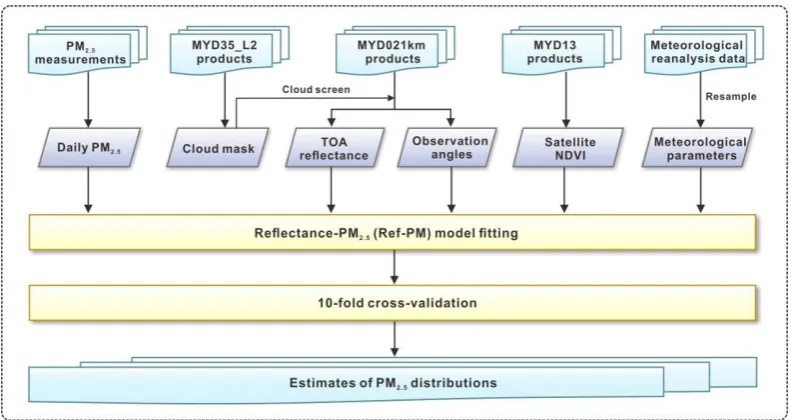
The Ref-PM modeling was developed to estimate ground-level PM2.5 from satellite
reflectance rather than satellite-derived AOD. Generally, the structure of Ref-PM modeling is
shown as Eq. (1), containing dependent variable (PM2.5 concentration) and two types of
predictors (satellite observations and meteorological parameters). Details of Ref-PM
modeling are illustrated in Fig. 2.
2.5 1, 3, 7, , , , , , , , , ,
PM f B B B SensorA SensorZ SolarA SolarZ RH WS TMP PBL PS NDVI (1)
azimuth, sensor zenith, solar azimuth, and solar zenith) are utilized, inspired by the dark target
(DT) algorithm (Kaufman et al., 1997a; Kaufman et al., 1997b).
Figure 2. The schematics of Ref-PM modeling for the estimation of PM2.5.
To model the specific relationship between PM2.5 and predictors, a conventional statistical
model (multiple linear regression, MLR) (Gupta and Christopher 2009b), neural networks
(back-propagation neural network, BPNN; generalized regression neural network, GRNN)
(Gupta and Christopher 2009a; Li et al., 2017b), and a deep learning model (deep belief
network, DBN) (Li et al., 2017a) are adopted. On this basis, the spatiotemporal
autocorrelation of PM2.5 is incorporated into the Ref-PM modeling. The spatial and temporal
terms in conjunction with the above variables can greatly improve the model performance.
The details can be seen in somewhere else (Li et al., 2017a), and the deep learning model
which considers the spatiotemporal autocorrelation of PM2.5 is denoted as Geoi-DBN. The
objective of this study is to develop a new solution (Ref-PM modeling) to remote sensing of
PM2.5 concentration. We will thus compare the performance of Ref-PM modeling with that of
A 10-fold cross-validation (CV) technique (Rodriguez et al., 2010) was used to test the
potential of model overfitting and predictive power. Previous studies usually used
sample-based CV (Li et al., 2017b; Ma et al., 2014) or site-based CV (Lee et al., 2011; Xie et
al., 2015). For sample-based CV, all samples in the model dataset are randomly and equally
divided into ten subsets. One subset is used as testing samples and the rest subsets are used to
fit the model for each round of validation. For site-based CV, one monitoring station is used
for validation and the remaining stations for model fitting in each round. In this study, we
chose sample-based 10-fold CV, which is more widely used (Ma et al., 2016). We adopted the
statistical indicators of the coefficient of determination (R2), the root-mean-square error
(RMSE,
g m
/
3), the mean prediction error (MPE,
g m
/
3), and the relative prediction error(RPE, defined as RMSE divided by the mean ground-level PM2.5) to evaluate the model
performance.
4. Results and discussion
4.1. Descriptive statistics
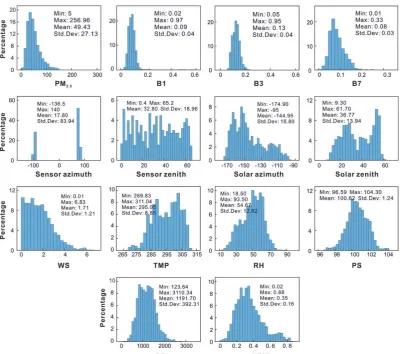
Fig. 3 shows the histograms and descriptive statistics of the variables in sample dataset.
The PM2.5 concentrations range from 5
3
/
g m
to 256.96
g m
/
3, with an average of49.43
g m
/
3. The B1, B3, and B7 reflectance are mostly distributed in 0~0.2, with meanvalues of 0.09, 0.13, and 0.08, respectively. We can find that the satellite reflectance,
temperature, relative humidity, surface pressure, height of planetary boundary layer, and
NDVI have similar patterns with PM2.5 concentrations, while the satellite observation angles
Figure 3. Histograms and descriptive statistics of Ref-PM modeling variables in the sample dataset.
4.2. Comparison between Ref-PM and AOD-PM modeling
Table 1. Performance comparison between Ref-PM and AOD-PM modeling
Modeling Model fitting Cross-validation
R2 RMSE MPE RPE (%) R2 RMSE MPE RPE (%)
Ref-PM (N=4181)
MLR 0.34 22.26 16.37 44.99 0.34 22.19 16.37 44.83 BPNN 0.72 14.55 10.73 29.21 0.59 17.51 12.72 35.39 GRNN 0.74 14.57 10.23 29.51 0.61 17.29 12.29 34.94 DBN 0.77 12.71 9.44 25.68 0.64 16.75 12.11 33.84
AOD-PM (N=1658)
MLR 0.26 24.12 17.33 47.64 0.27 23.97 17.27 47.31 BPNN 0.48 20.01 14.43 39.68 0.40 21.60 15.26 42.86 GRNN 0.56 19.40 13.34 38.45 0.42 21.43 14.95 42.54 DBN 0.53 19.26 13.47 38.20 0.46 20.57 14.60 40.83 Table 1 shows the performance comparison between Ref-PM and AOD-PM modeling. The
sample size of AOD-PM modeling dataset (N=1658) is much smaller than Ref-PM modeling
coverage than AOD product. Comparing to AOD-PM modeling, the Ref-PM modeling reports
a competitive performance. For MLR model, the cross-validation R2 and RMSE are 0.34,
22.19
g m
/
3 for Ref-PM modeling, and 0.27, 23.97
g m
/
3 for AOD-PM modeling. Forlearning-based models, the differences between Ref-PM modeling and AOD-PM modeling is
larger, for instance, the cross-validation R2 of DBN model is 0.64 and 0.46, respectively, with
a variation of 0.18. These results demonstrate that the Ref-PM modeling obtains a better
performance than AOD-PM modeling, especially based on learning-based models (BPNN,
GRNN, and DBN). However, it should be noted that there is a scale variation between
Ref-PM modeling dataset (1 km) and AOD-PM modeling dataset (3 km). We resampled the
Ref-PM modeling dataset to 3 km, and reconstruct Ref-PM models. The cross-validation R2
and RMSE of 3 km DBN in Ref-PM modeling is 0.56 and 18.16
g m
/
3. With the sameresolution, the 3-km Ref-PM modeling still has some advantages in estimating ground-level
PM2.5. Furthermore, the reflectance data and AOD product have different spatial coverage, we
evaluate Ref-PM and AOD-PM modeling with their shared data records (N=935), the R2 and
RMSE of the former are 0.64 and 14.12
g m
/
3, respectively; 0.48 and 17.64
g m
/
3 forthe latter. All these results show that Ref-PM modeling reports a higher accuracy of PM2.5
estimation than AOD-PM modeling, which can be probably attributed to the avoidance of
intermediate error.
For both Ref-PM modeling and AOD-PM modeling, DBN model performs the best,
followed by GRNN and BPNN models, and MLR gives the poorest performance. The
conventional MLR statistical model cannot well represent the nonlinear process of Ref-PM
this issue. With a more complicated structure, deep learning (DBN) show its superior in
describe the relationship between PM2.5 and predictors. Allowing for the superiority of the
DBN model, we will adopt the DBN model for further analysis of Ref-PM modeling.
4.3. Performance of geo-intelligent Ref-PM modeling
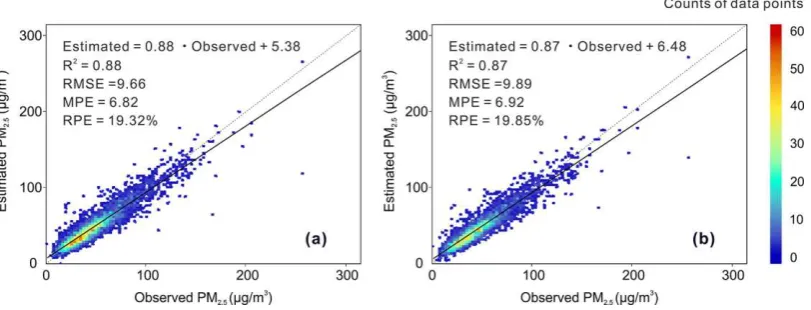
Figure 4. Results of Geoi-DBN (a) model fitting and (b) cross validation.
According to our previous study (Li et al., 2017a), incorporating geographical correlation
can greatly improve the accuracy of PM2.5 estimation. Fig. 4 shows the scatter plots of
Geoi-DBN model. The R2 and RMSE of model fitting are 0.88 and 9.66 3
/
g m
, respectively.For cross validation, the Geoi-DBN model achieves a satisfactory result, with R2 and RMSE
value of 0.87 and 9.89
g m
/
3, respectively. Our results show this study has a greatadvantage than previous regional studies of PM2.5 estimation in Beijing (R2=0.81,
RMSE=18.89
g m
/
3) (Xie et al., 2015) and Yangtze River Delta Region (R2=0.67,RMSE=15.82
g m
/
3) (Ma et al., 2016). On the other hand, the cross-validation slope for theGeoi-DBN model is 0.87, with an intercept of 6.48
g m
/
3. This means that the proposedapproach tends to estimate when the ground PM2.5 concentrations are greater than 50
3
/
g m
.These results indicate some evidence for estimation bias of our method (Li et al., 2017a). The
averaged modeling framework. The sampling distribution of monitors in a grid may not give a
great estimation of the spatially averaged concentration for that grid.
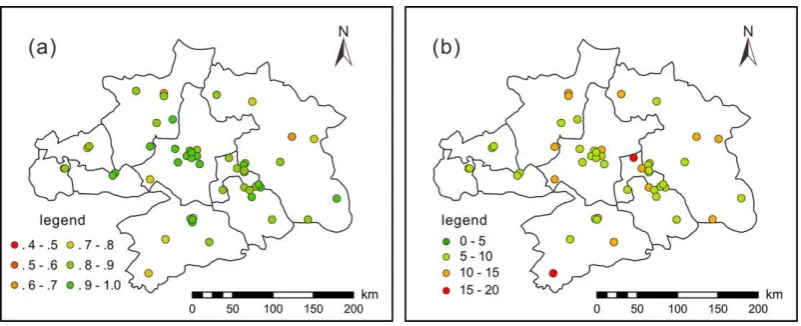
Furthermore, the seasonal and spatial performance of the Geoi-DBN model was evaluated.
Seasonally, the R2 values for spring (March, April, and May), summer (June, July, and
August), autumn (September, October, and November) and winter (January, February, and
December) are 0.85, 0.78, 0.77, and 0.86, respectively. Spatially, the R2 and RMSE values
between the observed and estimated PM2.5 were calculated, and are shown in Fig. 4. Overall,
the Geoi-DBN model has achieved a satisfactory performance, with 81.63% of grids reporting
a high R2 of greater than 0.8. The higher R2 and lower RMSE values are found in central
Wuhan, however lower R2 and higher RMSE values are reported in Huanggang, Xiaogan, and
Xianning. The possible reason for this could be the uneven distribution of monitoring stations.
Figure 5. Spatial distribution of (a) R2 and (b) RMSE between observed PM
2.5 and estimated PM2.5.
4.4. Mapping of PM2.5 distribution
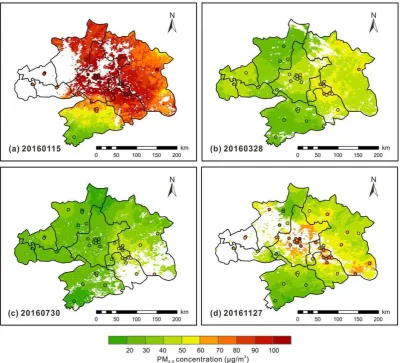
On the basis of Geoi-DBN model for Ref-PM modeling, the daily PM2.5 concentration is
estimated. Fig. 6 presents daily estimates on some certain days. We selected one day in each
season, and these days have as many as valid estimates. As shown in this figure, the derived
January 15, 2016 (in winter) has the highest level, while the lowest values are found on July
30, 2016 (in summer).
Figure 6. Daily estimates of PM2.5 on some certain days. The white regions indicate missing data.
To further evaluate our results at daily scale, we calculated RPE between derived PM2.5 and
observed PM2.5 on each day, which is shown in Fig. 7. Due to the missing data, only 125 days
have valid estimates of PM2.5 covering more than 2 stations. Over 87% of the days have a
RPE value of less than 30%. These results demonstrate that the proposed Ref-PM modeling
Figure 7. Distribution of daily RPE between observed PM2.5 and derived PM2.5.
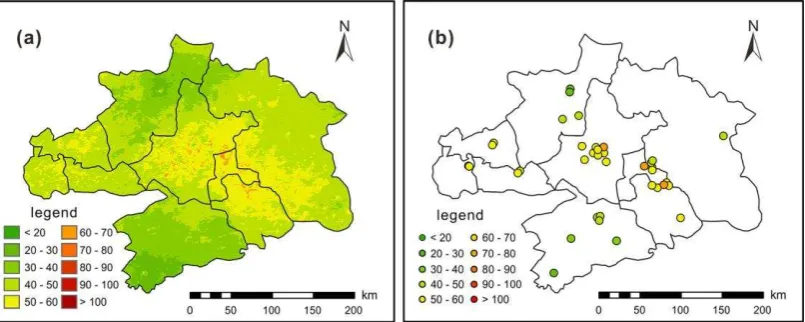
Figure 8. Annual mean distribution of PM2.5 concentrations across WMA in 2016, (a) derived PM2.5, (b) ground-observed PM2.5. It should be noted that we calculated annual mean PM2.5 with valid days
greater than 270 from station measurements. Thus, some stations, which are in service from the later year, are not seen in this figure.
Furthermore, the annual mean distribution of PM2.5 in WMA is mapped. Fig. 8 presents the
satellite-derived and ground-observed PM2.5 concentrations. Overall, the satellite-derived
PM2.5 has a similar spatial pattern with ground measurements. Spatially, higher levels of PM2.5
concentrations are found in Wuhan, Ezhou, and Huangshi cities, while lower values are
reported in the other cities. The PM2.5 pollution presents a pattern of “higher center, lower
vicinity”, which is consistent to the urbanization level of these cities. Wuhan, a
coal-smoke air pollution and exhaust gas of vehicle. While the coal-smoke air pollution are
found in Ezhou, Huangshi cities, which are rapidly developing industrial cities. Moreover,
agricultural cities and eco-tourism cities including Xianning and Qianjiang have a lower level
of PM2.5 pollution.
4.5. Discussion
The satellite reflectance and observation angles are adopted to establish the Ref-PM
modeling. The observation angles are used as auxiliary variables to retrieve AOD from
satellite TOA reflectance (Kaufman et al., 1997a). We would like to see whether or not they
can be eliminated from the input variables. Hence, we further evaluate the influence of
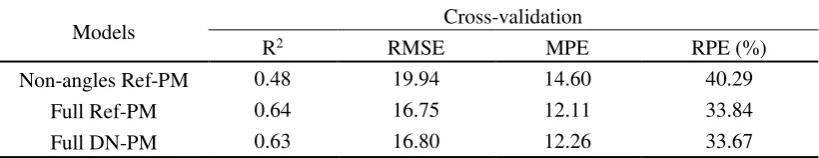
observation angles on Ref-PM modeling. The results are presented in Table 2. When the
observation angles are not incorporated in the DBN model (Non-angles Ref-PM model), the
cross-validation R2 and RMSE are 0.48 and 19.94 3
/
g m
. However, the model performanceis greatly improved (from 0.46 to 0.64 for R2) by considering the observation angles. These
results indicate that the satellite observation geometry is important for the Ref-PM modeling.
The radiometric calibration was conducted to obtain satellite TOA reflectance from digital
number (DN) signals. It is a linear transformation from DN signals to TOA reflectance, and
should have no impact on deep learning. This means that estimating PM2.5 from DN signals
should obtain the same results with Ref-PM modeling. However the calibration coefficients
vary by day, the relationship between TOA reflectance and DN signals is not linear during the
whole study period. Hence, we constructed the model between PM2.5 and DN (DN-PM
modeling) for comparison. As shown in Table 2, the DN-PM modeling reports a similar
be omitted for estimating PM2.5. However, the objective of this study is to estimate ground
PM2.5 by avoiding AOD retrieval, which is conducted using TOA reflectance. The Ref-PM
and AOD-PM modeling should be fully compared. Hence the satellite reflectance is adopted
in this paper.
Table 2. Performance of various modeling strategies
Models Cross-validation
R2 RMSE MPE RPE (%)
Non-angles Ref-PM 0.48 19.94 14.60 40.29
Full Ref-PM 0.64 16.75 12.11 33.84
Full DN-PM 0.63 16.80 12.26 33.67
There are still some space to improve this study. Firstly, the retrieval of AOD often meets a
challenge, which is the bright surface (B7>0.15) (Li et al., 2005). How the bright surface
affects Ref-PM modeling should been further discussed in future studies. Secondly, the
satellite observations used (i.e., B1, B3, B7 reflectance, and angles) are inspired by the
inspired by the dark target algorithm, the selection of satellite parameters still has room for
researching. Whether or not incorporating more channels (such as B2, B4, and B5 reflectance)
into the Ref-PM modeling has a positive effect?
5. Conclusions
To sum up, this study has several advantages. Firstly, a novel solution for remote sensing of
air pollution, i.e., estimating PM2.5 directly from satellite reflectance, is proposed. It can avoid
the intermediate error/process, and obtain a competitive performance compared with the
conventional AOD-PM modeling. Secondly, benefiting from the advanced Geoi-DBN
approach, the fine-scale and high accuracy distribution of PM2.5 in WMA are mapped.
of 0.46 and 20.57
g m
/
3 , respectively. While a better result (R2=0.64,RMSE=16.75
g m
/
3) for DBN in the Ref-PM modeling is reported. The results indicate thatthe proposed Ref-PM modeling is effective for estimating ground-level PM2.5 from satellite
reflectance. Furthermore, the out-of-sample R2 and RMSE for Geoi-DBN model are 0.87 and
9.89
g m
/
3, respectively. On this basis, the daily distributions of PM2.5 in WMA are mapped,they have similar spatial patterns with ground station measurement. All these results can say
that the proposed approach has the capacity to estimate PM2.5 concentration from satellite
observations, and provide useful information for pollution monitoring.
In future studies, we will firstly promote the application of the proposed Ref-PM modeling
solution to some newly launched satellites. For instance, the Himawari-8 satellite has the
capacity to measure atmospheric parameters, but the retrieval algorithm of aerosol has not
been fully validated. The proposed Ref-PM modeling may well address this issue, and obtain
timely satellite-derived PM2.5 data. Secondly, we would like to make some attempts on the
estimation of PM2.5 from high-resolution satellite observations. The existing satellite-based
estimates of PM2.5 still have some limitations in pollution monitoring at urban scale.
Acknowledgments
This work was funded by the National Key R&D Program of China (2016YFC0200900)
and the National Natural Science Foundation of China (41422108). We are grateful to the
China National Environmental Monitoring Center (CNEMC), the Hubei Provincial
Environmental Monitoring Center Station (HPEMCS), the Goddard Space Flight Center
Distributed Active Archive Center (GSFC DAAC), the US National Aeronautics and Space
Reference
Di, Q., Koutrakis, P., & Schwartz, J. (2016). A hybrid prediction model for PM2.5 mass and components using a chemical transport model and land use regression. Atmospheric Environment,
131, 390-399
Engel-Cox, J., Kim Oanh, N.T., van Donkelaar, A., Martin, R.V., & Zell, E. (2013). Toward the
next generation of air quality monitoring: Particulate Matter. Atmospheric Environment, 80, 584-590
Gupta, P., & Christopher, S.A. (2009a). Particulate matter air quality assessment using integrated surface, satellite, and meteorological products: 2. A neural network approach. Journal of
Geophysical Research: Atmospheres, 114, D20205
Gupta, P., & Christopher, S.A. (2009b). Particulate matter air quality assessment using integrated surface, satellite, and meteorological products: Multiple regression approach. Journal of Geophysical Research: Atmospheres, 114, D14205 southeastern U.S. using geographically weighted regression. Environmental Research, 121, 1-10
Kaufman, Y.J., Tanré, D., Remer, L.A., Vermote, E.F., Chu, A., & Holben, B.N. (1997a). Operational remote sensing of tropospheric aerosol over land from EOS moderate resolution
imaging spectroradiometer. Journal of Geophysical Research: Atmospheres, 102, 17051-17067
Kaufman, Y.J., Wald, A.E., Remer, L.A., Bo-Cai, G., Rong-Rong, L., & Flynn, L. (1997b). The MODIS 2.1-μm channel-correlation with visible reflectance for use in remote sensing of aerosol. IEEE Transactions on Geoscience and Remote Sensing, 35, 1286-1298
Lee, H., Liu, Y., Coull, B., Schwartz, J., & Koutrakis, P. (2011). A novel calibration approach of
MODIS AOD data to predict PM2.5 concentrations. Atmospheric Chemistry and Physics, 11, 7991-8002
Levy, R.C., Remer, L.A., Mattoo, S., Vermote, E.F., & Kaufman, Y.J. (2007). Second-generation operational algorithm: Retrieval of aerosol properties over land from inversion of Moderate
Resolution Imaging Spectroradiometer spectral reflectance. Journal of Geophysical Research: Atmospheres, 112, n/a-n/a
1-km aerosol optical depth from MODIS measurements over Hong Kong. IEEE Transactions on
Geoscience and Remote Sensing, 43, 2650-2658
Li, T., Shen, H., Yuan, Q., Zhang, X., & Zhang, L. (2017a). Estimating ground-level PM2. 5 by fusing satellite and station observations: A geo-intelligent deep learning approach. arXiv preprint arXiv:1707.03558
Li, T., Shen, H., Zeng, C., Yuan, Q., & Zhang, L. (2017b). Point-surface fusion of station
measurements and satellite observations for mapping PM2.5 distribution in China: Methods and assessment. Atmospheric Environment, 152, 477-489
Li, Z., Zhang, Y., Shao, J., Li, B., Hong, J., Liu, D., Li, D., Wei, P., Li, W., Li, L., Zhang, F., Guo, J., Deng, Q., Wang, B., Cui, C., Zhang, W., Wang, Z., Lv, Y., Xu, H., Chen, X., Li, L., & Qie, L.
(2016). Remote sensing of atmospheric particulate mass of dry PM2.5 near the ground: Method validation using ground-based measurements. Remote Sensing of Environment, 173, 59-68
Lim, S.S., Vos, T., Flaxman, A.D., Danaei, G., Shibuya, K., Adair-Rohani, H., AlMazroa, M.A., Amann, M., Anderson, H.R., Andrews, K.G., Aryee, M., Atkinson, C., Bacchus, L.J., Bahalim,
A.N., Balakrishnan, K., Balmes, J., Barker-Collo, S., Baxter, A., Bell, M.L., Blore, J.D., Blyth, F., Bonner, C., Borges, G., Bourne, R., Boussinesq, M., Brauer, M., Brooks, P., Bruce, N.G., Brunekreef, B., Bryan-Hancock, C., Bucello, C., Buchbinder, R., Bull, F., Burnett, R.T., Byers,
T.E., Calabria, B., Carapetis, J., Carnahan, E., Chafe, Z., Charlson, F., Chen, H., Chen, J.S., Cheng, A.T.-A., Child, J.C., Cohen, A., Colson, K.E., Cowie, B.C., Darby, S., Darling, S., Davis, A.,
Degenhardt, L., Dentener, F., Des Jarlais, D.C., Devries, K., Dherani, M., Ding, E.L., Dorsey, E.R., Driscoll, T., Edmond, K., Ali, S.E., Engell, R.E., Erwin, P.J., Fahimi, S., Falder, G., Farzadfar, F., Ferrari, A., Finucane, M.M., Flaxman, S., Fowkes, F.G.R., Freedman, G., Freeman, M.K., Gakidou,
E., Ghosh, S., Giovannucci, E., Gmel, G., Graham, K., Grainger, R., Grant, B., Gunnell, D., Gutierrez, H.R., Hall, W., Hoek, H.W., Hogan, A., Hosgood, H.D., Hoy, D., Hu, H., Hubbell, B.J.,
Hutchings, S.J., Ibeanusi, S.E., Jacklyn, G.L., Jasrasaria, R., Jonas, J.B., Kan, H., Kanis, J.A., Kassebaum, N., Kawakami, N., Khang, Y.-H., Khatibzadeh, S., Khoo, J.-P., Kok, C., Laden, F.,
Lalloo, R., Lan, Q., Lathlean, T., Leasher, J.L., Leigh, J., Li, Y., Lin, J.K., Lipshultz, S.E., London, S., Lozano, R., Lu, Y., Mak, J., Malekzadeh, R., Mallinger, L., Marcenes, W., March, L., Marks, R., Martin, R., McGale, P., McGrath, J., Mehta, S., Memish, Z.A., Mensah, G.A., Merriman, T.R.,
Micha, R., Michaud, C., Mishra, V., Hanafiah, K.M., Mokdad, A.A., Morawska, L., Mozaffarian, D., Murphy, T., Naghavi, M., Neal, B., Nelson, P.K., Nolla, J.M., Norman, R., Olives, C., Omer,
S.B., Orchard, J., Osborne, R., Ostro, B., Page, A., Pandey, K.D., Parry, C.D.H., Passmore, E., Patra, J., Pearce, N., Pelizzari, P.M., Petzold, M., Phillips, M.R., Pope, D., Pope, C.A., Powles, J., Rao, M., Razavi, H., Rehfuess, E.A., Rehm, J.T., Ritz, B., Rivara, F.P., Roberts, T., Robinson, C.,
Rodriguez-Portales, J.A., Romieu, I., Room, R., Rosenfeld, L.C., Roy, A., Rushton, L., Salomon, J.A., Sampson, U., Sanchez-Riera, L., Sanman, E., Sapkota, A., Seedat, S., Shi, P., Shield, K.,
Shivakoti, R., Singh, G.M., Sleet, D.A., Smith, E., Smith, K.R., Stapelberg, N.J.C., Steenland, K., Stöckl, H., Stovner, L.J., Straif, K., Straney, L., Thurston, G.D., Tran, J.H., Van Dingenen, R., van Donkelaar, A., Veerman, J.L., Vijayakumar, L., Weintraub, R., Weissman, M.M., White, R.A.,
A.D., Yip, P., Zielinski, J.M., Lopez, A.D., Murray, C.J.L., & Ezzati, M. (2012). A comparative
risk assessment of burden of disease and injury attributable to 67 risk factors and risk factor clusters in 21 regions, 1990–2010: a systematic analysis for the Global Burden of Disease Study
2010. The Lancet, 380, 2224-2260
Lucchesi, R. (2013). File Specification for GEOS-5 FP. In. GMAO Office Note No. 4 (Version
1.0)
Ma, Z., Hu, X., Huang, L., Bi, J., & Liu, Y. (2014). Estimating Ground-Level PM2.5 in China Using Satellite Remote Sensing. Environmental Science & Technology, 48, 7436-7444
Ma, Z., Liu, Y., Zhao, Q., Liu, M., Zhou, Y., & Bi, J. (2016). Satellite-derived high resolution PM2.5 concentrations in Yangtze River Delta Region of China using improved linear mixed
effects model. Atmospheric Environment, 133, 156-164
Madrigano, J., Kloog, I., Goldberg, R., Coull, B.A., Mittleman, M.A., & Schwartz, J. (2013).
Long-term Exposure to PM(2.5) and Incidence of Acute Myocardial Infarction. Environmental Health Perspectives, 121, 192-196
Munchak, L.A., Levy, R.C., Mattoo, S., Remer, L.A., Holben, B.N., Schafer, J.S., Hostetler, C.A., & Ferrare, R.A. (2013). MODIS 3 km aerosol product: applications over land in an
urban/suburban region. Atmos. Meas. Tech., 6, 1747-1759
Paciorek, C.J., Liu, Y., Moreno-Macias, H., & Kondragunta, S. (2008). Spatiotemporal Associations between GOES Aerosol Optical Depth Retrievals and Ground-Level PM2.5. Environmental Science & Technology, 42, 5800-5806
Radosavljevic, V., Vucetic, S., & Obradovic, Z. (2007). Aerosol optical depth retrieval by neural
networks ensemble with adaptive cost function. In, the 10th International Conference on Engineering Applications of Neural Networks (pp. 266-275)
Ristovski, K., Vucetic, S., & Obradovic, Z. (2012). Uncertainty Analysis of Neural-Network-Based Aerosol Retrieval. IEEE Transactions on Geoscience and Remote Sensing,
50, 409-414
Rodriguez, J.D., Perez, A., & Lozano, J.A. (2010). Sensitivity Analysis of k-Fold Cross Validation in Prediction Error Estimation. IEEE Transactions on Pattern Analysis and Machine Intelligence, 32, 569-575
Rohde, R.A., & Muller, R.A. (2015). Air Pollution in China: Mapping of Concentrations and
Sources. PLOS ONE, 10, e0135749
van Donkelaar, A., Martin, R.V., Brauer, M., Hsu, N.C., Kahn, R.A., Levy, R.C., Lyapustin, A.,
Combined Geophysical-Statistical Method with Information from Satellites, Models, and Monitors.
Environmental Science & Technology, 50, 3762-3772
Wang, L., Gong, W., Li, J., Ma, Y., & Hu, B. (2014). Empirical studies of cloud effects on ultraviolet radiation in Central China. International Journal of Climatology, 34, 2218-2228
Wang, L., Gong, W., Xia, X., Zhu, J., Li, J., & Zhu, Z. (2015). Long-term observations of aerosol optical properties at Wuhan, an urban site in Central China. Atmospheric Environment, 101,
94-102
Wu, J., Yao, F., Li, W., & Si, M. (2016). VIIRS-based remote sensing estimation of ground-level
PM2.5 concentrations in Beijing–Tianjin–Hebei: A spatiotemporal statistical model. Remote Sensing of Environment, 184, 316-328
Wu, Y., Guo, J., Zhang, X., Tian, X., Zhang, J., Wang, Y., Duan, J., & Li, X. (2012). Synergy of satellite and ground based observations in estimation of particulate matter in eastern China.
Science of The Total Environment, 433, 20-30
Xiao, Q., Wang, Y., Chang, H.H., Meng, X., Geng, G., Lyapustin, A., & Liu, Y. (2017). Full-coverage high-resolution daily PM2.5 estimation using MAIAC AOD in the Yangtze River Delta of China. Remote Sensing of Environment, 199, 437-446
Xie, Y., Wang, Y., Zhang, K., Dong, W., Lv, B., & Bai, Y. (2015). Daily estimation of ground-level
PM2.5 concentrations over Beijing using 3 km resolution MODIS AOD. Environmental Science & Technology, 49, 12280-12288
You, W., Zang, Z., Pan, X., Zhang, L., & Chen, D. (2015). Estimating PM2.5 in Xi'an, China using aerosol optical depth: A comparison between the MODIS and MISR retrieval models. Science of