Research Article
Determination of nutrient compositions, glyceamic index and ant-diabetic
potentials of multi- plant based functional foods in rats
Oluwole Steve Ijarotimi
1*, Tayo Nathaniel Fagbemi
2and Oluwatooyin Faramade Osundahunsi
3 1Department of Food Science and Technology, Federal University of Technology, Akure, Nigeria2Department of Food Science and Technology, Federal University of Technology, Akure, Nigeria 3Department of Food Science and Technology, Federal University of Technology, Akure, Nigeria
ARTICLE INFO ABSTRACT
Received 10/08/2015 Received in revised form 25/08/2015
Accepted 25/10/2015 Available online 01/11/2015
E-mail address:
Nutrition transition, that is, increase in consumption of high energy-dense foods, with low consumption of fruits and vegetables, has been implicated as the major factors responsible for the increase in prevalence of diet-related diseases such as diabetes and cardiovascular diseases worldwide. Evidence has shown that consumption of plant-based foods prevents the risk of these chronic diseases, hence, the present study formulated and evaluated nutrient compositions and antidiabetic potentials of multi-plant based functional foods from locally available food materials. Food materials (popcorn, moringa leaves, wonderful kola and defatted soybean) were obtained from reputable farms and markets in Akure, Nigeria. The food materials were processed as raw, blanched and fermented flour samples, and blended to obtain nine samples, i.e., R1, B1 and F1 (popcorn 60%, soybean 10%, moringa 20% and groundnut oil 10%), R2, B2 and F2 (popcorn 60%, soybean 10%, wonderful kola 20% and groundnut oil 10%) and R3, B3 and F3 (popcorn 60%, soybean 10%, moringa 10%, wonderful kola 10% and groundnut oil 10%) using Nutri-Survey software. Proximate compositions of the blended samples were determined using AOAC methods, and glyceamic index and anti-diabetic potentials were determined using rat models. Proximate compositions (g/100g) of the formulated multi-plant based functional foods were as follows: moisture contents ranged from 6.29 in F3 to 8.27 in R3, crude fiber contents from 2.79 in F2 to 4.68 in B3 and crude protein contents from 23.22 in B1 to 30.39 in F3, while carbohydrate content of the formulations ranged from 52.10 in F3 sample to 56.94 in B2 sample, while energy values were between 421.1 in R1 and 433.7 kcal in B1. Glycaemic index (GI) of the formulated functional foods ranged from 5.8% in R3 to 28.9% in R1 sample, and were significantly (<0.05) lower than in glucose (a reference sample). The glycaemic load (GL) of R4 sample had the lowest value (3.3), while F4 sample had the highest value (15.1). The percentage blood glucose reduction of diabetic-induced rats fed with R1samples (63.8%) had the highest values; while those rats fed with B2 sample (24.1%) had the lowest blood glucose reduction. Statistically, the percentage blood glucose reduction of the formulated functional foods, particularly R1 and F1, were comparable to metformin (a synthetic anti-diabetic drug) in terms of antidiabetic activities. The study reported on the nutritional profile of multi-plant based functional foods from popcorn, soybean, wonderful kola and moringa leaves. Findings showed that these functional foods contain appreciable amount of protein, fiber, carbohydrate content within the recommended value for diabetic patients, low glycaemic index and glycaemic load properties and with antidiabetic activities. Hence, the formulated functional foods may be suitable for individuals at risk of diabetes or diabetic patients.
1. Introduction
Diet and nutrition are important factors in the promotion and maintenance of good health at every stage of human life cycles. Recently, rapid socioeconomic changes, along with declines in food prices, increased access to foods and urbanization have resulted in a nutritional transition which characterized by a shift from primitive mode of nutrition to more energy-dense diets and reduction in physical activity (Vorster et al. 1999; Popkin 2004, 2006, 2009; Astrup et al. 2008). Nutrition transition is characterized by increases in consumption of high fat, energy-dense foods, processed foods high in sugar, animal-based food products, and decrease in the consumption of plant-based food products like fruits, vegetables and whole grains (WHO, 2000; Popkin, 2001; Popkin 2006, 2009; Astrup et al. 2008).
Evidence has shown that nutritional transition is negatively associated with health status, and it has been implicated as the major factors responsible for the increases in prevalence of diet-related diseases, such as obesity, diabetes and cardiovascular diseases worldwide (WHO/FAO, 2002; Popkin 2004, 2006, 2009; Astrup et al. 2008). Epidemiological study established that increase in refined sugar intakes, which is characterized with high glycaemic index, has replaced traditional plant-based foods (Brand-Miller, 2004). Refined sugar intakes have been implicated in the etiology of many chronic diseases like diabetes and cardiovascular diseases (Brand-Miller, 2004; Ludwig 2000; Jenkins et al., 2006; Ma et al., 2006). The glycaemic index (GI) (a dietary measuring system relating the rate at which carbohydrate-containing foods raises blood sugar after two (2) hours or more after consumption (post-prandial glycaemia), has clinically important benefits for preventing, managing, and treating a number of chronic diseases such as diabetes, cardiovascular disease (CVD), and some forms of cancer and obesity (Jenkins et al., 2002; Brand-Miller et al., 2003b; Anon, 2006). Carbohydrate-containing foods are graded as either having a high, intermediate (medium) or low GI depending on the rate at which blood sugar level rises (Mendosa, 2000), which in turn is related to the rate of digestion and absorption of sugars and starches available in that food (FAO/UN, 1998). This, high GI foods (GI range: >70) will break down rapidly during digestion and cause a rapid, but short-lived rise in the blood sugar level during absorption while low-GI foods (GI-range: <55) undergoes slower but gradual release of glucose into the blood stream, while intermediate (medium) glycaemic foods are those ranging between 56 and 69 on the GI scale. Foods that are classified as low GI provide a better response to postprandial glucose, causing a slight increase in circulating levels of insulin and gastrointestinal hormones; therefore, satiety is increased and voluntary food intake is reduced (Bornet et al., 2007; Jenkins et al., 2002). However, increased insulin secretion, caused by foods with high GI, leads to postprandial hyperinsulinemia along with an increase in both hunger and voluntary food intake (Aller et al., 2011). This suggests that a low-GI diet may provide some
level of prevention against developing diabetes and obesity and for managing existing cardiovascular diseases (CVD).
Dietary glycaemic index and glycaemic load appear to have increased in recent years because of increases in carbohydrate intake and changes in food processing (Ludwig, 2002). Dietary glycaemic index is an indicator of carbohydrate quality that reflects the effect on blood glucose, and the dietary glycaemic load is an indicator of both carbohydrate quality and quantity food (Wolever et al., 1994; Salmeron et al., 1997). Epidemiologic evidence suggests that a diet with a high glycaemic load or glycaemic index may increase the risk of coronary heart disease (Liu et al., 2000; Ford & Liu, 2001; Liu and Manson, 2001) and type 2 diabetes (Salmeron et al., 1997). Glycaemic index is an important tool used in treating people with diabetes and in weight loss programs. Low glycaemic index foods, by virtue of the slow digestion and absorption of their carbohydrates, produce a more gradual rise in blood sugar and insulin levels and are increasingly associated with health benefits. Low glycaemic index foods have thus been shown to improve the glucose tolerance in both healthy and diabetic subjects (Jenkins et al., 1988). Hence, the present study aimed at formulating multi-plant based functional foods with low glycaemic index and antidiabetic activities.
2 Materials and Methods
2.1 Sources of Food Materials and Wistar rats Freshly harvested Buchholzia coriacea seeds were bought from Ojee market in Ibadan, popcorn kernels were purchased from Erekensan market, Akure and moringa leaves were freshly harvested from Federal University of Technology, Akure community, Nigeria. The leaves and seeds were identified and authenticated at Herbarium Unit of Department of Crop Production and Pest, Federal University of Technology, Akure, Nigeria. The wistar rats were purchased from Central Animal House, College of Medicine, University of Ibadan, Ibadan, Nigeria. The study protocol was approved by the Ethical Committee for Laboratory Animals of School of Agriculture and Agricultural Technology, Akure, Nigeria.
2.2 Processing of Food Materials into Flour 2.2.1. Popcorn flour:
2.2.2. Wonderful kola (B. coriacea) flour
The fresh wonderful kola was cleaned by the double disinfection method. They were washed thoroughly with distilled water to remove adhering particles after which they were soaked in 80% ethanol for 30 min. The seeds were rinsed with distilled water and then washed with aqueous sodium hypochlorite (NaClO) to reduce surface contamination and rinsed again with distilled water. The wonderful kola seeds were divided into three parts, and processed as raw, blanched and fermented (for three days) using local methods. The raw, blanched and fermented seeds were oven dried at 60oC (Plus11 Sanyo Gallenkamp PLC, UK) for 8 hours, milled using Philips laboratory blender (HR2811 model) and sieved using a 60 mm mesh sieve (British Standard) to obtain raw, blanched and fermented wonderful kola seed flour. The flour was packed in a plastic container seal with an aluminum foil and stored at room temperature (~27oC) until required for use.
2.2.3. Moringa Leaves Flour
Green healthy moringa leaves were trimmed off the stem, rinsed with clean water, and drained to remove dirt. The drained moringa leaves were divided into three parts, one of the parts was treated as raw, while the second and third portions were blanched and fermented (for two days) using local methods. The raw, blanched and fermented moringa leaves were oven dried at 40oC (Plus11 Sanyo Gallenkamp PLC, UK) for 8 hours, milled using Philips laboratory blender (HR2811 model) and sieved using a 60 mm mesh sieve (British Standard) to obtain raw moringa leaves flour. The flour samples were packed in a plastic container sealed with aluminum foil and stored at room temperature (~27oC) until required for use.
2.2.4. Defatted soybean cake flour
The defatted soybean cake was milled using Philips laboratory blender (HR2811 model) and sieved using a 60 mm mesh sieve (British Standard) to obtain defatted cake flour. The flour sample was packed in a plastic container sealed with aluminum foil and stored at room temperature (~27oC) until required for use.
2.2.5 Formulations of multi-plant based functional foods
The popcorn, defatted soybean cake, moringa and wonderful cola nut flour were mixed in different proportions using NutriSurvey Linear Programming softwaretoobtain nineformulations asshown in table 1.
2.2.6. Proximate composition Determination
Proximate compositions of the multi-plant-based food sample were determined using the standard procedures of Association of Official Analytical Chemists (AOAC) (2005). Moisture content was determined in a hot-air circulating oven (Galenkamp). Ash was determined by incineration (550°C) of known weights of the samples in a muffle furnace (Hotbox oven, Gallencamp, UK, size 3) (AOAC, 2005). Crude fat was
determined by exhaustively extracting a known weight of sample in petroleum ether (boiling point, 40 to 60°C) using TecatorSoxtec (Model 2043(20430001), 69, Slandegarupgade, DK-3400, Hilleroed, Denmark) (AOAC, 2005). Protein content (N × 6.25) was determined by the micro-Kjeldahl method (Method No 978.04) (AOAC, 2005). Crude fiber was determined after digesting a known weight of fat-free sample in refluxing 1.25% sulfuric acid and 1.25% sodium hydroxide (AOAC, 2005). Carbohydrate content was determined by difference, that is, addition of all the percentages of moisture, fat, crude protein, ash and crude fibre and subtracted from 100%.This gave the amount of nitrogen free extract otherwise known as carbohydrate.
% carbohydrate = 100-(%Moisture + %Fat + %Ash + % Crude fibre + %Crude protein)
The energy value of the samples were estimated [in kcal/g] by multiplying the percentages of crude protein, crude lipid and carbohydrate with the recommended factors 4.0, 9.0 and 4.0 respectively as proposed by (Iombor et al., 2009).
2.2.7 Determination of glycemic index and anti-diabetic activities of formulated food samples in Wistar Albino rats
Experimental animals: Seven-seven male Wistar Albino rats of body weights between 140-150g were purchased from Central Animal House, college of Medicine, University of Ibadan, Ibadan, Nigeria. The rats were divided into eleven groups (7 rats per group), and were housed individually in metabolic cages in a climate-controlled environment with free access to feed and water. The rats were allowed to acclimatize to the new environment for 4 days. After four days of adaptation period, the animals were reweighed and fasted for 12 hours (overnight fasting). The blood glucose of the animals were taken at zero time from the tail vein before fed with 2.0g of the formulated food samples and glucose (control), which were consumed within 25 min. After the consumption, the serum glucose levels of the animals were measured using an automatic glucose
analyzer ( Accu-chek Active Diabetes monitoring kit;
Roche Diagnostic, Indianapolis, USA) at 0, 30, 60, 90 and 120 min. The glycemic response was determined as the Incremental Area under the Blood Glucose Curve (IAUC) measured geometrically from the blood glucose concentration-time graph ignoring area beneath the fasting level (Wolever, 1993).
at time 120 min to reflect the total rise in blood glucose concentration after eating the reference food (glucose). The Incremental Area Under the Curve (IAUC) from the animals fed with the formulated food samples were similarly obtained. The glycemic Index (GI) for each diet was calculated by ratio of Incremental Area Under two
2.2.8.1 Calculation of Glycemic Load (GL)
Glycemic Load (GL) for each food sample was determined by the method of Salmeron et al. (1997). In each individual glycemic load was calculated by taking
the percentage of the food s carbohydrate content in a
typical serving food and multiplying it by its glycemic index value. The following formula was used:
Net Carbs = Total Carbohydrates in the food sample served.
2.2.8.2 Induction of Diabetes mellitus
The baseline blood glucose levels of the animals were measured before induced with aloxan drug. Diabetes mellitus was induced by single intraperitoneal injection of freshly prepared solution of alloxan monohydrate (150 mg/kg. body weight) dissolved in physiological saline in overnight fasted WistarAlbino rats (Al-Shamaony et al., 1994). The rats were allowed to drink 5% glucose solution to avoid hypoglycaemic effects of the drug. The blood glucose levels in the animals were measured 72hours after the drug administration (alloxan treatment) through tail tipping using glucometer (Accu-Chek, Active, Roche Diagnostic s 9115 Hague road, Indianapolis, 46256 Lot No 115764) and those found to be diabetic ( serum glucose ≥ 250mg/dl) were selected for the study (Ruxue et al., 2004). The diabetic induced rats were divided into eleven groups containing 7 rats per group, and nine of the groups were fed with formulated food samples (i.e., R1-3 B1-3 and F1-3). Table 1: Percentage of raw (R1-3), blanched (B1-3) and fermented (F1-3) popcorn, soybean, Moringa oleifera leaves and Buccholzia coriacea seeds flour samples in the formulated food samples
Samples Popcorn FPC Soybean cake Groundnut oil Moringa oleifera leaf Buccholzia coriacea seeds
R1 60 10 10 20 0
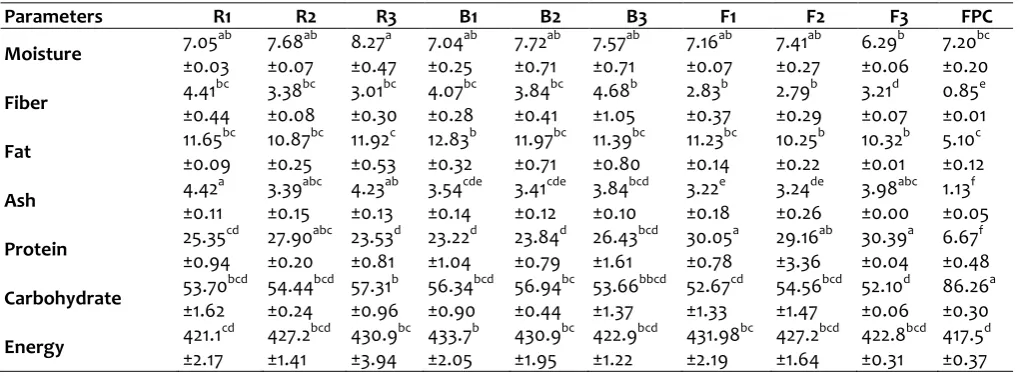
Table 2: Proximate compositions of multi-plant based functional foods from popcorn, soybean, Moringa oleifera leaves and Buccholzia coriacea seeds flour
The remaining two groups were treated with saline solution and metformin hydrochloride (antidiabetic drug) (Scheen, 1996) respectively, and were fed with commercial animal feeds. The animals were fed with the diets for 14 days and blood glucose levels were measured in the morning at two days interval by drawing blood from each rat through tail tipping and the blood glucose level was measured using Accu check® glucometer kit (Meiton, 2006).
3 Statistical Analysis
The data were analysed using SPSS version 16.0. The mean and standard error of means (SEM) of the triplicate analyses were calculated. The analysis of variance (ANOVA) was performed to determine significant differences between the means, while the means were separated using the Duncan multiple range test at p<0.05.
4 Results and Discussion
4.1 Proximate compositions of formulated multi-plant based functional foods
The proximate compositions of multi-plant based functional foods from popcorn, soybean, Moringa oleifera leaves and Buccholzia coriacea seeds flour are presented in Table 2. The moisture contents of the formulated diets ranged from 6.29 g/100g in F3 to 8.27 g/100g in R3. The lower moisture content values observed in this study imply that the formulated food samples could be stored for a reasonable long period. Moisture content of food samples is the main determinant of food spoilage. It is well established that low moisture content of food samples reduce the activities of microorganisms, and thereby increase the shelf life of the food products. In contrary, high moisture contents in food products facilitate the activities of microorganisms, and thereby reduce the nutritional quality and shelf life of the food products (Alozie et al., 2009). The values of moisture contents that were observed in this present study agreed with the findings of Olitino et al. (2007) and Adeoti et al. (2013). Crude fiber contents of the formulated diets ranged from 2.79 g/100g in F2 to 4.68 g/100g in B3 sample. The fiber contents of fermented food samples (F1-F3) were lower when compared with raw and blanched formulated food samples. This observation could be attributed to the effects of fermentation on the food materials. However, this observation was contrary to the report of Jood et al. (2012), who reported an increased in the insoluble and total dietary fiber content of fermented sorghum based food products. Generally, the fiber contents in the formulated diets of the present study were high, and comparable to the report of Okoye and Maze (2011). Nutritional study has established that adequate fiber intake render some health benefits like preventing coronary heart diseases, constipation and diabetes (Ishid et al., 2000). Therefore, these formulations could serve as good sources of fiber to the consumers. Fermented food samples (F1-3) had the highest protein
content (29.16 -30.39 g/100g) when compared with the raw (23.53 -27.90 g/100g) and blanched (23.22 -26.43 g/100g) food samples. This finding agreed with the reports of other researchers (Azokpota et al., 2006; Ochanda et al., 2010). Quite a number of scientific studies have reported that fermentation increased the protein contents of food products (Adams, 1990; Nout and Ngoddy, 1997; Zlatica and Jolana, 2007), due to the activities of microorganisms that utilize other nutrients like carbohydrate and fats in the food samples to synthesized protein for their growth and development (Adams, 1990; Nout and Ngoddy, 1997; Zlatica and Jolana, 2007; Azokpota et al., 2006). The value of crude protein observed in this study was comparable to the values of blends of maize-tilapia fish flour (16%)(Fasasi et al., 2005), maize-bambara groundnut flour (10%) (Wang and Daun, 2000) and maize-soyabean flour (18%) (Sefa-Dedeh et al., 2002). The carbohydrate content of the formulations ranged from 52.10 g/100g in F3 sample to 56.94 g/100g in B2 sample, while energy values were between 421.1 kcal in R1 and 433.7 kcal in B1. The carbohydrate content of the formulations were low, and were within the daily recommended range values (50-60%) for diabetic patients (FAO, 1997; Krauss et al., 2000; Franz et al., 2002; Liu et al., 2000).
4.2. Glycaemic index (GI) and Glycaemic load (GL) of the formulated multi-plant based functional foods
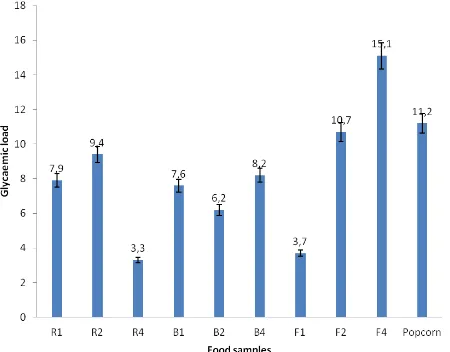
The glycaemic index defined as the incremental blood glucose area under the curve following a test food, expressed as the percentage of the corresponding area following a carbohydrate equivalent load of a reference food (Bjorck et al., 2000). Its determination is an attempt to characterize foods according to their postprandial glycaemic response rather than their chemical composition (Jenkins et al., 1981). In this study, the glycaemic index of the formulated functional foods ranged from 5.8% in R3 to 28.9% in R1 sample (Fig. 2). There was no significant difference (>0.05) between the values of GI of the formulations, but the values were significantly (<0.05) lower when compared with the reference value (Glucose). The glycaemic load (GL) of the formulated food samples showed that sample R4 had the lowest GL value (3.3), while F4 sample had the highest GL value (15.1) (Fig. 3). Nutritionally, the GI and GL of the formulations were lower when compared with the recommended values of <55% and <10 respectively. The low GI and GL observed in this study could be due to the incorporation of moringa leaves flour or wonderful kola into the formulated functional foods. For instance, it is well established that vegetable-based foods have low glycaemic index compare to non-vegetable based food products (Du et al., 2008).
Fig. 1: Blood glucose of Wistar rats fed with formulated multi-plant based functional foods from popcorn, soybean, Moringa oleifera leaves and Buccholzia coriacea seeds flour
Fig. 2: Glycaemic index of formulated functional foods from popcorn, soybean, Moringa oleifera leaves and Buccholzia coriacea seeds flour. GI classification: Low-GI = < 55%; Medium-GI = 56-69%; High-GI = >70%
Fig. 3: Glycaemic load of formulated functional foods from popcorn, soybean, Moringa oleifera leaves and Buccholzia coriacea seeds flour
Note: GL classification Low-GL = < 10; Medium-GL = 11-19; High-GL = >20
Fig. 4: Anti-diabetic potentials of formulated multi-plant based functional foods compared with Metformin (control)
Fig. 5: Percentage of blood glucose reduction (%) by the formulated multi-plant based functional foods compared with Metformin (control)
4.3. Anti-diabetics potentials of the formulated multi-plant based functional foods
Blood glucose concentrations (mg/dL) of diabetic induced rats fed with multi-plant based functional food samples are presented in Fig. 4 and 5. Percentage reduction of blood glucose of diabetic-induced rats fed with R1samples (63.8%) had the highest blood glucose reduction; while those rats fed with B2 sample (24.1%) had the lowest blood glucose reduction. The finding also showed that among the raw, blanched and fermented formulations, samples R1, B1 and F1, which were supplemented with moringa leaves flour alone, had the highest anti-diabetic potentials when compared with other formulations from their groups. In comparing with the metformin (a synthetic anti-diabetic drug), the activities of these formulated functional foods were lower. This observation could be due to inhibitory effects of other food components on the antidiabetic active components of moringa leaves and wonderful kola in the formulations. Evidences have shown that Moringa oleifera leaves, a component of the formulated diet, contains quercetin and kaemferol (Fuglie, 1999), and that these chemicals are derivatives of many medicinal plants with hypoglycemic functions (Desoky and Youssef, 1997; Kar et al., 2003; Ndong et al., 2007b; Dieye et al., 2008) and B. coriacea seeds also possess antidiabetic potentials (Ezeigbo, 2011); and that being plants their medicinal activities may be low when compared with the pharmaceutical drugs, however, their regular intakes as food or herbal drug may have a noticeable long-term physiological effect (Espın et al., 2007).
Scientific data has shown that prevalence of diabetes mellitus occurs and increasing throughout the world, particularly in many parts of developing countries (Shaw et al., 2010). In the time past, diet related diseases
like diabetes mellitus, are disease of affluence in
developed countries, but now there are increased of these diseases in many parts of developing countries (WHO/FAO 2003). This is showing a worrying trend as it is affecting a large proportion of the population and is appearing earlier in life (WHO/FAO 2003). Diabetes is a global epidemic that poses a great public health challenge, hence, the need for widely applicable strategies to reduce the incidence of diabetes is required by focusing on diet modification such as consumption of plant-based foods and increase in physical activity (Pan et al., 1997; Tuomilehto et al., 2001; Shaw and Chisholm, 2003).
5. Conclusion
The study reported on the nutritional profile of multi-plant based functional from popcorn, soybean, wonderful kola and moringa leaves. The findings showed that the functional foods contain appreciable amount of protein, fiber, carbohydrate content within the recommended value for diabetic patients, low glycaemic index and glycaemic load properties with antidiabetic potentials. Hence, the formulated
functional foods may be suitable for individuals at risk of diabetes or diabetic patients.
6. References
1. Adams, M. R.: Topical aspects of fermented foods. Trends in Food Science and Technology, 8, 1990, pp. 140-144.
2. Adeoti, O.A., Elutilo, O.O., Babalola, J.O., Jimoh, K.O, Azeez, L.A & Rafiu, K.A. 2013. Proximate, Mineral, Amino Acid and Fatty Acid Compositions of Maize Tuwo-Cirina Forda Flour Blends. Greener Journal of Biological Sciences, Vol. 3 (4), pp. 165-171.
3. Alozie Y. E., Iyam M. A., Lawal O., Udofia U. and Ani I. F. 2009. Utilization of Bambara ground flour blends in bread production. In Journal of Food Technology, 7(4):111-114.
4. Al-Shamaony, L., Al-Khazraji, S.M. and Twaiji, H.A. (1994).Hypoglycemic effect of Artemisia herba Alba II.Effect of a valuable extract on some blood parameters in diabetic animals.J Ethnopharmacol.43: 167-171.
5. Anon, 2006. Glycemic Index.
http://www.answers.com/glycemic+index&r=6.ht ml5/31/2006.
6. Astrup, A., Dyerberg, J., Selleck, M. & Stender, S. 2008. Nutrition transition and its relationship to the development of obesity and related chronic diseases. Obes. Rev. 9(Suppl. 1): 48–52.
7. Azokpota P, Hounhouigan D.J.& Nago M.C. 2006. Microbiological and chemical changes during the fermentation of African locust bean (Parkia biglobosa) to produce afitin, iru and sonru, three traditional condiments produced in Benin. International Journal of Food Microbiology 107:304 – 309
8. Bjorck, I.M.E., Liljeberg H.G.M. & Ostman E.M. 2000. Low glycemic-index foods. Br. J. Nutr., 83: 149-155.
9. Bornet F.R., Jardy-Gennetier A.E. & Jacquet N. 2007. Glycaemic response to foods: impact on satiety and long-term weight regulation. Appetite; 49: 535-53.
10. Brand-Miller J.C. 2004. Postprandial glycemia, glycemic index, and the prevention of type 2 diabetes. Am J ClinNutr.,80:243– 4.
12. Brand-Miller, J., Wolever T.M.S., Foster-Powell K. & Colagiuri S. 2003b. The New Glucose Revolution: The Authoritative Guide to the Glycemic Index. Marlowe and Company, New York.
13. Desoky K. & Youssef SA. 1997. Hypoglycemic effect of Sterculia rupestris and a comparable study of its flavonoids with Sterculia diverstifolia. Bull Fac Pharm Cairo Univ. 35:257–261.
14. Dieye A.M, Sarr A, Diop S.N., Ndiaye M., Sy G.Y., Diarra M., Rajraji Gaffary I., Ndiaye Sy A. & Faye B. 2008. Medicinal plants and the treatment of diabetes in Senegal: survey with patients. Fundamental & Clinical Pharmacology 22, 211–216.
15. Du, H.; D. L van der A, M. M. E van Bakel; C. J. H van der Kallen; E. E Blaak; M. M. J van Greevenbroek, E. H. J. M Jansen; G. Nijpels; C. D. A. Stehouwer; J. M. Dekker and E. J. M Feskens. (2008). Glycemic index and glycemic load in relation to food and nutrient intake and metabolic risk factors in a Dutch population. Am. J. of Clin. Nutr. 87: 655-661.
16. Espin, J.C., Garcia-Conesa, M.T. & Tomas-Barberan, F.A. 2007. Nutraceuticals: facts and fiction. Phytochemistry. 68(22-24): pp.(2986-3008), 0031-9422.
17. Ezeigbo I.I. 2011. The Antidiabetic Potentials of the Methanolic Seed Extract of Buchhlozia Coriacea. Ann Med Health Sci Res July-Dec., 1(2) 159- 164
18. FAO/UN, 1998. Carbohydrates in Human Nutrition Paper no 66. FAO, Rome.
19. FAO/WHO (1997). Food and Agriculture Organization. Carbohydrate in human nutrition. FAO Food and Nutrition Paper – 66. Report of a joint FAO/WHO Expert Consultation, Rome 14-18 April, 1997.
20. Fasasi, O.S., Adeyemi, I.A. & Fagbenro, O.A. (2005) Proximate composition and multi-enzyme in vitro protein digestibility of maize-tilapia flour blends. Journal of Food Technology 3(3): 342-345.
21. FAO (Food and Agriculture Organization of the United Nations) (1998) Carbohydrates in Human Nutrition. FAO Food and Nutrition Paper no. 66. Rome: FAO.
22. Ford, E.S. & Liu S. 2001. Glycemic index and serum high-density lipoprotein cholesterol concentration among US adults. Arch. Intern. Med., 161: 572-576.
23. Franz M.J., Bantle J.P., Beebe C.A., Brunzell J.D., Chiasson J.L., Garg A, Holzmeister L.A., Hoogwerf B., Mayer-Davis E., Mooradian A.D., Purnell J.Q., Wheeler M. 2002. Evidence-based nutrition principles and recommendations for the treatment and prevention of diabetes and related complications. Diabetes Care. 25:148–198.
24. Gibaldi, M. & D. Perrier, 1982. Pharmacokinetics. 2nd Rev. Ed. Marcel Dekker, New York.
25. Iombor T.T., Umoh E.J. & Olakumi E. 2009. Proximate Composition and Organoleptic Properties of Complementary Food Formulated from Millet (Pennisetumpsychostachynum), Soybeans (Glycine max) and Crayfish (Euastacusspp). Pakistan Journal of Nutrition 8 (10): 1676-1679.
26. Ishida H., Suzunoh S., Sugiyana N., Innami S., Todoro T. & Mackawa A. 2000. Nutritional evaluation of chemical components of leaves, stalks and stem of sweet potatoes (Ipomea botatus). Food chem. 68:359 – 367
27. Jenkins D.J., Kendall C.W., Augustin L.S., Franceschi S., Hamidi M., Marchie A., Jenkins A.L., Axelsen M. 2002. Glycemic index: overview of implications in health and disease. Am J Clin Nutr; 76: 266S-73S.
28. Jenkins D.J, Kendall C.W., Faulkner D.A., Nguyen T., Kemp T., Marchie A., Wong J.M., de Souza R., Emam A., Vidgen E., Trautwein E.A., Lapsley K.G., Holmes C., Josse R.G., Leiter L.A., Connelly P.W., Singer W. 2006. Assessment of the longer-term effects of a dietary portfolio of cholesterol-lowering foods in hypercholesterolemia. Am J Clin Nutr.,83: 582-591.
29. Jenkins D.J.A., Wolever T.M.S., Taylor R.H., Burker H.M., Fielden H., Baldwin J.M., Bowling A.C., Newman H.C., Jenkins A.L. & Goff D.V., 1981. Glycemic index of foods: a physiological basis for carbohydrate exchange. Am. J. Clin. Nutr., 34: 362-366.
30. Jenkins, D. J. A.; T. M. S. Wolever and G. C. Buckley (1988). Low glycemic index starchy foods in the diabetic diet. Am. J. Clin. Nutr., 48: 48-54. 31. Jood S., Khetarpaul N. & Goyal R. 2012. Effect of
Germination and Probiotic Fermentation on pH,
Titratable Acidity, Dietary Fibre, β-Glucan and
Vitamin Content of Sorghum Based Food Mixtures. J Nutr Food Sci 2:164, 1-4, doi:10.4172/2155-9600.1000164
activity of some Indian medicinal plants in alloxan diabetic rats. J. Ethnopharmacol., 84, 105-8. 33. Krauss R.M, Eckel R.H., Howard B., Appel L.J.,
Daniels S.R., Deckelbaum R.J., Erdman J.W.J., Kris-Etherton P., Goldberg I.J., Kotchen T.A., Lichtenstein A.H., Mitch W.E., Mullis R., Robinson K., Wylie-Rosett J., St Jeor S., Suttie J., Tribble D.L., Bazzarre T.L. AHA Dietary Guidelines: revision 2000: A statement for healthcare professionals from the Nutrition Committee of the American Heart Association. Circulation.102:2284–2299.
34. Liljeberg HGM, A kerberg AKE & Bjorck IME. 1999.
Effect of the glycemic index and content of indigestible carbohydrates of cereal-based breakfast meals on glucose tolerance at lunch in healthy subjects. Am J Clin Nutr. 69: 64755.
35. Liljeberg, H & Bjorck I. (1998). Delayed gastric emptying rate may explain improved glycaemia in healthy subjects to a starchy meal with added vinegar. European J. Clin. Nutr. 52: 368-371. 36. Liu S, Willett WC, Stampfer MJ, Hu FB, Franz M,
Sampson L, Hennekens CH, Manson JE. 2000. A prospective study of dietary glycemic load, carbohydrate intake, and risk of coronary heart disease in US women. Am J Clin Nutr.,71:1455– 1461.
37. Liu, S. & Manson J.E. 2001. Dietary carbohydrates, physical activity, obesity and the metabolic syndrome as predictors of coronary heart disease. Curr. Opin. Lipidol., 12: 395-404.
38. Ludwig D. 2002. The glycemic index. Physiological mechanisms relating to obesity, diabetes, and cardiovascular disease. JAMA 287: 2414-2423.
39. Ludwig D.S. 2000. Dietary glycemic index and obesity. J Nutr 130:280S–283S.
40. Ma Y, Li Y, Chiriboga DE, Olendzki BC, Hebert JR, Li W, Leung K, Hafner AR, Ockene IS. 2006. Association between carbohydrate Intake and serum lipids. Journal of the American College of Nutrition, 25 (2): 155-163.
41. Meiton DA (2006). Reversal of type -1 diabetes in mice. The New England Journal of Medicine 355: 89-90.
42. Mendosa, D., 2000. The Glycemic Index. http.//www.mendosa.com/gi.htm, 5/31/2006s.
43. Ndong M, Uehara M, Katsumata S, et al. 2007b. Preventive effects of Moringa oleifera (Lam) on hyperlipidemia and hepatocyte ultrastructural changes in iron deficient rats. Biosci Biotechnol. Biochem 71: 1826–1833.
44. Nout, M. J. R. - Ngoddy, P. O.: Technological aspects of preparing affordable fermented complementary foods. Food Control, 8, 1997, pp. 279-287
45. Obesity: Preventing and Managing the Global Epidemic. Report of a WHO Consultation. WHO Technical Report Series No. 894. Geneva, Switzerland: WHO, 2000.
46. Ochanda S. O., Onyango C. A., Mwasaru A. M., Ochieng J. K. and Mathooko F. M. 2010. Effects of malting and fermentation treatments on group B-vitamins of red sorghum, white sorghum and pearl millets in Kenya. Journal of Applied Biosciences 34: 2128 – 2134.
47. Okoye, J.I. and 2Mazi, E.A. Development and Quality evaluation of Soy-fortified Custard. ABSU Journal of Environment, Science and Technology Volume, 1; 99-104, 2011
48. Olitino HM, Onimawo IA and Egbekun MK (2007). Effect of germination on the chemical compositions, biochemical constituents and antinutritional factors of soybean (Glycine max) seeds. J. Sci. of Food Agriculture. 73: 1-9.
49. Pan XR, Li GW, Hu YH, Wang JX, Yang WY, An ZX, Hu ZX, Lin J, Xiao JZ, Cao HB, Liu PA, Jiang XG, Jiang YY, Wang JP, Zheng H, Zhang H, Bennett PH, Howard BV. (1997) Effects of diet and exercise in preventing NIDDM in people with impaired glucose tolerance. The Da Qing IGT and Diabetes Study. Diabetes Care, 20, 537–544.
50. Popkin BM. The nutrition transition and obesity in the developing world. Journal of Nutrition 2001; 131(3): 871S–3S.
51. Popkin, B.M. 2004. The nutrition transition: an
overview of world patterns of change. Nutr. Rev.
62(7 Pt 2): S140–S143.
doi:10.1111/j.1753-4887.2004.tb00084.x. PMID:15387480.
52. Popkin, B.M. 2006. Global nutrition dynamics: the
world is shifting rapidly toward a diet linked with non-communicable diseases. Am. J. Clin. Nutr.84 (2): 289–298. PMID:16895874.
53. Popkin, B.M. 2009. Global changes in diet and
activity patterns as drivers of the nutrition
transition. Nestle Nutr. Workshop Ser.
Pediatr.Program.63: 1–10; discussion 10–14, 259– 268. PMID: 16895874.
54. Poskitt, E.M. 2009. Countries in transition:
underweight to obesity non-stop? Ann. Trop.
Paediatr. 29(1): 1–11.
55. Salmeron, J., E.B. Rimm, G.A. Colditz, D. Spiegelman, D.J. Jenkins, M.J. Stampfer, A.L. Wing and W.C. Willett, 1997. Dietary fiber, glycemic load and risk of NIDDM in men. Diabetes Care, 20: 545-550.
56. Salmeron, J., J.E. Manson, M.J. Stampfer, G.A. Colditz, A.L. Wing and W.C. Willett, 1997. Dietary fiber, glycemic load and risk of non-insulin-dependent diabetes mellitus in women. JAMA., 277: 472-477.
57. Scheen, A.J., Clinical pharmacokinetics of metformin. ClinPharmacokinet, 30:359–371, 1996. 58. Sefa-Dedeh, S., Y. Kluvitse and E.O. Afoakwa,
2001. Influence of fermentation and cowpea steaming on some quality characteristics of maize-cowpea blends. Afr. J. Sci., Technol., 2(2): 71-80.
59. Shaw Jonathan E and Chisholm Donald J. Epidemiology and prevention of type 2 diabetes and the metabolic syndrome Med J Aust 2003; 179 (7): 379-383.
60. Simin Liu, Walter C Willett, Meir J Stampfer, Frank B Hu, Mary Franz, Laura Sampson, Charles H Hennekens & JoAnn E Manson. 2000. A prospective study of dietary glycemic load, carbohydrate intake, and risk of coronary heart disease in US women. Am J ClinNutr., 71:1455– 61.
61. Tuomilehto J, Lindström J, Eriksson JG, Valle TT, Hämäläinen H, Ilanne-Parikka P, Keinänen-Kiukaanniemi S, Laakso M, Louheranta A, Rastas M, Salminen V, Uusitupa M; Finnish Diabetes Prevention Study Group. 2001. Prevention of type 2 diabetes mellitus by changes in lifestyle among subjects with impaired glucose tolerance. The New England Journal of Medicine, 344: 1343-1350.
62. Vorster, H.H., Bourne, L.T., Venter, C.S., and
Oosthuizen, W. 1999. Contribution of nutrition to the health transition in developing countries: a framework for research and intervention. Nutr. Rev. 57(11): 341–349. PMID:10628185.
63. Wang J & Daun K.J. 2000. Effect of variety and crude protein content on nutrients and antinutrients in lentils (Lens culinaris). J. Food Chem. 95: 493-502.
64. WHO/FAO. 2003. Diet, Nutrition and the prevention of Chronic Disease. A report of a joint WHO/FAO expert consultation, Geneva, 28January – 1 February 2002. WHO Technical Report Series 916 WHO, Geneva.
65. Wolever TMS, Katzman-Relle L, Jenkins AL, Vuksan V, Josse RG & Jenkins DJA (1994) Glycaemic index of 102 complex carbohydrate foods in patients with diabetes. Nutr Res 14,651– 669.
66. Wolever, T. M. S. & D. J. A. Jenkins (1986). The use of the glycemic index in predicting the blood glucose response to mixed meals. Am. J. Clin. Nutr., 43:167-172.
67. Wolever, T. M. S.; Jenkins D. J. A.; Jenkins A. L. & Josse R. G. 1991. The glycemic index: methodology and clinical implications. Am. J. Clin. Nutr., 54:846-854.
68. Wolever, T.M.S., 1993. Glycemic Tolerance and the Glycaemic Index, In: Macrea, R., Robinson, R.K. and Sadler, M.J. (Eds), Encyclopeadia of Food Science, Food Technology and Nutrition. Academic Press, London, pp: 2214-2220.
69. Zhang R, Zhou J, Jia Z, Zhang Y, Gu G. 2004. Hypoglycemic effect of Rehmanniaglutinosa oligosaccharide in hyperglycemic and alloxan-induced diabetic rats and its mechanism. J Ethnopharmacol.,90:39–43.