Maku tanpakushitsu no morateki kaiseki no tame no bunsekiho no kaihatsu
Bebas
61
0
0
Teks penuh
(2) I SBN. 978-4-87762-239-8. SFC-MT 2009-006. 膜タンパ ク質 の網 羅 的 解 析 のための. 分析法の開発 Development. of analytical. profiling of membrane. 2009年. methods. for large-scale. proteins. 度. 岩 崎 未 央 政策・メディア研究科修土課程 先端 生命 科 学 プ ロジェクト. 慶應義塾 大学 湘南藤 沢学 会 優.
(3) 優秀修士論文推薦のことば. 本 論 文 は 、 タ ンパ ク 質 を短 期 間 で 効 率 的 か つ 網 羅 的 に分 析 す る 手 法 を 世 界 に 先 駆 け て 開 発 した 。 市 販 され て い る ほ と ん ど の 薬 剤 が タ ンパ ク 質 を 標 的 と して い る こ と か ら、 創 薬 研 究 や そ の 他 の 生 物 学 研 究 に と っ て 、 細 胞 内 で の タ ンパ ク 質 の 変 動 を 網 羅 的 か つ 定 量 的 に見 る こ とは 極 め て 重 要 で あ る。 しか し、 タ ン パ ク 質 の 化 学 的 特 性 や 、 そ の 膨 大 な 種 類 に 起 因 す る 実 験 的 な 制 限 に よ り 、 ど ん な 生 物 由 来 の タ ンパ ク 質 も短 期 間 で 網 羅 的 に 分 析 す る こ と が 、 これ ま で 極 め て 困 難 で あ っ た 。 本 論 文 の技 術 は網 羅 的 タ ンパ ク質解 析技 術 の 可能 性 を飛躍 的 に高め 、今 後 は医 療へ の応 用 が期 待 され る。 以 上 の点 か ら、 本 論 文 を優 秀 修 士 論 文 と して 強 く推 薦 す る 。. 慶應義塾大学 環境情報学部教授 冨田. 勝.
(4) 修 士 論 文2009年. 度(平. 成21年. 度). 膜 タ ンパ ク 質 の 網 羅 的 解 析 の た め の 分 析 法 の 開 発 Development large-scale. of profiling. analytical of. membrane. methods. for. proteins. 慶 應 義 塾 大 学 大 学 院 政 策 ・メデ ィア研 究 科 岩崎. 未央.
(5) 修 士 論 文2009年. 度(平. 成21年. 度). 膜 タ ンパ ク質 の網 羅 的解 析 の た め の分析 法 の 開発 論文要 旨 タ ンパ ク質 は生 体 内 にお い て非 常 に重 要 な役 割 を 担 って い る.タ ンパ ク質 を 網 羅 的 に解 析 す る こ とは,生 命 現 象 を理 解 す る の に 重 要 で あ る-液 体 ク ロ マ トグ ラ フ ィー 質 量 分 析 計 (LC-MS)を 用 い た シ ョ ッ トガ ン プ ロテ オ ミク ス は,タ ンパ ク質 を網 羅 的 に解 析 す る の に 有 効 な 手 法 で あ る.シ. ョ ッ トガ ン プ ロテ オ ミク ス で は,タ ンパ ク質 を 質 量 分 析 計 で測 定 可 能 な. 断 片 に す る た め に,消 化 酵 素 を用 い て 断 片 化 す る 必 要 が あ る.し か し,タ ンパ ク質 は 様 々 な化 学 的 性 質 を有 して お り,ま た,タ ンパ ク質 ご とに 発 現 量 が 大 き く異 な る.そ の よ うな 性 質 に 起 因 す る 実 験 的 な 制 限 に よ り,試 料 中 に存 在 して い る タ ンパ ク質 を短 期 間 で 網 羅 的 に 同 定す る こ とは 困 難 で あ った. 本 論 文 で は,シ. ョ ッ トガ ン プ ロテ オ ミク ス にお け る問 題 点 を解 決 し,短 期 間 で網 羅 的 に タ. ンパ ク質 を同 定 で き る分 析 手法 を確 立 す る た め に,大 腸 菌 を試 料 と して,試 料 の 分 析 前 処 理 法,お. よび 液 体 ク ロマ トグ ラ フ ィー 分 離 法 に お け る新 規 手 法 の 開 発 を行 っ た.第1章. は,プ ロテ オー ム研 究 の 意 義 お よび 本研 究 の 目的 を 述 べ た.第2章. で. で は,前 処 理 法 に着 目. し,化 学 的 消 化 法 を 開 発 す る こ とで タ ンパ ク質 の化 学 的 性 質 に偏 りの な い 同 定 手法 を確 立 し,膜 タ ンパ ク質 の 同 定 効 率 を改 善 した.第3章. で は,液 体 ク ロマ トグ ラ フ ィー に お け る. 分 離 法 に着 目 し,モ ノ リス型 シ リカ カ ラム を 用 い たLC分. 析 条 件 の 検 討 を行 うこ とで,1分. 析 あ た りの 同 定 効 率 を 大 幅 に改 善 し,大 腸 菌 で 発 現 して い る全 て の タ ンパ ク質 を,短 期 間 で 分 析 す る こ とが 可能 とな っ た. キ ー ワー ド 大 腸 菌,シ ョッ トガ ンプ ロテ オ ミクス,化 学 的 消化 法,モ ノ リス型 シ リカ カ ラ ム 慶 應 義 塾 大 学 大 学 院 政 策 ・メ デ ィ ア 研 究 科. 岩崎. 未央.
(6) Abstract of Master's Thesis Academic Year 2009 Development large-scale. of analytical. profiling. methods. of membrane. for. proteins. ABSTRACT Proteins. have crucial roles in all kinds of organisms.. comprehensively. for the understanding. analyze. proteome. shotgun. proteomics,. using nano-liquid proteins. of the life. Shotgun proteomics chromatography-mass. are digested. proteins have various chemical properties mainly because of the experimental. It is very important. to produce. is a powerful method. spectrometry. measurable. and wide differences. to analyze proteins to. (nanoLC-MS/MS).. peptides. In. by MS. However,. in the concentration. range. Thus,. limitations, it is difficult to analyze entire proteome. in one. organism in a short time LC-MS/MS analyses. In this paper, the novel methods identification. were developed. to solve these. problems. and improve. efficiency on E. coli samples. In the chapter 1, the significance of proteome. and the purpose of this study were described.. In the chapter 2, the pre-fractionation. the. analysis. method was. focused to develop the chemical digestion method. The unbiased method for the proteome analysis was achieved,. and the identification. efficiency of the membrane. proteome. was successfully. improved. In the chapter 3, the LC method was focused and optimized using the long monolith silica column. The identification. efficiency of a single analysis was remarkably. identification of E. coli proteome. improved, and complete. was achieved.. Keywords Escherichia coli, shotgun proteomics, chemical digestion method, monolith silica column Keio University. Graduate. School. of Media. and Governance Mio. Iwasaki.
(7) Contents CHAPTER 1. Introduction. 1. 1.1. THE ROLE OF PROTEOME IN LIVING CELLS. 1. 1.2. THE IMPORTANCE OF COMPREHENSIVE ANALYSIS OF PROTEINS. 2. 1.3. OBJECTIVES & SUMMARY. 4. CHAPTER 2. Chemical. Cleavage-Assisted. Tryptic Digestion. for Membrane. Proteome. 5. Analysis. 2.1. INTRODUCTION. 5. 2.2. MATERIALS AND METHODS. 8. 8. 2.2.1.. Materials.. 2.2.2.. Preparation. of membrane-enriched. 2.2.3. Optimization. of cyanocysteine. 2.2.4.. In-solution. 2.2.5.. Peptide. 2.2.6.. NanoLC-MS. 2.2.7.. Data analysis. fractions cleavage. Cys cleavage-trypsin. fractionation. coli BW25113. 8. cells.. 8. reaction.. digestion. of digested. of Escherichia. of membrane-enriched. 9. fraction.. 10. samples.. 10. system.. 11. and bioinformatics.. 13. 2.3. RESULTS AND DISCUSSION 2.3.1. In sillco prediction 2.3.2. Optimization 2.3.3.. of effects. of Cys cleavage. Reproducibility. of digestion. at Cys on membrane. 13. proteome.. 15. protocol.. and false positive. identification. rate in the Cys cleavage-trypsin. protocol 18. 2.3.4. Application of the Cys cleavage-trypsin two-dimensional. protocol. LC-MS/MS.20. 2.4. CONCLUSIONS26 i. to E. coli membrane. proteome. using.
(8) CHAPTER 3. Toward. the complete. membrane. proteome. analysis. 27. 3.1. INTRODUCTION. 27. 3.2. MATERIALS AND METHODS. 30. 3.2.1.. Materials.. 3.2.2.. Preparation. 3.2.3.. In-solution. 3.2.4.. Peptide. 3.2.5.. NanoLC-MS. 3.2.6.. Data analysis. 30. of whole trypsin. cell lysate of Escherichia. digestion. fractionation. for the whole. of digested. coli BW25113. cells.. 30. cell lysates.. 30. samples.. 31. system.. 31. and bioinformatics.. 33. 3.3. RESULTS AND DISCUSSION 3.3.1.. The effects. of the gradient. 3.3.2. The performance 3.3.3. The impact 3.3.4.. time on the identification. of a single analysis. on the dynamic. E. coli membrane. 34. proteome. range. and analyses. efficiency. of pre-fractionated. problems.. analysis. with monolith. 34. samples.. 38. 42. silica column.. 45. 3.4. CONCLUSIONS. 46. REFERENCES. 47. ACKNOWLEDGEMENTS. 51. il.
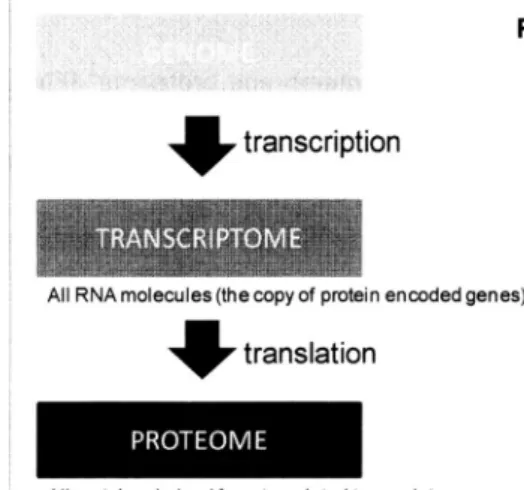
(9) CHAPTER. 1. Introduction 1.1. THE ROLE OF PROTEOME IN LIVING CELLS There are mainly three biological phases on sustaining life. These are genome, transcriptome proteome. and. (Figure 1). Genome stores biological information and functions as the blueprint of life,. though genome alone is not enough for expressing the written information. To use the information, proper kinds of proteins and RNAs are needed. Transcriptome which are the copy of protein encoded. is the term of all RNA molecules. genes and is the first products. of genome. Proteome is the term of all proteins existing in the cell derived from translated the second. or last products. of genome. expression.. Proteome. expression.. transcriptome. plays main important. and. biological. functions in the cell such as working as catalysts and organizing the cell. In particular, membrane proteins. are important. transmit. the information. important. because they first contact into/out. the surroundings. of the cell. Therefore,. functions such as cell adhesion, signal transduction,. endocytosis.. For understanding. the life, analyzing proteome,. of a cell and they have to. the membrane. proteins. have very. nutrient uptake, transportation, especially membrane. and. proteome,. crucial because of their essential activities in the cell. Figure 1 Genome, Transcriptome This is the optimized transcriptionGENOMES. 4 translation All proteins. derived. from. translated. figure of Figure 1.2 in. 3rd edition . There biological. AllRNA molecules (the copy of protein encoded genes). and Proteome. genome,. phases. transcriptome. understanding because. transcriptome.. 1. on. sustaining and. life, analyzing. of the important. are three life. proteome. proteome. biological. main. such. as. For the is crucial. functions.. is.
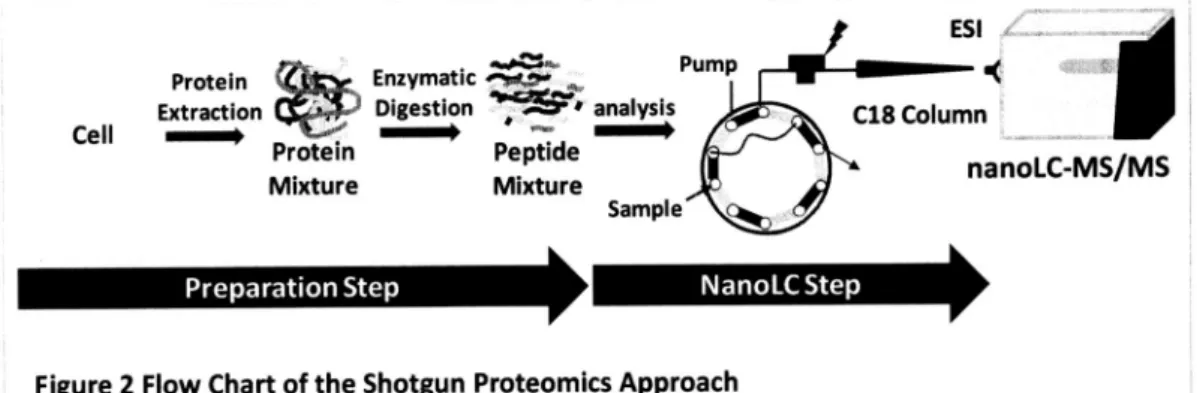
(10) 1.2. THE IMPORTANCE OF COMPREHENSIVE To analyze the proteome conventional. comprehensively,. ANALYSIS OF PROTEINS. two-dimensional. (2D) gel electrophoresis. is one of the. and powerful tools to identify and quantify proteomel' 2. The proteins are separated. by their isoelectoric. point (pl) for the 1St dimension. dimension. Although this approach. and molecular. weight (MW) for the. 2nd. is good for capturing the global picture of proteome, there are. some crucial limitations2's. Since the proteins are separated. by their pl for the 1st dimension,. the. proteins. which have very lower and higher pl are excluded from the gel. Thus, number of total. proteins. remaining the gel is reduced from the beginning condition.. analyze membrane non-detergent. proteins because of their hydrophobicity. In addition, it is difficult to. and their difficulty of solubilizing in the. isoelectoric focusing buffer. Moreover, it takes a time and effort to extract proteins. from gels and identify the proteins by mass spectrometry. Shotgun proteomics proteomics. is an alternative. powerful tool to the gels' 4. As the flowchart. shown in Figure 2, proteins are firstly extracted from the cell. The protein mixture is. digested by proteases to produce measurable analyzed. of shotgun. by LC-MS/MS and proteins. molecules (peptides) for MS. Then the peptides are. are immediately. identified by database. searching from the. MS/MS results. This approach is fast and high throughput,. but there are some limitations. As the. gel-based. proteins because of their hydrophobic. nature.. method, it is difficult to identify the membrane In our previous study, phase-transfer. analysis presented. remarkable. improvement. 3). However, it still remains challenging membrane. proteome. surfactants. (PTS) protocol for membrane. in the identification. tasks for the complete. in one organism because. of membrane identification. of the technical. complexity and dynamic range in the shotgun proteomics sample.. 2. limitations. proteome. proteomel. (Figure. of proteome and problems. and of.
(11) ESI w+4.Pump Protein (4a•Enzymatic "0".. Extraction CaftimDigestion,r~• analysis. Cell~~P. C18 Column. rotein~~Peptide—yrs\ MixtureMixturena. Preparation. nanoLC-MS/MS. Sample. •. •. StepNanoLC. Figure 2 Flow Chart of the Shotgun Since shotgun Since shotgun proteomics proteomics. • Step. Proteomics. Approach. is very very fast fast and and high high throughput throughput. approach, approach, it is un universally used. for the identification of proteome. In shotgun proteomics, the cells are broken and proteins are extracted.. The protein. mixture. is digested. by enzymes. to produce. measurable. molecules (peptides) for MS. Then the peptides are analyzed by LC-MS/MS and proteins are identified by database searching of the MS/MS results.. -^. ••^. -. :SDC , :Protein .2,1-,:Peptides 11. Protein. Tryptic. Removal. Peptide. extraction. digestion. of SDC containing solvents. collection. Figure 3 Phase Transfer Surfactant (PTS) Method The PTS method greatly improved the identification efficiency of membrane PTS method. uses sodium deoxycholate. (SDC) to solubilize the proteins.. proteinss. The After tryptic. digestion, the removal of SDC from the solution is first performed. by adding the ethyl. acetate. Then the solution is. and trifluoroacetic. naturally separated. acid (TFA) for subsequent. centrifugation.. into 2 layers, and the upper layer has SDC. For the complete removal of. the SDC from the tube, the upper layer is removed by pipette tips. The resultant solution is used as the peptides solution.. 3.
(12) 1.3.. OBJECTIVES. In this paper, identification. & SUMMARY. I focused. on the. efficiency. as shown. and the novel combination was computationally use the digestion. of cysteine. focused the. in Figure. that. method. and tryptic. digestion. efficiencies.. method. efficiencies,. Long. in the. of chemical. proteomics. approach. 2, I focused. on the preparation. and enzymatic. for the. to E. coli membrane-enriched the LC method column. efficiencies. 4. cleavage. E. coil membrane. sites. Then, the in silica results. monolith. and identification. shotgun. 2. In the chapter. it was effective. on the LC phase and examined. separation. separation. phases. digestion. analyzed. to apply the combined. two. long. phase. was developed.. proteome. samples.. gradient. were remarkably. the. analysis. It to. were proved experimentally. with long monolith with. to improve. In the chapter. silica column times. improved.. 3, I. to improve. exhibited. great.
(13) CHAPTER Chemical. 2. Cleavage-Assisted Membrane. Tryptic. Proteome. Digestion. for. Analysis. 2.1. INTRODUCTION Proteins localized in the plasma membrane. and other membranous. a wide range of physiological. including cell adhesion,. uptake, transportation, target. membrane. processes,. and endocytosis.. proteins6.. Therefore,. Consequently,. there. is great. analysis, particularly with mass spectrometry. proteome. analysis, the sample preparation. interest. (MS)-based approaches.. agenti-ll,. nutrient. pharmaceuticals. in large-scale. steps, including protein denaturation. crucial. Additives such as urea as a chaotropic methanol. signal transduction,. 65% of all contemporary. proteome. detergentll-ls,. organelles play critical roles in. membrane. For membrane and digestion, are. sodium dodecyl sulfate. (SDS) as a. as an organic solvent8-io, 13,14,16-21and other surfactantss-s,5, 12,22,23 are. commonly used to solubilize membrane. proteins, which are then digested, usually with trypsin, to. obtain peptides for MS analysis. The drawback of this approach. is that the additives have to be. diluted or removed to avoid de activation of the pro tease and poor LC-MS performance, reduced chromatographic. separation. and impaired peptide ionization24. When the additives are. diluted or removed, however, membrane less accessible to trypsin, resulting surfactant proteins,. proteins become less soluble and the structure. in reduced. efficiency of peptide. becomes. identification.. Acidlabile. (ALS)s-s'22'23 such as RapiGest, is well-known to be effective for solubilizing membrane compatible. hydrophobic Recently,. such as. our. with enzymes,. peptides research. and easily removed. often co-precipitate, group. developed. by precipitation. at low pH. However,. resulting in poor recovery of membrane a trypsin. 5. digestion. protocol. proteins22.. using phase. transfer.
(14) surfactants. (PTS)5, such as sodium deoxycholate. (SDC). With this protocol, we could identify more. membrane. proteins than was possible with ALS-assisted trypsin digestion. However, it remains a. challenging. task to analyze membrane. proteins. due to the intrinsic limitations of the trypsin. digestion procedure.. In general, there are few basic amino acids in the transmembrane. (TMD) of membrane. proteins, so that trypsin cleavage tends to afford quite large, hydrophobic. peptides.. Recently, Ficher et al.25 reported. cleavage specificities. that. combining different. is effective to identify hydrophobic. (CNBr) and chymotrypsin. peptides.. have been used in combination. proteases. domains. with different. So far, cyanogens. bromide. with trypsinlg' 25. These combined. digestion methods provided better results than tryptic digestion alone. Chemical reagents such as CNBr offer the advantage. that they can be used to solubilize hydrophobic proteins. under severe. conditions without the need to consider pro tease in activation. Recently, Swatkoski et al.26 applied a chemical cleavage reaction at Asp in the presence. of formic acid for yeast ribosome. proteome. analysis. Chemical. cleavage. bioengineering Jacobson. at cyanidated. since Catsimpoolas. cysteine. has been. frequently. and Wood2i introduced. used. in biochemistry. the cleavage reaction. in 1966, and. et al.28 modified it in 1973. The specific cleavage reaction of the peptide bond at the. N-terminal side of cysteine residues occurs under mild alkaline conditions after cyanidation groups with 2-nitro-s-thiocyanobenzoic nucleophilic cyanocysteine labeling. and. attack. acid (NTCB). This cleavage. of hydroxyl ion on the. residue.. Cyanocysteine. proteins2g, C-terminal. carbonyl. cleavage. amidation. carbon. reaction. at the. N-terminal. has been widely applied. of synthetic. peptidesso,. is induced. of SH by the. side of the. in various fields, for. ligation of two peptidessl,. immobilization of proteins at the C-terminuss2 and backbone cyclization of proteinsss. Because this reaction proceeds under alkaline conditions where membrane efficiency, it should be applicable directly to membrane. 6. proteins can be extracted. proteome. analysis.. with high.
(15) In this. chapter,. I developed. cyanocysteine-mediated. predicted Escherichia. the. cleavage. effect coll. a combination. of combining. membrane cleavage. optimized. digestion. combination. with subsequent. followed. cleavage. proteome. cyanocysteine-mediated cyanocysteine. reaction. approach. tryptic. by tryptic. at Cys with analysis.. was experimentally method. for membrane. digestion. optimized. analysis,. using. First, I computationally. cleavage. chemical. at. Lys and. digestion. for proteome. analysis.. to E. coll membrane-enriched. in the presence. 7. tryptic. Then,. was applied. digestion.. proteome. of SDC according. Arg for. based. on. Finally, the fractions. to PTS protocol.. in.
(16) 2.2. MATERIALS AND METHODS 2.2.1. Materials. Sodium hydroxide, hydrochloride hydrochloride. sodium. hydrogen. (AEBSF) were. from. carbonate Nakalai. and 4-(2-aminoethyl)benzenesulfonyl. (Kyoto, Japan).. Tris (2-carboxyethyl). (TCEP) was from Pierce (Rockford, IL). 2-Nitro-s-thiocyanobenzoic. fluoride phosphine. acid (NTCB) was. obtained from Tokyo Chemical Industry (Tokyo, Japan). C18 Empore disc cartridges and membranes were from 3 M (St. Paul, MN). Water was purified by a Millipore Milli-Q system (Bedfold, MA). Sodium deoxycholate acetonitrile, carbonate,. (SDC), mass spectrometry-grade. acetic acid, methanol, phenylisothiocyanate,. trifluoroacetic glutathione,. lysyl endoprotease. (Lys-C), ethyl acetate,. acid (TFA), urea, iodoacetamide. cyanogens. (IAA), sodium. bromide (CNBr) and all other chemicals. were purchased from wake (Osaka, Japan).. 2.2.2. Preparation. of membrane-enriched. E. coll strain BW2slls. fractions of Escherichia coli BW25113 cells.. cells grown in Luria-Bertani (LB) cultures at 37 °C were used in this study.. The cell pellet was prepared by centrifugation. at 4,500 g for 10 min and was re suspended. in 10 mL. of ice-cold 1 M KCI, 15 mM Tris (pFi 7.4). A pro tease inhibitor AEBSF was added to the final concentration. of 10 mM. The cells were lysed by ultrasonication,. and unbroken. was centrifuged. cells and debris. were precipitated. at 2,500 g for 5 min. The supernatant. and the resultant. pellet was re suspended in ice-cold 0.1 M Na2COs solution. After centrifugation. 100,000 g for 60 min, the pellet was collected as the membrane-enriched. 2.2.3. Optimization of cyanocysteine. at. fraction.. cleavage reaction.. E. coli whole cell lysate was dissolved in 50 mM sodium carbonate protein concentration. at 100,000 g for 60 min,. buffer (8 M urea) to make a. of 5 µM, assuming the average molecular weight of all proteins is 35,000 Da.. 8.
(17) Prior to the chemical modification, cyanidated The. protein was reduced. with TCEP at 37 °C for 30 min and. with NTCB.The solution was diluted 4-fold and digested overnight with trypsin at 37 °C.. solution. was. acidified. with. TFA and. nanoLC-MS/MS analysis. Reaction parameters, TCEP concentration,. the NTCB concentration,. desalted. with. Cl8-StageTipss4. for. subsequent. such as the cyanidation time, the digestion time, the the buffer constituents. and pH, are described. in. Results and Discussion.. 2.2.4. In-solution Cys cleavage-trypsin The membrane-enriched. fraction. digestion of membrane-enriched. was dissolved. fraction.. in 50 mM sodium carbonate. buffer at pH 11. containing 5% SDC. Proteins were reduced with a 10-fold molar excess of TCEP at 37 °C for 30 min and cyanidated. with a 100-fold molar excess of NTCB at 37 °C for 30 min. The sample solution. was diluted 10-fold. and digested with trypsin at 37 °C for 8 h (trypsin-to-protein. ratio of 1:50. (w/w)). An equal volume of ethyl acetate was added to the solution and the mixture was acidified with the final concentration. of 0.5% TFA according to the PTS protocol reported. mixture was shaken for 1 min and centrifuged. previouslys. The. at 15,700g for 2 min, then the aqueous phase was. collected and desalted with Cl8- StageTipss4. For in-solution trypsin digestion, the same procedure was employed,. except that a Cys alkylation step with IAA was performed. instead of the NTCBaddition step.. 9. at 37 °C for 30 min.
(18) 2.2.5. Peptide fractionation In accordance. with the StageTip fractionation. strong cation exchange performed. for. the. SCX-StageTipss6 were acetonitrile. of digested samples. protocolss, fractionations. (SCX) disk and poly(styrene-divinylbenzene) digested used. and. membrane-enriched 20-500. samples.. mM ammonium. using StageTips with a. copolymer For. acetate. the. (SDB) disk were. SCX fractionation,. solutions. containing. 15%. were employed to elute peptides, resulting in 5 fractions. All eluted fractions, including. the flow-through. fraction, were desalted by means of Cl8-StageTips. For the SDB fractionation,. 40. pL of 0.1% NH4OH, 5% ACN (fraction 1), 0.1% NH4OH, 10% ACN (fraction 2), 0.1% NH4OH, 20% ACN (fraction 3) and 0.1% NH4OH, 80% ACN (fraction 4) buffers were used as elution buffers for SDB-StageTips after the sample solution had been loaded. The resultant flow-through fraction, in addition to the unfractionated. 5 samples, including the. sample, were desalted with Cl8-StageTips.. 2.2.6. NanoLC-MS system. An LTQ-Orbitrap XL (Thermo Fisher Scientific, Bremen, Germany) or a QSTAR-XL(AB/MDS-Sciex, Toronto, Canada) with a nanoLC interface (Nikkyo Technos, Tokyo, Japan), Dion ex Ultimatesooo pump with. FLM-sooo flow manager. Analytics, Zwingen, Switzerland). (Germering,. was employed. Germany),. and HTC-PAL autosampler. for nanoLC-MS/MS measurement.. (CTC. A self-pulled. needle (150 mm length, 100 pin i.d., 6 pin opening) packed with ReproSil-Pur Cl8-AQ materials (3 pin, Dr. Maisch, Ammerbuch, Germany) was used as an analytical column with "stone-arch". fritsi.. The injection volume was 5 pL, and the flow rate was 500 nL/min. The mobile phases consisted of (A) 0.5% acetic acid and (B) 0.5% acetic acid and 80% acetonitrile.. A three-step. linear gradient of. 5-10% B in 5 min, 10-40% B in 60 min, 40-100% B in 5 min, and 100% B for 10 min was employed throughout. this study. A spray voltage of 2,400 V was applied. The MS scan range was m/z. 300-1,500 (LTQ-Orbitrap) or 350-1,400 (QSTAR). For the LTQ-Orbitrap, the top 10 precursor. 10. ions.
(19) were selected. in MS scan for subsequent. MS/MS scans by ion trapping. in the automated. gain. control (AGC) mode; AGC values of 5.00 x 10⁵ and 1.00 x 10⁴ were set for full MS and MS/MS, respectively. The normalized CID was set to be 35.0. A lock mass function was used to obtain stable and accurate m/z values within 3 ppm. For QSTAR experiments, to select three intense peaks, and subsequently each. An information dependent scanned precursor. MS scans were performed. three MS/MS scans were performed. for 1 s. for 0.55 s. acquisition function was activated for 90 s to exclude previously. ions. The CID energy was automatically. adjusted. by the rolling CID function of. Analyst QS 1.1.. 2.2.7. Data analysis and bioinformatics. The raw data files were analyzed by Mass Navigator v1.2 (Mitsui Knowledge Industry, Tokyo, Japan) to create peak lists on the basis of the recorded fragmentation. spectra. In order to improve the. quality of MS/MS spectra, Mass Navigator discarded all peaks with an absolute. intensity of less. than 10, and with an intensity of less than 0.1% of the most intense peak in MS/MS spectra, and an in-house. Perl script called "mgf creator". corresponding. monoisotopic. converted. the m/z values of the isotope. peaks to the. peaks when the isotope peaks were selected as the precursor ionss8.. Peptides and proteins were identified by Mascot v2.2 (Matrix Science, London, U.K.) against the total. ORF. amino. acids. sequences. (http://ecoli.naist.jp/GB6/search.jsp). of. E.. with a precursor. coil. K-l2. (BW2slls). mass tolerance. from. GenoBase. of 3 ppm (LTQ-Orbitrap) or. 0.25 Da (QSTAR), and strict specificity allowing for up to 2 missed cleavages. For trypsin digestion, carbamidomethylation allowed. as. dehydroalanine modifications.. of cysteine was set as a fixed modification, and methionine. a variable conversion. modification. of cysteine,. For Cys cleavage-trypsin and methionine. oxidation. digestion, were. oxidation was. cyanidation. allowed. and. as variable. Note that cysteine of Cys-cleaved C-terminal peptides (2- iminothiazoline-4-carbonyl. 11.
(20) amino terminal peptides) has the same mass of the cyanidation modification. Peptides were rejected if the Mascot score was below the 95% confidence limit based on the "identity" score of each peptide, and a minimum of two peptides meeting the criteria was required for protein identification. False-positive rates (FPR)were estimated by searching against a randomized decoy database created by the Mascot Perl program supplied by Matrix Science. The grand average hydropathy (GRAVY)values for identified proteins and peptides were calculated according to a previous reportsg. Proteins and peptides exhibiting positive GRAVYvalues were recognized as hydrophobic. Mapping of transmembrane (TM) domains for the identified proteins was conducted using. the. TM. hidden. Markov. http://www.obs.dtu.dk/services/TMHMM-2.0/,. model. (TMHMM). algorithm. available. at. to which FASTAfiles were submitted in batch. mode4o. Information on the subcellular location of identified proteins was obtained from gene ontology (GO) component terms using GOSlim (http://www.geneontology.org). E. coll in silica digestion was performed using an in-house Perl ver.5.6.1 script.. 12.
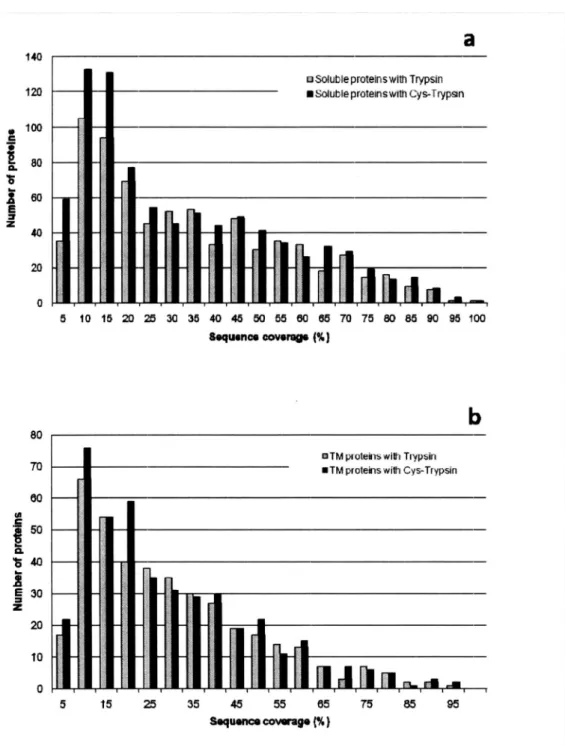
(21) 2.3. RESULTSAND DISCUSSION 2.3.1.In silico prediction of effects of digestion at Cys on membrane proteome. Since tryptic peptides generated from membrane proteins are in general longer than those generated from soluble proteins and the scan range of MS for peptides is limited (typically m/z 350-1500), I first evaluated the observability of peptides from E. coll membrane and soluble proteins. All E. coll proteins were digested in silica at the C-terminal sides of K and R (i.e., trypsin cleavage) and at the C-terminal sides of Kand R, as well as the N-terminal side of C (i.e., trypsin and cyanocysteine-mediated cleavage). Figure 4 shows the distribution of sequence coverage, assuming that MS-detectable peptides range in mass from 700 to 3,000 Da and the digestion reaction proceeds with 100% efficiency. Higher coverage (on average) and narrower distribution were obtained for soluble proteins in comparison to membrane proteins (Figure 4a). This would be one of the reasons why the membrane proteome has been less well characterized than the soluble portion of the whole proteome. By adding Cys cleavage to the tryptic cleavage sites, approximately 15-20% higher sequence coverage on average was observed for membrane proteins, whereas almost unchanged coverage was obtained for soluble proteins (Figure 4b,c). These in silica analyses indicate that Cys cleavage in addition to tryptic digestion would facilitate efficient membrane proteome analysis by MS, provided that other factors such as solubility and the digestion efficiency of membrane proteins are not limiting factors.. 13.
(22) 18.0. a3. o^^up*^^°m^=*. 18.0. Figure. 4. sequence. 140. —colli. 12.0. —. 10.0. ^^. I 8.0. ^^. 8.0. —. 40. |^ 0.0. --_-. 0. [. ,. 10. ^. 30. 20. ^. 40. 50. ^. 80. Sequence. soluble proteins (gray bar) and proteins. 80. 90. 100 digested. with. bar). trypsin;. with Cys-Trypsin. between. digested. b— (gray. %nh Trypsr. ^ Soluble prolefrs. (black. (b). (%). proteins. 18.0. between. ^^. 70. 18.0 protons. insilicao. Comparison. comparison. ~ Soluble. in. di gestion. — TM. ^^. 20. of. coverage for the E.. proteome. (a). 1. 111. Distribution. bar). soluble. with trypsin. and. with. Cys. 1 140. cleavage-trypsin. I. 12.0. r. comparison. 10.0. I 8.0. Irr. I. —. proteins. I. —. ( gray. 8.0. between. digested bar). TM. with trypsin. and. with. Cys. 1. 40. cleavage-trypsin. I. 20 0.0. (black bar); (c). [I_,.1.1.1111 0. 10. l. 30. 20. 40. 50 ea0. Sequence. 70. BO. 90. covurao.(%). (black bar). E.. BR,colli whole proteome from 100 GenoBase was digested insilicao, and peptides ranging from 700 to 3,000 Da were used for the. 18.0. elTMproteinswithTrypsnC 18.0. —. -analysis.. • TM proteins with C is-Trypsinn. 140. —. 12.0. -. In total, 3,273 soluble. proteins and 1 ,043 TM proteins were obtained in this way from. 10.0 8.0. I. 8.0. I- 'F I. n I. 4.0 20. if. I. I. 0. Fl. I. 10. m. 40 50 00 Sequence coverage f%). Genobase,. —. numbers. were. and. these. used. to. I. 1:11. i I 30. the. calculate. r. 0.0. _. 50. 70. 90. too. the contents. soluble. and TM proteins.. proteins. were predicted. the TMHMM program.. 14. (%) of TM using.
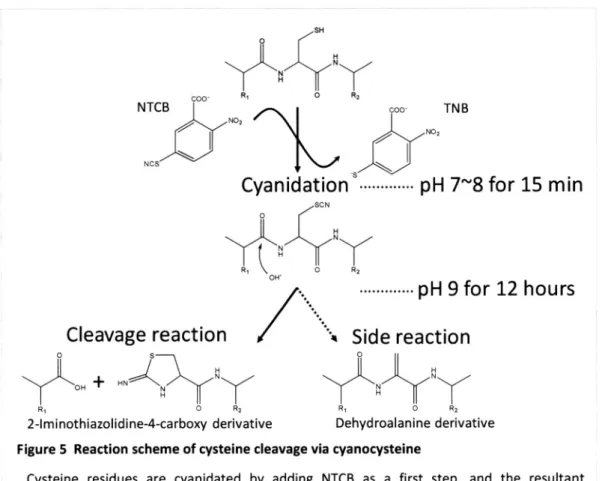
(23) 2.3.2. Optimization. of Cys cleavage protocol.. To cleave the peptide bond at Cys experimentally,. I employed the cyanocysteine. As shown in Figure 5, cysteine residues are cyanidated cyanidated. this reaction. takes 12 h, and purification. required. To apply this reaction required lysates.. by NTCB as a first step, then the resultant. peptides are digested at the N-terminal side of cyanocysteine. Conventionally,. to proteome-wide. cyanidation. whether. analysis, I aimed to minimize the number. step between. the. and the cleavage steps. By controlling the amounts of TCEP and NTCB relative to the amount. quantitatively. without any purification step (the conventional. reaction. of. study, I used E. coll whole cell. it was possible to omit the purification. total protein. found that. under alkaline conditions.. of the product after the first step is. steps, as well as the reaction time. In this optimization First, I examined. cleavage reaction.. (NTCB/TCEP/proteins). the cyanidation. reaction. 100:10:1. proceeds. M), I could obtain the cleaved products method was used as a control). I also. under alkaline conditions,. occurs. In addition, higher pH resulted. in a shorter. where. the cleavage. reaction time, as well as a greater. number of identified Cys-cleaved peptides, when I examined reaction buffers of pH 8, 9, 10, and 11. This would be because the cleavage reaction is based on the nucleophilic attack of hydroxyl ions on the carbonyl carbon at the N-terminal side of cyanocysteine increases. the. formation. of side products,. is-eliminationsl, 41,42 In the conventional digested. at pH 9. After optimization,. residues, and a longer reaction time. such as dehydroalanine. protocol, proteins I established. derivatives. were cyanidated. a single-step. protocol. digestion in one pot at pH 11 for 30 min. NanoLC-MSMS analysis of fragments protocol identified approximately. generated. at neutral. pH and. for cyanidation obtained. by. and. with this. twice as many Cys-cleaved peptides as when the conventional. protocol was used (184 in this protocol, 100 in the conventional protocol). PITC-labeled glutathione phenylthiocarbamyl. was used to estimate. glutamic acid was separated. the. recovery of this protocol.. The resultant. by reversed phase HPLC and was detected. 15. at 254.
(24) nm. The recovery was 73.0 ± 0.3% (n = 3). This value was supported by the results from E. coll samples where 68% of the total cysteine-containing peptides was Cys-cleaved peptides, while 22% and 9% were a-elimination peptides and uncleaved cyanocysteine peptides42, respectively. Note that I did not observe potential side products as well as the residue modifications at pH 11 such as carbamylated lysine, thionitrobenzoate. derivatives and a-elimination products of serine and. threonine. Since the most widely used chemical cleavage reaction is methionine cleavage by CNBr,I compared the Cys cleavage-trypsin digestion protocol with the conventional CNBr-trypsinprotocol' for 50 pg of E. coll membrane fraction. As a result, CNBr-trypsinprovided only 39 identified proteins (190 peptides), whereas Cys cleavage-trypsin gave 487 proteins (3,672 peptides) in total from triplicate analysis. This might be because the sample solution became turbid when pH of the sample solution changed from acidic pH to weak basic pH after the CNBrcleavage. In addition, the sample amount was relatively low compared to the conventional procedure (— 1 mg). On the other hand, the sample solution was kept under basic conditions throughout the Cys cleavage-trypsin protocol.. 16.
(25) H. /SH H. `~. N. R. COO'. C. Rz. NTCB. TN B. COO' NO, NO2. NCS. Cyanidationsv.............pH. 7-8 for 15 min. /SCN O. Rl. OH-. O. R2. ............. Cleavage. reaction. pH9. for 12 hours. '4 Side reaction. 0. H +N. HN./VN. R20. Rio. 2-Iminothiazolidine-4-carboxy Figure. 5 Reaction. Cysteine. scheme. residues. are. cyanidated. peptides. conditions;. conventionally. R2. derivative of cysteine. cyanidated. are cleaved. cleavage by adding. at the. this reaction. via cyanocysteine NTCB as a first. N-terminal is completed. 17. step,. and. side of cyanocysteine in approximately. 12 h.. the under. resultant alkaline.
(26) 2.3.3. Reproducibility. and false positive identification. With the use of the established reproducibility. rate in the Cys cleavage-trypsin. protocols of Cys cleavage and trypsin digestion, I evaluated. as well as the rate of false positive identification.. sample preparation. the. I carried out duplicate analyses of. including the digestion step and did duplicate nanoLC-MS/MS measurements. for each sample (4 data sets in total) (Table 1). Considering the day-to-day preparation. protocol.. as well as the variation in LC-MS measurement,. the reproducibility in the identification. number of peptides and proteins using the Cys cleavage-trypsin the PTS-trypsin protocol. variation in sample. protocol was similar to that using. in our previous study'. Since the Cys cleavage-trypsin. consider more variable modifications during the Mascot database higher false positive identification. protocol. has to. searching step, it might have a. rate. However, a random database. search identified only a few. false positive peptides, and the false positive rates in peptide and protein identification were 0.24% and 0.73%, respectively. previous study',. Compared with the false positive rate of the PTS-trypsin protocol in our. introduction. of variable modification. of Cys did not significantly decrease. the. reliability of protein identification. I also evaluated. the contents. cleavage sites generated difference. between. peptides:. peptides:. respectively). 22.4% for the. and peptides. 18. missed tryptic. and the Cys cleavage-trypsin. protocol. in. 2.8% and 2.9% for the Cys cleavage-trypsin. and missed tryptic cleavage. Cys cleavage-trypsin. respectively).. containing. protocol. As a result, I did not find any. trypsin protocol. cleavage (semitryptic. and the trypsin protocol, 21.4% and. peptides. by the Cys cleavage-trypsin. the conventional. terms of semitryptic protocol. of semitryptic. protocol. and the. (missed cleavage trypsin. protocol,.
(27) Table. 1 Reproducibility. and. False. Positive. Identification. Rate. in. the. Cys. Cleavage-Trypsin. Protocol° Batch. Cys cleavage-trypsin. 1. Batch. Average (SD) inj. 1. inj. 2. 2,234 (217). 372. 347. 325. 352 (21). 154. 155. 149. 137. 149 (8). 67. 68. 61. 58. 64 (5). no. of total proteins. 364. False positive. membrane. proteins. 2,388. rate. Peptide Protein. a The E . coll membrane-enriched using. the. inj. 2 1,957. 2,425. no. of TM proteins. inj. 1 2,166. no. of total peptides. no. of other. 2. protocol. Cys cleavage-trypsin. 0.24. %. 0.73. %. fraction (14 pg) was employed for duplicate sample preparations protocol. and. duplicate. measurements. were. done. nanoLC-MS/MS (LTQ-Orbitrap). False positive rate was calculated for the merged results.. 19. using.
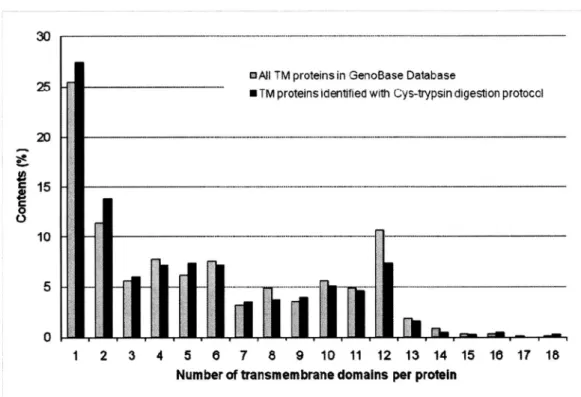
(28) 2.3.4. Application. of the Cys cleavage-trypsin. two-dimensional. protocol. to E. coli membrane. of the new protocol to E. coli membrane. the digested. using both ion exchange. samples. I also evaluate. and reversed. the effect of introducing. proteome. Cys cleavage on the. proteins. they represent peptides,. cleavage-trypsin. protocol,. In this way, I successfully. peptides.. Compared. whereas. 14,338 peptides. 12,561 peptides. (Table 2). Interestingly,. efficiency for membrane. to provide an. with the PTS-trypsin protocol, of proteins. and 1,530 proteins. and 1,330 proteins. and. with the Cys. were found. with the. more soluble. protocol than with the trypsin protocol, proteins. was also improved. with the. Cys. protocol, as predicted (Figure 6). Note that the soluble proteins identified in this. study were not from the soluble fraction of E. coll cells, but from the membrane-enriched Therefore,. LC-MS/MS. identified 667 E. coll. contrary to the in silica prediction,. with the Cys cleavage-trypsin. identification. cleavage-trypsin. and proteins.. In total, I identified. were observed the. followed by duplicate. increases of more than 10% and 18% in the identified numbers. PTS-trypsin protocol. though. peptides. and 5,542 hydrophobic. respectively.. proteins. PTS-trypsin protocol.. for each sample were carried out, and the results were merged. overall list of identified membrane. analysis, I fractionated. phase modes prior to LC-MS/MS. Duplicate analyses coupled with two different prefractionations measurements. using. LC-MS/MS.. To explore application. analyses.. proteome. I presumed that the improvement. fraction.. for soluble proteins arose because the releasing step. of soluble proteins from the membrane-enriched. pellets was limiting, unless the Cys cleavage was. employed. To test this hypothesis, I reversed the order of the digestion in the Cys cleavage-trypsin protocol,. that is, tryptic digestion. reversed. protocol gave worse results than the Cys cleave-trypsin. results to the trypsin protocol. achieved. protocol. unbiased. was done before. Cys cleavage. (Table 3). Next, I evaluated. digestion,. independent. 20. of the. reaction.. As expected,. this. protocol and almost identical. whether. the Cys cleavage-trypsin. TMD number. per protein.. The.
(29) experimental. pattern of the distribution of TMD number for transmembrane. excellent agreement. with the predicted. pattern. for GenoBase-registered. (TM) proteins was in TM proteins (Figure 7),. supporting the view that our digestion protocol is unbiased, that is, that cleavage is independent the TMD number per protein. I also evaluated the coverage of membrane this study by comparing our results with the GenoBase-registered I examined. the coverage within various subcategories. proteins predicted by TMHMM algorisms, transporters. proteome. membrane. of the membrane. of. identified in. proteome. In addition, proteome,. such as TM. and ABC superfamily proteins categorized. by 'gene product description'. of GenoBase. As shown in Table 4, the coverage values were quite. consistent. at approximately. in all subcategories. 40%. Furthermore,. I checked the total number of. TMD of all proteins and confirmed that the coverage was also approximately strongly support the conclusion that unbiased identification based on cyanocysteine. cleavage-assisted. trypsin digestion.. 21. 40%. These results. was achieved with our new protocol.
(30) z. 140. 120. •. 100. xe C 6 S. I. 60. Es z 40. 20. a 5. 10. 15. 20. 25. 30. 40 45 50 55 60 65 70 75 80 85 90 95 100 Sequence coverage (%). 35. b 80 70 80 c. 50. a ~: g 30 20. lo. 0. 5. is. 25. 35. Figure 6 Distribution of sequence (a) Soluble proteins. identified. 45 55 85 Sequence coverage (%}. 75. 8595. coverage for the identified proteins using the Cys cleavage-trypsin. protocol. and the trypsin. protocol are indicated by black and gray bars, respectively. (b) TM proteins identified using the Cys cleavage-trypsin. protocol and the trypsin protocol are indicated by black and gray. bars, respectively. The sequence on the experimental. coverage of each identified protein was calculated based. results shown in Table 2.. 22.
(31) 30 -----------------------------------------------------------------------— - —. --. -. DAJI OAtI TM proteins in GenoBase Database TM proteins identified with Cys-trypsin digestion protocol. --••25. 11----------------• TM proteins identified with Cys-trypsin digestion protocol 20. 11 c. 15. i' 10 n. 5. -. 1-,. z. J' -•. ^. ^. I 1. 2. 3. Figure 7 Comparison cleavage-trypsin. III----------------------. ^. I 4. al M6. 5 8 7 8 9 10 11 12 13 14 15 Number of transmembrane domains per protein. of the TMD numbers. per protein. identified. 18. 17. 18. according to the Cys. protocol with those from GenoBase. In total, 1,043 TM proteins were predicted from Genobase identified using the Cys cleavage-trypsin. and 434 TM proteins. were. protocol. These total numbers and the numbers of. TMD predicted by TMHMM were used to calculate the content (%) of TM proteins.. 23.
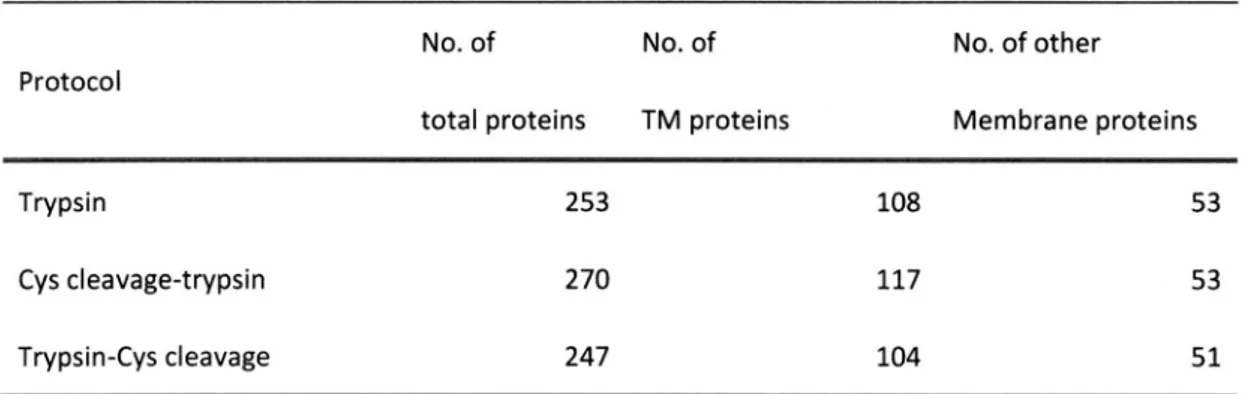
(32) Table. 2 E. coil. PTS-Trypsin. Membrane. Proteome. Analysis. Using. the. Cys. Cleavage-Trypsin. Protocol. and. Protocol°. protocol. No. of peptides/proteins. increase. Cys Cleavage-trypsin. trypsin. No. of total unique. peptides. 12,561. 14,338. 14.1. No. of hydrophobic. peptides. 4,689. 5,542. 18.2. No. of total unique. proteins. 1,330. 1,530. 15.0. 605. 667. 10.2. No. of membrane. proteins. aE . coil membrane-enriched. fractions (14 µg) extracted. with 5% SDC were used. Details of both. protocols are described in Materials and Methods. For both SCX and SDB fractionation duplicate. sample. preparations. coupled. with. duplicate. nanoLC-MS. approaches,. measurements. using. LTQ-Orbitrap for each sample were carried out, and the obtained results per protocol were merged. Membrane. proteins were defined by using TMHMM, GO terms and GRAVYscores. Hydrophilic and. hydrophobic peptides were categorized on the basis of GRAVYscores. Table 3 Impact. of the Preceding. Cys Cleavage. on Protein. Identification. No. of. No. of. No. of other. total proteins. TM proteins. Membrane. Protocol proteins. Trypsin. 253. 108. 53. Cys cleavage-trypsin. 270. 117. 53. Trypsin-Cys. 247. 104. 51. cleavage. a The E . coll membrane-enriched. fraction (14 µg) was employed for each protocol. The 'Trypsin-Cys. cleavage' protocol consisted of trypsin digestion followed by Cys cleavage reaction. The digested samples. were analyzed. by nanoLC-MS/MS (QSTAR). Triplicate analyses. merged results are shown.. 24. were performed. and.
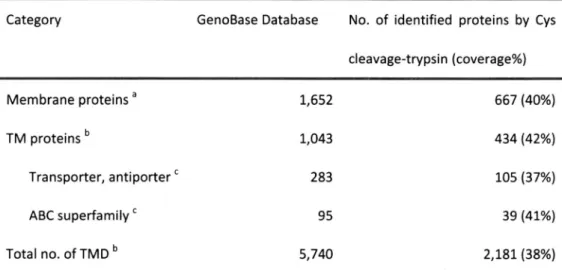
(33) Table 4 Profile. of Coverage. in Subgroups. Category. GenoBase. of the E. coll Membrane. Proteome. No. of identified. Database. cleavage-trypsin Membrane. proteins. TM proteins. a. b. Transporter,. antiporter. `. a Membrane were. defined. description'. proteins using. (coverage%). 1,652. 667 (40%). 1,043. 434 (42%). 283. 105 (37%). 95. 39 (41%). ABC superfamily Total no. of TMD b. proteins by Cys. 2,181 (38%). 5,740. were. defined. TMHMM.. using TMHMM. C Subcategories. , GO terms. were. of GenoBase.. 25. classified. and. GRAVY scores.. according. to the. b TM proteins 'gene. product.
(34) 2.4.. CONCLUSIONS. I showed trypsin. that. the introduction. cleavage. increased. analysis.. The. provides. a higher. prediction. from. membrane number. this protocol wider coverage. protocol. in silica. per protein.. currently. peptides,. identification takes. Further where. for membrane. than. the. than. the. in LC-MS-based the. was. approximately. 13% of the MS observable. reproducible proteome. according. it is expected. with various. 26. organisms.. with. proteome protocol,. and. in agreement method. independent. by optimization. to the LC retention. and unbiased, analysis. new. and. will be achieved. range. trypsin. protocol,. of the. unbiased. in combination membrane. conventional. PTS-trypsin. of application. digestion. reaction. improvement. LC elution. simple,. no longer. The results that. cleavage. efficiency. efficiency. analysis.. indicated. out of the is quite. the. identification. proteome. hydrophobic were. optimized. of cyanocysteine-mediated. peptides time. to the. with E. coil. of the. of LC conditions. TMD for. from TM proteins prediction4s.. to be useful. Since. in providing.
(35) CHAPTER 3 Toward. the complete. membrane. proteome. analysis 3.1. INTRODUCTION Proteins have critical roles to organize the cell and process the various physiological functions. As mentioned. in the chapter. functions, chapter,. and therefore I focused. Consequently,. 1 and 2, membrane. proteins. the analyses of the membrane. on the. sample. preparation. the cyanocysteine-mediated. with achieving unbiased identification. play key roles in these proteins. are important.. step to improve. the. physiological. In the previous. identification. efficiency.. cleavage reaction facilitated the identification efficiency. in LC-MS based membrane. proteome. analysis44. However, I. only identified about 40 % of the total E. coll proteins even using this new method. Compared to the other -omics method, the immaturity of the proteomics is still obvious. There are mainly two problems which prevent complete proteomics. identification. of proteome. by shotgun. approach. Those are complexity and dynamic range problems existing in analyzing the. shotgun proteomics. samples. Firstly, in shotgun proteomics,. proteins. have to be cleaved before. LC-MS analyses. The complexity of the sample is drastically increased at this process. Taking E. coll proteins for example, the number of tryptic peptides is about 130,000, although the number of E. coll proteins is about 4,000. This enormous range of peptides cannot be separated. in a short time. single LC,and then lots of peptide ions are co-eluted and are injected into the MS at the same time. The limited numbers of peptide ions are selected for MS/MS according to its MS signal intensity in descending. order above certain criteria to identify the peptides.. Large amounts of peptides. get. higher MS signal intensity and are identified in high efficiency. On the other hand, small amounts of. 27.
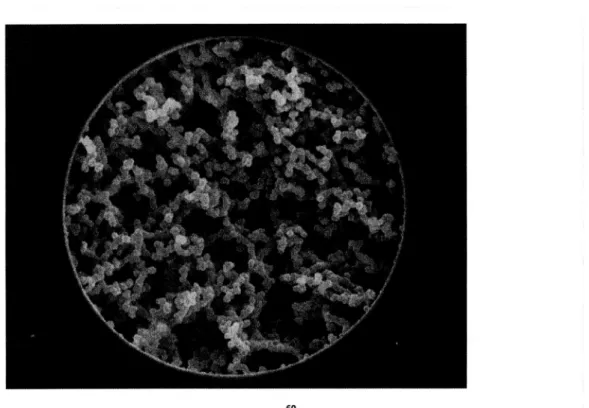
(36) peptides. get lower MS signal intensity which is hard to be selected. identification suppression. efficiency. of the. small amounts. of peptides. in the step of ionization and detectors. for MS/MS, then. are very low. Secondly, there. become suppressed. is. in the MS. Larger amounts of peptides tend to. get higher ionization rate. Moreover, because the ion capacity of the detector they occupy the detector. the. because of their abundance.. in the MS is limited,. Therefore, smaller amounts. of peptides. and they never seen in the results of the LC-MS/MS analyses even though they. exist in the sample. To solve such problems development. and improve the identification. on shotgun proteomics. have focused on the sample preparation. are such as using various kinds of fractionation complexity and dynamic. efficiency, most reports. about. steps. The methods. methods before LC-MS/MS analyses to reduce the. range in the sample4s-s2 In 2008, Godoy et al.,si achieved. identification of yeast proteome. method. complete. through 41 day analyses of various prepared samples. However, it. is impractical to spend over one month to analyze one sample. This is not the perfect solution for the problems. In this study, I focused on the separation identification. of complete. step in nanoLC to solve the problems and achieve the. E. coll proteome. experimentally, the separation. in short time LC-MS/MS analysis. Theoretically. and. efficiency is increased as the column length is increasedss-s' The size. of the beads in columns becomes smaller, the peak width becomes sharper and the peak intensity gets hihers4,ssHowever, gpproach. particle-packed Monolith. there is drawback of this approach. The back pressure gets higher as the. columns become longer and exceeds the bearable pressure limits of HPLC machines.. silica columns. are. different. from the. particle-packed. structuress-s~, s9, 60(Figure 8). The small-sized silica skeletons compared to the particle-packed. columns. in its 3D network. and the larger flow-through. pores. columns allow using longer columns with lower back pressures. which are bearable to conventional. HPLC instruments.. 28. In 2008, Miyamoto et al.,57 analyzed BSA.
(37) tryptic. digested. peak capacity E. coll proteome. samples. with 30 cm or 300 cm monolith. was increased analysis,. about. 3.8-fold. and optimized. Figure 8 A SEM image of a monolithic Monolith compared columns. silica columns to the. in 300 cm column.. the LC parameters. with lower back pressures. I applied. to increase. which. resulted. monolith. in that. silica columns. the identification. silica skeletons. columns.. The. monolith. which are bearable. 29. and. larger. property. flow-through allows. to HPLC instruments.. using. the for. efficiency.. column6°. have small-sized. particle-packed. silica column,. pores longer.
(38) 3.2. MATERIALSAND METHODS 3.2.1. Materials. Sodium hydroxide, sodium hydrogen carbonate and 4-(2-aminoethyl) benzenesulfonyl fluoride hydrochloride (AEBSF) were from Nacalai (Kyoto, Japan). Tris (2-carboxyethyl) phosphine hydrochloride (TCEP)was from PIERCE(Rockford, IL, USA). C18 Empore disc cartridges and membranes were from 3M (St. Paul, MN, USA).Water was purified by a Millipore Milli-Q system (Bedfold, MA, USA). Sodium deoxycholate (SDC), sodium lauroylsarcosinate (SLS), mass spectrometry-grade lysyl endprotease (Lys-C),ethyl acetate, acetonitrile, acetic acid, methanol, trifluoroacetic acid (TFA),urea, iodoacetamide (IAA),sodium carbonate and all other chemicals were purchased from wake (Osaka, Japan). Monolith silica columns (100 µm I.D., 350 cm long) were from Dr.Tanaka and Mr. Miwa.. 3.2.2. Preparation of whole cell lysate of Escherichia coll BW25113 cells. Escherichia coll (E. coll) strain BW2slls cells grown in Luria-Bertani (LB)cultures at 37 °C were used in this study. The cell pellet was prepared by centrifugation at 4,500 g for 10 min and was re suspended in 10 mL of ice-cold 1 M KCI,15 mM Tris (pH 7.4). A pro tease inhibitor AEBSFwas added to the final concentration of 10 mM. The cells were lysed by ultrasonication, and the unbroken cells and debris were precipitated at 2,500 g for 5 min. The resultant pellet was used for whole cell lysate analyses.. 3.2.3. In-solution trypsin digestion for the whole cell lysates. The whole cell lysates were dissolved in 50 mM sodium carbonate buffer at pH 11 containing 12 mM SDCand 12 mM SLS.Proteins were reduced with a lo-fold molar excess of TCEPat 37 °C for 30 min and alkylated with a loo-fold molar excess of IAAat 37 °C for 30 min. The sample solution. 30.
(39) was diluted s-fold and digested. with trypsin at 37 °C for 0/N (trypsin-to-protein. ratio of 1:50. (w/w)). An equal volume of ethyl acetate was added to the solution and the mixture was acidified with the final concentration. of 0.5% TFA according to the PTS protocol reported. previouslys. The. mixture was shaken for 1 min and centrifuged at 15,ioog for 2 min, then the aqueous phase was collected and desalted with Cl8- StageTipss4.. 3.2.4. Peptide fractionation In accordance. of digested samples.. with the StageTip fractionation. protocolss, fractionations. using StageTips with a. strong cation exchange (SCX) disk were performed for the digested samples. SCX-StageTipss6 were used and 20-500 mM ammonium elute peptides,. acetate solutions containing 15% acetonitrile were employed to. resulting in 5 fractions. All eluted fractions, including the flow-through. fraction,. were desalted by means of Cl8-StageTips. For the fractionation. of isoelectric. focusing, ZOOM IEF Fractionator. (Invitrogen) was used and. focusing buffer of pH 3.0 —pH 4.6, pH 4.6 —pH 5.4, pH 5.4 —pH 6.2, pH 6.2 —pH 7.0, pH 7.0 —pH 10.0 were employed to make 5 fractions according to the peptides. pl. All eluted fractions were. desalted by means of Cl8-StageTips.. 3.2.5. NanoLC-MS system. An LTQ-Orbitrap XL (Thermo Fisher Scientific, Bremen, Germany) or a QSTAR-XL(AB/MDS-Sciex, Toronto, Canada) with a nanoLC interface (Nikkyo Technos, Tokyo, Japan), Dion ex Ultimatesooo pump with. FLM-sooo flow manager. (Germering,. Analytics, Zwingen, Switzerland) was employed. Germany),. and HTC-PAL autosampler. for nanoLC-MS/MS measurement.. (CTC. A self-pulled. needle (150 mm length, 100 pin i.d., 6 pin opening) packed with ReproSil-Pur Cl8-AQ materials pin, Dr. Maisch, Ammerbuch,. Germany) was used as an analytical column of a particle-packed. 31. (3.
(40) column with "stone-arch". fritsi. The injection volume was 5 pL, and the flow rate was 500 nL/min.. The mobile phases consisted of (A) 0.5% acetic acid and (B) 0.5% acetic acid and 80% acetonitrile. two-step. A. linear gradient of 5 % to 40 % B in 70 min at a minimum, 40 % to 100 % B in 5 min, and. 100 % B for 10 min was employed throughout. this study. For the evaluation of gradient time, the. time in the first step of the linear gradient of 5 % to 40 % B was lengthened from 70 min (Figure 9). A spray voltage of 2,400 V was applied. The MS scan range was m/z 300-1,500 (LTQ-Orbitrap) or 350-1,400. (QSTAR). For LTQ-Orbitrap, the top ten precursor. orbitrap for subsequent. ions were selected. MS/MS scans by ion trap in the automated. in MS scan by. gain control (AGC) mode where. AGC values of 5.00e+05 and 1.00e+04 were set for full MS and MS/MS, respectively. The normalized CID was set to be 35.0. A lock mass function was used to obtain stable and accurate within 3 ppm. For QSTAR experiments, peaks,. and. subsequently. information-dependent scanned. precursor. MS scans were performed. three. MS/MS. scans. were. acquisition. function. was activated. ions. The CID energy was automatically. m/z values. for 1 s to select three intense. performed. for. 0.55. s. for 90 s to exclude the adjusted. each.. An. previously. by rolling CID function. Analyst QS 1.1. Figure 9 Optimization. of Gradient Time. The length of the gradient time was 100 evaluated 8ominimum. from 70 minutes. to increase identification. 6oefficiencies. co GIAll AYg 40. at a. The x = 70 min'r ----consisted. mobile. phases. of (A) 0.5% acetic. acid. and (B) 0.5% acetic acid and 80% 20. acetonitrile.. 0. A. two-step. linear. gradient of 5 % to 40 % B in 70 min 0. 10. 20. 30. 40. 50. 60. 70. Time (min). 85. which is variable, 40 % to 100 % B in 5 min, and 100 % B for 10 min was employed.. 32. of.
(41) 3.2.6. Data analysis and bioinformatics. The raw data files were analyzed by Mass Navigator vi.2 (Mitsui Knowledge Industry, Tokyo, Japan) to create peak lists on the basis of the recorded fragmentation spectra. In order to improve the quality of MS/MS spectra, Mass Navigator discarded all peaks with an absolute intensity of less than 10, and with an intensity of less than 0.1% of the most intense peak in MS/MS spectra, and an in-house Perl script called "mgf creator" converted the m/z values of the isotope peaks to the corresponding monoisotopic peaks when the isotope peaks were selected as the precursor ionss8. Peptides and proteins were identified by Mascot v2.2 (Matrix Science, London, U.K.)against the total. ORF amino. acids. sequences. of. E.. coll. K-l2. (BW2slls). from. GenoBase. (http://ecoli.naist.jp/GB6/search.jsp) with a precursor mass tolerance of 3 ppm (LTQ-Orbitrap)or 0.25 Da (QSTAR),and strict specificity allowing for up to 2 missed cleavages. For trypsin digestion, carbamidomethylation of cysteine was set as a fixed modification, and methionine oxidation was allowed as a variable modification. Peptides were rejected if the Mascot score was below the 95% confidence limit based on the "identity" score of each peptide, and a minimum of two peptides meeting the criteria was required for protein identification.. 33.
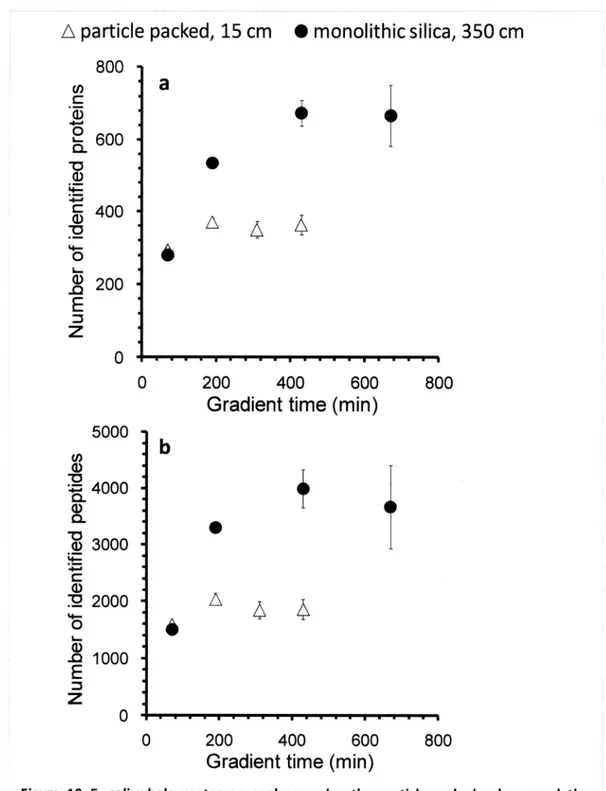
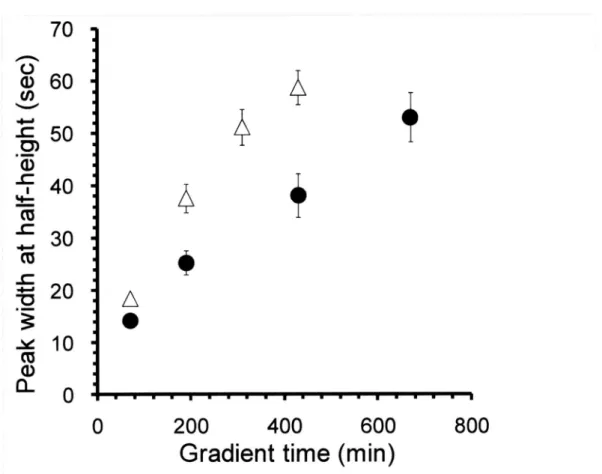
(42) 3.3. RESULTS AND DISCUSSION 3.3.1. The effects of the gradient time on the identification. efficiency.. To evaluate the effect of the gradient time on the identification efficiency, I first analyzed 1 µg of E. coll whole cell lysate in the lengthened. gradient time from 70 min with QSTAR-XL.Figure 10a,b. shows the number of identified proteins and peptides of triplicate LC-MS/MS analyses with 15 cm particle-packed. column (3 µm C18 beads, 100 µm I.D.) and 350 cm monolith silica column (100 µm. I.D.), respectively. As a result, both columns showed increased numbers of indentified peptides and proteins. with longer gradient time. For 15 cm particle-packed. column, the highest number. of. identified proteins was about 400 with more than 200 min gradient time analysis. On the other hand, for 350 cm monolith column, the highest number of identified proteins was about 700 with more than 400 min gradient. time analysis. To explore why the identification. numbers. were. increased with long monolith column, the peak widths at half height (W'n) of commonly identified 12 peptides of the analyses by the two columns were compared. were. obtained. identification. with long monolith. column. Maximum 2-fold sharper peaks. (Figure 11). Both columns. showed. the. highest. number at W'n of about 40 sec. This is because the sensitivity was decreased. with. wider NA/V2 more than 40 sec with QSTAR-XL,and the numbers of peptides ions which exceed the threshold for MS/MS were decreased. Therefore, the identification efficiencies were decreased with the wider wt/2 on QSTAR-XL. To more improve the identification efficiency, it was considered to use increased injection amounts to get more peak intensity and more sensitive MS instrument. which have higher scan speed. The. injection amounts of the E. coll sample were increased and analyzed by LTQ-Orbitrap XL(Figure 12). For the particle-packed. column, the numbers. of identified proteins. were increased with longer. gradient time and increased injection amounts. For the monolith column, the number of identified proteins was greatly increased with 2,470 min gradient time analysis using 414 injection amounts.. 34.
(43) A particle. packed,. 15 cm. • monolithic. silica 350 cm. 800 a. 0 c. a) •. Q6oo a) a)400. A. 45. L. 6. 4 200. E Z 0 0. 200. 400. 600. 800. Gradient time (min) 5000 co a). 4000 a) a a). 3000. a) 7. 45. 2000. a) sa 1000 E. Z 0 -------------------------------------0. 200400. 600. 800. Gradient time (min) Figure 10 E. coil whole. proteome. analyses. using the particle-packed. column. and the. monolith column (QSTAR-XL) The number of identified proteins (a) and peptides (b) of triplicate LC-MS/MS analyses with 15 cm particle-packed. column (open triangle, 3 pin C18 beads, 100 p.m I.D.) and 350 cm. monolith silica column (closed circle, 100 p.m I.D.) is shown.. 35.
(44) i. 70. w 60 co 50 cm. t. ... 40. 4. Co. -co 30 .3. 20. -. 10. co a) il. A •. 0 0. 200. 400. 600. 800. Gradient time (min) Figure 11 Relations between the peak width at half height (W14) and the gradient time Comparison. of the W14 of commonly. particle-packed. identified. 12 peptides. of the. analyses. column (open triangle) and monolith column (closed circle) is shown.. 36. by the.
(45) A particle-packed, 15 cm (1 µg) 0 monolithic silica, 350 cm (1 µg). A particle-packed,15 cm (2 µg) • monolithic silica,350 cm (4 µg). • particle-packed,15 cm (4 µg). 2500 co .5c. -t) 2000 ... a) F-. 1500. c a). 1000. 0. I-. a). 500. E. Z 0 0. 1000. 2000. 3000. Gradient time (min) Figure 12 E. coil whole proteome. analyses using the particle-packed. column and monolith. column (LTQ-Orbitrap XL) The number. of identified. proteins. by LC-MS/MS analyses with 15 cm particle-packed. column (triangles, 3 µm C18 beads, 100 µm I.D.) and 350 cm monolith silica column (circles, 100 µm I.D.) is shown. The injection amounts to the LC-MS/MS are indicated in parentheses. For 15 cm particle-packed. column, the numbers of identified proteins were increased with. longer gradient time and increased injection amounts. For 350 cm monolith silica column, the number of identified. proteins was greatly increased. analysis using 4 pg injection amounts.. 37. with 2,470 min gradient time.
(46) 3.3.2. The performance. of a single analysis and analyses of pre-fractionated. To evaluate the performance. samples.. of a single analysis and the analyses of pre-fractionated. samples, I. compared the triplicate LC-MS/MS analyses of E. coll whole cell lysate with 15 cm particle-packed column in 70 min gradient (System A, single particle-packed), and SCX with 15 cm particle-packed. merged 10 fractionated. samples of IEF. column (System B, MD-LC), and 350 cm monolith column in. 2,470 min gradient (System C, single monolith) (Figure 13). As shown in Table 5, using the 15 cm particle-packed. column, the merged number of identified proteins was about s-fold increased from. a single analysis if the pre-fractionation. approaches. were employed and repeated at least 3 times.. However, almost the same number of proteins was identified with a single analysis by the monolith column. and MD-LC analyses.. The identification. monolith column in terms of injection amounts. efficiency was extremely. improved. with the. (10 %) and total analytical time (11 hours less). compared to the MD-LC. The numbers of peptides were more identified with MD-LC though, that numbers were not contributed. to the number of identified proteins. To investigate the differences. in identified proteins of MD-LC and single monolith analyses, the proteome the correspondence. transcriptome. data were compared to. data analyzed by microarray6l. Figure 14 shows the proteome. coverage to the correspondence. expressed genes according to the mRNA expression level. There. was a bias on the identification. of highly expressed. proteins, and lower expressed. proteins were. hardly identified especially by the single analysis with particle-packed column. The lower expressed proteins were more identified by the single analysis with monolith column and highly expressed proteins. were more identified with MD-LC. For MD-LC approach,. peptides. especially derived from the lower expressed. identified peptides was not contributed. there. were not many new. proteins, thus the increased. number. to the number of identified proteins. The approach. of. using. the monolith column seems to be effective to reduce the problem of dynamic range by identifying the lower expressed proteins.. 38.
(47) Tryptic Digests. of E. coll. Whole Cell Lysate (PTS). 46 µg. 4 µg. 4 µg. 1_w. SCX. IEF. 1. 15 cm particle-. 15 cm particle-. packed. packed. column. column. 350 cm monolith silica column. LC-MS/MSTriplicate Analysis (LTQ-Orbitrap XL). Figure 13 Flowchart of E. coll whole proteome. analysis. Flowchart of the triplicate LC-MS/MS analyses of E. coll whole cell lysate is shown. System A is the LC-MS/MS analyses with 15 cm particle-packed particle-packed). 70 min gradient. column in 70 min gradient (single. System B is the LC-MS/MS analyses with 15 cm particle-packed of 10 fractionated. samples. column in. of IEF and SCX (MD-LC). System C is the. LC-MS/MS analyses with 350 cm monolith column in 2,470 min gradient (single monolith).. 39.
(48) Table 5 Impact of the single analysts'. Approach. System A (Single). System B (MD-LC). System C (Single). Column Type. lscm. lscm. 350 cm Monolith. particle-packed. particle-packed. Single Gradient Time (min). 70. 70. Total Analytical Time (min). 110. 3,300. 4. 46. Total Injection Amounts (µg) No. of identified Proteins. 591. ±. 24. 1,930. No. of identified Peptides. 3,715. ±. 77. 18,989. 2,470 2,600 4 1,925 15,993. ± ±. 59 560. ° The number of identified proteins and peptides by the triplicate LC-MS/MS analyses of system A , B, C (Figure 13) are shown. Analytical parameters. such as column type, single gradient time, total. analytical time and total injection amounts are also shown. Almost same number of proteins was identified with system C (single monolith) with 10% of injection amounts and 11 hours less total analytical time than that of system B (MD-LC).. 40.
(49) ^ Single C18 packed. column. •. • Single monolith. MD-LC. column. 100. VI 90 a ) c a). -a80 a) V) V) a). a x. 70. a) a). c. a). 60. C 0o - 50 V) V) al 0. w 40 O0. y 30 t 0 ^20 O o n I°_ a) > •10 u a. -1 .2. -1. -0.8. -0.6 -0.4. -0.2. 0. 0.2. 0.4. 0.6. 0.8. 1. 1.2. 1.4. 1.6. 1.8. mRNAexpression level (LogiomRNA signal intensity) Figure 14 Comparison of the analyzed proteome to the correspondence transcriptome6l The proteome. coverage to the correspondence. expressed genes. using single. particle-packed column, MD-LCand single monolith column are indicated by white, gray and black bars, respectively. The lower expressed proteins were more identified with the single analysis by the monolith column than by MD-LC.. 41.
(50) 3.3.3. The impact on the dynamic range problems. To examine. how much the. dynamic. range problem. existing, I compared. the. peak areas. of. commonly identified 1,458 peptides between the particle-packed column and the monolith column. Figure Isa shows the peak areas of the analyses by 70 min gradient time using the particle-packed column. and by 2,470 min gradient time using the monolith. column with the same injection. amounts.. The peptide areas were s-fold increased on average in the monolith column. A typical. example. is shown in Figure 15b,c. The peak area in the extracted. obtained. from the monolithic. particle-packed. column. was approximately. 2o-fold larger than that. column, suggesting that better chromatographic. peak suppression.. Figure 16 shows the. identified. and peptides.. proteins. ion current chromatogram. separation. base peak chromatograms. resulted. from the in reduced. (BPC) and the number. of. Although the MS signal intensity in BPC of the analysis with. monolith column (70 min gradient) was increased compared. to that with particle-packed. column. (70 min gradient), the numbers of identified proteins and peptides were similar. And the separation patterns. of BPC also look similar between the analyses of two columns. However, 17,872 peptides. and 1,991 proteins. were identified by 2,470 min gradient time using monolith column, and the. separation. of BPC looks remarkably. pattern. improved compared. to that of the particle-packed. column. This is because much space for the complex sample was needed for the comprehensive identification. of proteins. Although the separation. efficiencies were improved with the monolith. silica column, there were still peptides eluting together proteomics numbers considered. samples. Then, the limited numbers of MS/MS. To reduce important. the problem. because of the high complexity in shotgun. of peptides of dynamic. to develop pre-fractionation. were identified due to the limited range in the. approaches.. samples,. it has been. However, the key to reduce the. dynamic range problem is actually in the step of the LC separation. One of the effective approaches to identify the complete. proteome. in complex samples is to use the good column which exhibit. 42.
(51) sharp. peaks. and. also. spare. much. time. for the. enormous. number. of eluting. peptides.. b. a 6.E+07. .gr. 4.E+07. m4.E+08. 2.E+07. E 0.E+00 0. NNi. 39. cl N U. 47 55 Time (min). 6.E+07. w.g 2.E+08 s. 4.E+07 2.E+07 0.E+00. co Y CO CO a 0 .E+00. 400. 0.E+00 2.E+084.E+08 Peak area (particle-packed, 70 min gradient) Figure 15 Impacts. on the. dynamic. range. problems. of the. analysis by the monolith column. C. time). 4.E+07. 0.E+00. and with the. 110 118 126 Time (min). particle-packed. column (horizontal, 70 min gradient time) are compared.. 6.E+07. (b) XIC chromatogram. 4.E+07. (upper. panel) and. MS spectrum. (bottom panel) of a doubly charged peptide of m/z 618.28,. 2.E+07. EGQNLDFVGGAE,from 50S ribosomal subunit protein L23. 0.E+00. (JWs28o). The 15 cm long particle-packed column was used. The MS spectrum chromatogram.. was collected at the peak top in the XIC. Other conditions are described in Figure 2.. (c) XIC chromatogram. I. 6.E+07. the analyses with the monolith column (vertical,. 2,470 min gradient. 800. 2.E+07. (a) The peak areas of commonly identified 1,458 peptides between. 600 m/z. (upper. panel) and. MS spectrum. (bottom panel) of the same peptide as in (b). The 350 cm long monolithic silica column was used.. 43. 400. 600 mh. 800.
(52) 0h. co. a 3,657. peptides. 15 cm. (571 proteins). (beads). +. N C NC _ U) M. coco. 0 0. 20. 30. 40. 5060. 70. 80. 90. Time (min). m 0. b 2,368. peptides. (496 proteins). 350. :m (monolith. a). N C a) C _ L7. m 0 aa,. jI \1„L tk(iitio liolioiit lklAIo. 0. a, m. 0. 130. 140. 150. 160. 170. 180. Time (min). c. 16,635. peptides. 350 cm. (1,991 proteins). (monolith). co 0. .y. N. 8) co 0 +. 0. 0. 50010001500. 2000. Time (min) Figure 16 Total ion current of analyses of particle-packed. column and monolith column.. The total ion currents of the analyses with particle-packed. column (a: 70 min gradient) and. monolith column (b: 70 min gradient, c: 2,470 min gradient) using 4 p.g injection amounts are shown. The number of identified proteins and peptides are also shown.. 44.
(53) 3.3.4. E. coil membrane. proteome. To explore E. coll membrane. analysis with monolith silica column.. proteome. analysis, the results of 11 LC-MS/MS analyses of E. coll. whole cell lysate using the monolith column were merged. Table 6 shows the number of identified proteins,. membrane. successfully identified number. detector. and correspondence. 2,880 proteins. of correspondence. considered manner. proteins. expressed. and 931 membrane. of expressed. membrane-enriched. fractions,. membrane-enriched. fractions. studies and proteomics. E. coll membrane although toward. the. and proteome. are. speed from mRNAs to proteins, and the difference. the. previous. proteome. proteomels'. 62.Moreover,. was achieved even not with the. E. coll membrane. identification. in the. studies). These numbers of identified. proteins are the largest among published studies on the E. coll membrane the complete. exceeded. because of the difference in the biological and technical. (i.e., variation in the translation. in our approach,. genes. As a result,. proteins. The numbers. genes. This is because transcriptome. not to be perfect matched. used in the transcriptome. number. of membrane. proteome proteins.. reports. used. The complete. expressed proteome was achieved by this system using monolith column.. Table 6 Profile of E. coil transcriptome Approach. Total No. of Identified No. of Membrane. Proteins. Proteins. and proteomea. Transcriptome. This System (11 times). 2,543. 2,880. 919. 931. ° The E. coll whole cell lysates were analyzed 11 times by nanoLC-MS/MS using monolith column (LTQ-Orbitrap). The transcriptome. data was from the reference 61.. 45. I.
(54) 3.4. CONCLUSIONS I showed. that the. identification proteome.. new approach. by the analyses with the monolith. efficiency and achieved complete. The monolith column showed. particle-packed. identification. column facilitated. of E. coll proteome. improved separation. and membrane. efficiency in comparison. column. This approach was more efficient to the pre-fractionation. the. to the. approaches. in. terms of the total injection amounts and total analytical time. Moreover, complete identification of membrane. proteome. was achieved even not with the E. coll membrane-enriched. novel to use this approach. for the comprehensive. analysis of E. coll proteome,. fractions.. It is. and achieve the. complete identification of E. coll expressed proteome. Further application will be considered for the more complex organisms complete proteome. such as human. in more complicated. and plants.. It would be very promising to identify. samples with remarkably short time LC—MS/MS analyses. using this approach.. 46.
Gambar
+7
Dokumen terkait
The second and less direct reason for estimating the probit model is in order to correct the human capital-based wage equations for sample selection bias. 1 is estimated on a
Dalam bidang eksplorasi minyak Bumi dengan teknologi yang tersedia saat ini, insinyur dapat melakukan pengeboran hingga kedalaman 15 km dari permukaan Bumi.. Bila diketahui
Charoen Pokphand Jaya Farm Purworejo adalah dapat menambah pengalaman dalam bekerja teknis pada ayam pembibit dan dapat mengetahui Manajemen Sumber Daya Manusia
Sehubungan dengan fase-fase tersebut diatas,penelitian ini akan lebih diarahkan pada fase pengembangan dimana obyek penelitian adalah beberapa KPH yang sudah
Untuk membuat animasi yang dapat bergerak berputar sambil membesar atau mengecil, Anda dapat mengisikan nilai Scale dan Rotate secara bersamaan pada jendela Scale and
‘perlakuan orang tua terhadap anak akan mempengaruhi sikap anak dan perilakunya. Sikap orang tua sangat menentukan hubungan keluarga sebab sekali hubungan
Angket yang dimaksudkan pada penelitian ini adalah pernyataan- pernyataan yang ditujukan untuk mengetahui respon dari responden tentang penggunaan multimedia
Pemerintah Kecamatan sebagai salah satu Satuan Kerja Perangkat Daerah ( SKPD) dilingkungan pemerintah Kota Semarang sesuai dengan Perda No 54 Tahun 2008 tentang
