www.elsevier.nlrlocatereconbase
Disability and the labour market: an analysis of
British males
Michael P. Kidd
a, Peter J. Sloane
a,), Ivan Ferko
ba
Department of Economics, UniÕersity of Aberdeen, Edward Wright Building, Dunbar Street,
Aberdeen AB24 3QY, UK
b
UniÕersity of Tasmania, Australia
Received 8 June 1999; received in revised form 10 February 2000; accepted 3 March 2000
Abstract
This paper attempts, using data from the British Labour Force Survey 1996, to examine to what extent differences in labour market outcomes between able-bodied and disabled men may be attributed to differences in endowments of human capital and associated productivity differences. Both labour force participation and selectivity corrected human capital equations are estimated and decomposition techniques applied to them. Using the
w
methodology of Baldwin and Johnson Baldwin, M., Johnson, W.G., 1994. Labor market
Ž .
discrimination against men with disabilities. Journal of Human Resources, XXIX 1 ,
x
Winter, 1–19 , the employment effects of wage discrimination against the disabled are also estimated. Evidence of both substantial wage and participation rate differences between able-bodied and disabled men are found, which have implications for the operation of the 1995 Disability Discrimination Act.q2000 Elsevier Science B.V. All rights reserved.
JEL classification: I1; J2; J3
Keywords: Disability; Labour force participation; Wage discrimination
)Corresponding author. Tel.:q44-1224-2721-66; fax:q44-1224-2721-81.
Ž .
E-mail address: [email protected] P.J. Sloane .
0167-6296r00r$ - see front matterq2000 Elsevier Science B.V. All rights reserved.
Ž .
1. Introduction
In November 1995, the UK government passed the Discrimination Disability Act with those provisions relating to employment to come into effect at the end of 1996. The Act defines a disability as a physical or mental impairment which has a
Ž .
substantial and long-term greater than 12 months adverse effect on the ability to carry out day-to-day activities. Protection is provided against discrimination in recruitment, employment, dismissal and the like for a reason which relates to disability. The Act imposes an obligation upon employers to make certain adjustments to their premises and the way in which they operate in order to accommodate disabled employees. A failure to comply with these requirements is itself an act of unlawful discrimination unless it can be justified by a reason which is both material to the circumstances of the case and substantial, along the lines of the US and Australian legislation.1 The new legislation replaces the Disabled
Ž .
Persons Employment Act introduced in 1944 which imposed a statutory quota obligation on employers with 20 or more workers to employ and retain registered
Ž .
disabled persons as a fixed proportion of their workforce generally 3% . Further, there was a reserved occupation scheme covering lift and car park attendants which favoured disabled workers. The absence of provision for the imposition of fines on enterprises failing to meet the quota2 was perhaps the major reason why the British legislation was generally regarded as ineffective.
The legislative intervention as outlined above has focused interest on the labour market experiences of the disabled. The current paper examines the relative labour market outcomes of the disabled vis a vis the able-bodied prior to the introduction or effective implementation of the 1995 legislation. This analysis provides a useful benchmark against which one may judge the potential impact of the Disability Act. There is a rich tapestry of empirical studies examining both gender and racial discrimination, but there are few studies of discrimination against the disabled and virtually all of these are restricted to North America.3 Such studies in Britain is
Ž .
surprising given the fact that Cousins et al. 1998 estimate around 14% of
1
Defences include the extent of the employer’s financial and other resources, the costs of making the adjustments and the extent to which other activities would be disrupted. In its guidance on the
Ž .
definition of discrimination, the Department for Education and Employment 1996 notes that to be considered substantial attention should be paid to the time taken to carry out an activity and the way in which an activity is carried out.
2
The UK quota and reserved employment provisions were withdrawn with the passing of the 1995 Disability Discrimination Act.
3 Ž .
working age in the UK had a long-term disability in the Autumn of 1997,4 compared to around 5% who belong to a minority ethnic group. For the above reasons an investigation of the labour market experience of British workers seems timely.
Ž
Data from various sources including Labour Market Trends December 1997
.
and June 1998 reveal that the employment participation rate of able-bodied working age males is around twice that of the disabled group, i.e. 83% vs. 40%.
Ž .
Similarly, the unemployment rate using the ILO definition is approximately three times higher for the disabled, i.e. 21.2% vs. 7.6%. Finally, Labour Force Survey data suggest that on average, disabled males earn substantially lower hourly wages than the able-bodied, of the order of 10% less. Thus, crude comparisons suggest substantial differences in labour market outcomes for the two groups and thus a priori a potential role for legislation.
One must also consider the possibility of reverse causation. More specifically those with low education are more likely to obtain manual jobs in which there may be a higher probability of work-related disability than in non-manual jobs. Cater
Ž .
and Smith 1999 , using Ontario data, find that the disabling effects of a given impairment are less severe in white-collar jobs which are less physically demand-ing. They also interpret their results as showing that education and experience increase workers’ ability to compensate for and adapt to physical impairments. Health and Safety Executive data drawn from the 1995r96 Labour Force Survey
ŽHSE 1999 suggest that for Britain too those in manual occupations are more.
likely to suffer serious injuries than those in non-manual occupations. Further manual workers who account for 42% of the workforce account for no less than 72% of reportable injuries. Thus, manual workers are more affected not only because they have a higher incidence of injury but also because there is a greater probability that any injury will impede their ability to work. The question is to what extent is work-related illness or injury likely to result in a disability as defined above? About 4.8% of all adults who have ever worked in Britain, or roughly two million individuals, have suffered a work-related injury or illness, but over 50% of those affected who were economically active in the previous year and who suffered some illness in that year did not take time off work and of those absent from work only a very small percentage were off work for more than 260 days. Therefore, the impact of reverse causation on our results is unlikely to be substantial.
4
Definitional problems mean that we should be careful in making comparisons of the number of disabled persons, particularly across countries. In the US, estimates at various times have ranged
Ž .
between 7% and 11% Haveman and Wolfe, 1990 . In Canada, 15.5% of the population was reported
Ž .
to have some level of disability Raskin, 1994 and in Australia, a 1988 Bureau of Statistics study found that 15.6% of the population suffered from some form of disability and for 13% of the
Ž .
The main aim of the current paper is to examine to what extent differences in labour market outcomes for the two groups may be attributed to differences in human capital investment and associated productivity differences. The second and fourth quarters of the 1996 Labour Force Survey are used to estimate labour force participation equations and Mincer human capital earnings equations allowing for
5 Ž .
sample selectivity. The traditional Blinder 1973 method is used to decompose the overall difference in mean log wages between the able-bodied and disabled groups into explained and unexplained components. The former represents that part of the wage difference attributable to productivity-related characteristics, and the latter is the residual difference often interpreted as indicative of discrimination.
Ž .
A variant of the Blinder technique, suggested by Even and Macpherson 1990 provides an analogous decomposition of the overall difference in participation rates between the two groups. Together, the decompositions allow one to control for the role of productivity related characteristics in the pattern of wages and employment participation. Examining both labour market outcomes is important as the combined influence of wage and employment discrimination may have a substantial influence on the overall welfare of the disabled. In an early US study,
Ž .
Luft 1975 reports that an average disabled man suffers a 37% reduction in annual earnings via the combined effects of reduced labour force participation, fewer hours worked per week and lower hourly earnings.
The current paper adopts the methodology recently suggested by Baldwin and
Ž .
Johnson 1994 enabling one to examine the sensitivity of the disabled employ-ment participation rate to the presence of wage discrimination. Thus, the final issue addressed is if wage discrimination against the disabled is found to exist, what impact does this have upon the employment rate? Explicitly modelling the link between discrimination and participation allows one to evaluate whether a role for discrimination legislation exists, and the likely impact of the Disability Act.
Ž .
As Baldwin and Johnson 1994 note, unlike minority groups afforded protec-tion under the law, all persons with disabilities have health problems which limit their productivity in some types of work. However, the effects of such limitations are difficult to unravel as they depend partly at least on the particular tasks
Ž .
required in various jobs. Thus, as Baldwin et al. 1994 remark, a blind person might find it problematic to operate a crane, but might have few disadvantages as a telephone operator. Identifying those with a disability is, therefore, a far from straightforward exercise.
5
2. Definition of disability
Any study of disability faces problems in defining those in the sample who have a ‘disability’, since it is not a clearly defined condition. A number of studies have drawn upon the distinction made by the World Health Organisation between disability, impairment and handicap, whereby:
impairment is defined as a psychological, anatomical or mental loss, or other
Ž
abnormality e.g. blindness, mental retardedness, loss of hearing, diabetes, heart disease, asthma, colour blindness, difficulty in lifting heavy objects or
.
climbing stairs ;
Ž .
disability is any restriction on or lack of ability resulting from an impairment
Ž .
to perform an activity e.g. work in the manner or within the range considered normal;6
handicap is a disadvantage resulting from an impairment or disability.7
Ž .
Baldwin and Johnson 1994 use these impairment categories to split the 1984 panel of the US Survey of Income and Programme Participation into three
Ž
categories based on Tringo’s 1970 Scale an attitude study towards those with
. Ž .
impairments . There are those with no impairments non-disabled ; those with
Ž .
impairments that are subject to little or no prejudice disabled ; and those with
Ž .
impairments that are subject to greater prejudice handicapped . This however, pre-supposes that we can classify individuals as disabled or non-disabled.
Have-Ž .
man and Wolfe 1990 use two criteria to identify the ‘disabled’ population — the presence of self-reported limitations andror the meeting of official disability-de-termined standards, as reflected in the receipt of public disability transfer pay-ments. This in itself takes no account of the severity of a disability and may be susceptible to bias. Thus, some impairments such as alcohol and drug abuse are difficult to detect without physical examination and differences in employers’ awareness of different impairments may bias the results of empirical studies.
A number of authors have stressed the importance of using multiple measures
Ž .
of disabilities. Thus, Loprest et al. 1995 distinguished between work limitations, functional limitations and specific health impairments. The problem with work limitation measures is that they are endogenous, since the extent to which any condition or impairment is disabling depends on the type of activity under review.
Ž .
For such reasons, Oi and Andrews 1992 advocated the use of health-related impairments, noting that disablement may affect the work–leisure choice in three
6
Note that an impairment may not necessarily result in a disability. This will depend upon the activities in which the individual in question intends to engage.
7
distinct ways — the effect on individual preferences and hence the demand for leisure; the effect on productivity and the effect on the time available for work and
Ž .
leisure. As Lambrinos 1991 notes, the taste for work or leisure effect is indeterminate since work will be more burdensome for the disabled but there will also be fewer leisure choices, so that the effects on the marginal utility of income
Ž
from work and of leisure will both be negative. The time constraint e.g. the fact that many of the disabled can only work part-time and the longer time it takes
.
them to get to and from work will cause reductions in both work and leisure. The Labour Force Survey data used in the current analysis indicate whether an individual has health problems or a disability which limits the kind of paid work they can do. A follow up question asks whether the health problem has lasted or is expected to last more than 12 months.8 The definition of the disabled sample in
the current analysis is the set of individuals with long-term health problems. This definition is in keeping with the spirit of the Disability Act.9 An individual is
Ž .
disabled according to S.1 1 of the DDA if he or she has an impairment which has
Ž .
substantial affects and is long-term over 12 months . These effects must have long-term adverse consequences on normal day-to-day activities. That is they must affect one of the following — mobility, manual dexterity, physical co-ordination, continence, ability to liftrcarryrmove everyday objects, speech, hearing or eye-sight, memoryrability to concentraterlearnrunderstand, or the perception of the risk of physical danger.
The LFS data also enable one to identify specific types of health problem, but unfortunately, this information is restricted to the disabled sample only. We are able to distinguish 15 categories of disability. For estimation purposes, these are aggregated to five health problem categories — relating to limbs; sight and hearing; skin, breathing, heart and other organs; mental and related, and other. This information at least allows some analysis of the influence of type of disability on work and employment patterns.
The data in this paper are limited to males aged 16 to 64, excluding Northern Ireland and observations with missing key variables, drawn from the second and fourth quarters of the 1996 LFS, which have been pooled to increase sample size.10 This period is sufficiently close to the implementation date of the Disability
8 Ž .
Sly 1996 notes that there are strong inter-regional variations in the proportion of the disabled, varying from 9% in the South–East to 17% in Wales. Likewise in the case of age only 6% of those aged 16–34 are disabled, compared to 24% in the case of those aged between 50 and retirement age.
9
There was a further change in Spring 1997 to reflect the provisions of the 1995 Disability Discrimination Act. The wording of the questions now distinguish between the kind and amount of paid work. This simple change identifies 24% fewer disabled people, but a greater proportion of these
Ž .
are economically inactive, see Jenkins, 1997 . This means that the disability question in the LFS is not consistent over time.
10
Discrimination Act that it might reasonably be interpreted as being prior to the effective implementation of the legislation. The results will provide a base against which future researchers can compare the impact of the legislation.
3. Econometric model
The focus of the current paper is to examine how the disabled as a group fare in the labour market relative to the able-bodied. As discussed earlier, the raw figures point towards the disabled experiencing a lower participation rate combined with a lower average wage. In order to shed additional light on the reasons underlying the difference between the able-bodied and disabled, the paper explicitly models the labour force participation decision, together with a human capital-based model of earnings determination.
3.1. Wage structure and labour force participation
Following the traditional model of labour force participation, we assume an individual’s participation decision is based upon a comparison of the offer wage with his or her reservation wage.11 The individual will participate if the offer wage
exceeds the reservation wage. The reservation wage, defined as the wage at which the individual is just indifferent between working and not working, is not directly observable for any individual. To examine the relationship between offer,
reserva-Ž .
tion and observed wage all assumed to be in logarithmic form , we begin with the specification of the human capital-based wage offer equation, which may be written as:
W0sb X qn
Ž
jsD, A.
Ž .
1i j j i j i j
where Xi j is a vector of productivity related characteristics and bj the associated rates of return. D and A stand for disabled and able bodied respectively. The reservation wage is determined as follows:
WRsaZ q´
Ž
jsD, A.
Ž .
2i j j i j i j
where the vector Z incorporates human capital variables as well as factors
Ž
influencing the value of time e.g. presence of children and level of exogenous
.
income . Although the reservation wage is not directly observable, we do observe the outcome of the individual’s labour force participation decision. Hence, a
11 Ž .
dummy variable representing whether or not an individual is employed, may be defined:
Is1, if W0)WRand i j i j
Is0, otherwise.
Thus, the probability that individual i works is:
0 R
Prob i works
Ž
.
sPrŽ
Wi jyWi j.
)0 sPrŽ
bjXi jyajZi j.
)´i jyni j .Ž
Assuming thatni j and ´i j are normally distributed, the composite error ui js ´i j
. 2
yni j is also normally distributed with variance su j. Thus, the probability individual i works may be rewritten as:
ui j
Ž
bjXi jyajZi j.
gjYi jProb i works
Ž
.
sPr - sFž /
su j su j su jwhereF is the cumulative normal density function,gj is the combined vector of parameters bj and aj, and Yi j is the associated combined vector of Xi j and Z .i j
It follows that the labour force participation decision may be modelled via a probit specification:
gj gj
Ls
Ł
Fž
Yi j/
Ł
1yFž
Yi j/
jsA, DŽ .
3s s
i´E u j i´E u j
where E represents the set of individuals who work, and E those who do not work.
Estimation of the probit model serves two distinct purposes. First, using the
Ž .
method suggested by Even and McPherson 1990, 1991 , it enables the difference between the average participation rate for the two groups to be decomposed into that attributable to differences in human capital related characteristics, Y, i.e. the explained component and a residual or unexplained component.
This is derived as follows:
ˆ
ˆ
PayPdsEXPqUNEXP
Denoting sample size for the able-bodied as n and that of the disabled as n :a d
nd nd
ˆ
ˆ
UNEXPs
Ž
1rnd.
Ý
FŽ
Zidba.
yŽ
1rnd.
Ý
FŽ
Zidbd.
Ž .
4is1 is1
and:
na nd
ˆ
ˆ
EXPs
Ž
1rna.
Ý
FŽ
Ziaba.
yŽ
1rnd.
Ý
FŽ
Zidba.
Ž .
5is1 is1
the fraction of EXP due to the jth explanatory variable is:
The advantage of this method is that it allows one to control for able-bodiedrdisabled differences in education, experience, location, marital status, race and level of exogenous income, all representing factors likely to be correlated with the tendency to participate. However, given the possibility of omitted variables, in particular the extent and severity of the disability in the current setting, the usual caveat applies in interpreting the residual component. The unexplained component is likely to reflect the role of uncaptured differences in tastes and productivity in addition to the possibility of employment discrimination.
The second and less direct reason for estimating the probit model is in order to correct the human capital-based wage equations for sample selection bias. The
Ž .
wage Eq. 1 is estimated on a sample restricted to individuals employed in the wage and salary sector. The theoretical model, describing whether or not an individual participates, suggests that this sample will be non-randomly selected. As is well known, this situation implies that the application of ordinary least squares will lead to biased and inconsistent estimates. At an intuitive level, correction for non-randomness is of potential importance since interest centres on the log wage differential between able-bodied and the disabled for the population rather than the sub-sample observed to be working. For example, if wage discrimination is rife amongst the disabled and those experiencing significant discrimination withdraw from the labour force, observed wage discrimination will be significantly under-estimated. The Heckman two-stage procedure is adopted with the probit model estimates being used to create the selectivity variable,l. In the second stage, l is included as an additional regressor in the wage equation which is estimated by OLS. Consequently, the sample selection corrected wage equation may be written as follows:
sÕu j
0<
E W
Ž
i j Is1.
sbjXi jq li j jsA, DŽ .
7su j
where W is the log of the hourly wage rate of worker i, Xi i is a vector of variables which affect productivity, li is the sample selection term.
In estimating the sign of the discriminatory wage differential which may exist between disabled and able-bodied workers, we follow earlier studies by Johnson
Ž . Ž .
and Lambrinos 1985 and Baldwin and Johnson 1994 in using the technique
Ž .
developed by Reimers 1983 . The difference in offer wages between able-bodied
Ž .a and disabled workers d can be decomposed in the following manner:Ž .
ˆ
ˆ
WayWdy
Ž
calaycdld. Ž
s XayXd.
VbaqŽ
1yV.
bdˆ
ˆ
q X 1a
Ž
yV.
yXdVž
baybd/
Ž .
8Ž .
productivity, while the second term represents that part of the wage differential which remains unexplained and is commonly interpreted as the level of discrimi-nation. As always, if certain variables are omitted or are subject to measurement error, the estimated coefficients, and hence our measure of ‘discrimination’, will be biased.
V is a vector with elements ranging from 0 to 1 representing the relationship
Ž
between the observed wage structure and the non-discriminatory norm see Cotton,
. Ž .
1988; Oaxaca and Ransom, 1994 . We follow Baldwin and Johnson 1994 in setting Vs1.0, implying that the non-discriminatory norm is the observed wage structure of the non-disabled. Given that the disabled are a relatively small fraction of the total number of workers employed, this seems a reasonable approach.12
The standard variables used in earnings equations to capture productivity include education, experience, both general and firm-specific, i.e. tenure, marital status, occupation, industry and region. The use of potential experience has the disadvantage that the disabled may experience periods outside employment due to their disability, thereby overstating the actual level of experience of this group.
The series of studies conducted by Johnson and associates also include various measures of health limitations, derived from the factor analysis procedure
de-Ž .
scribed in Lambrinos 1991 . Health is included since it is a factor which affects
Ž .
worker productivity regardless of the disability status of the individual worker . The health variable is an index of health status that incorporates the number of
Ž
impairments and their severity measured by the extent of their functional
limita-.
tions . Unfortunately, this option is not available in the current study since information pertaining to major type of health problem is only available for the disabled. We attempt to capture these effects by the inclusion of two dummy variables capturing the presence and length of any period of sickness. In addition, we estimate a specification of the participation and wage equations which includes type of main health problems in the disabled sample.
Earlier studies have typically found evidence of wage discrimination against the
Ž .
disabled. Thus, Johnson and Lambrinos 1985 , using the 1972 US Social Security Survey of Disabled and Non-Disabled Adults, suggest that discrimination accounts for one-third of the offer wage differential between non-handicapped and handi-capped men. These results seem to be strongly influenced by selectivity bias.
Ž .
Baldwin and Johnson 1994 , analysing 1984 data, distinguished between handi-capped and disabled workers, as outlined above and found that the offer wage differential between non-disabled and handicapped men was 33.2% of the mean non-disabled offer wage. Differences in personal and job characteristics account for 18.5% points of this differential, leaving 14.7 percentage points attributed to
12
Ž .
‘discrimination’. Baldwin et al. 1994 report that wage offers for workers with impediments range from 74% to 101% of the benchmark wage offer for unim-paired workers depending on the nature of the impairment. One study for Canada,
Ž .
Harkness 1995 found in contrast to the above that there was no evidence of wage discrimination against disabled individuals.13
4. Results
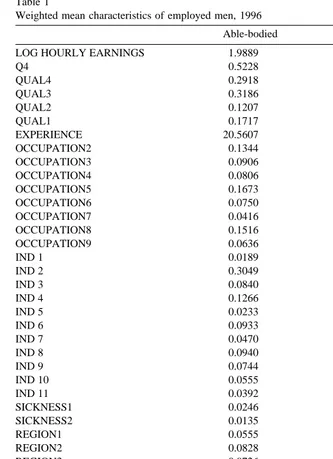
Table 1 provides summary statistics for all the major variables used in the empirical analysis. The first point to note is that the weighed average hourly log wage is 1.99 for the able-bodied relative to 1.85 for the disabled. This translates into a wage premium for the able-bodied of approximately 14%. The employment participation rate varies widely between the two groups, with 83.9% for the able-bodied relative to 34.3% for the disabled.14
The disabled are more likely to be absent from work due to sickness and length of absence is likely to be longer in their case. The able-bodied on average have higher educational qualifications than the disabled, but shorter labour market experience and slightly lower tenure with the current employer, reflecting the association of disability with age. The disabled are under-represented relative to the able-bodied in the high paying managerial and professional occupations and over-represented in manual occupations, which is one explanation for their lower mean pay levels. They are also over-represented in manufacturing, but under-rep-resented in Scotland in our sample. In line with expectations the disabled are more likely to be employed part-time than able-bodied men.
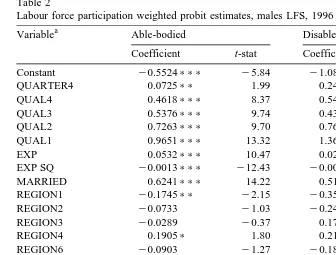
The labour force participation probit estimates are provided in Table 2. A joint test of all slope coefficients being equal to zero is resoundingly rejected for both samples. The prediction success rate is relatively high, with 98.2% of able-bodied correctly predicted to be participants, but only 23.3% to be non-participants. The corresponding figures for the disabled are 68.0% and 86.5%, respectively. For both able-bodied and the disabled, education increases the probability of being in employment compared to those without formal qualifications, as does being married or white. There are regional differences in participation rates. Compared to London and the South–East participation is significantly lower for both groups in the North, North–West, Wales and Scotland, and for the disabled only in
13
Many of these studies have examined gender differences in the disabled’s labour market perfor-mance and found these to be significant. However, since we concentrate on males, we do not discuss this issue in the current paper.
14
Table 1
Weighted mean characteristics of employed men, 1996
Able-bodied Disabled
LOG HOURLY EARNINGS 1.9889 1.8457
Q4 0.5228 0.5928
QUAL4 0.2918 0.3107
QUAL3 0.3186 0.2833
QUAL2 0.1207 0.0857
QUAL1 0.1717 0.1315
EXPERIENCE 20.5607 25.7180
OCCUPATION2 0.1344 0.1061
OCCUPATION3 0.0906 0.0896
OCCUPATION4 0.0806 0.1020
OCCUPATION5 0.1673 0.1725
OCCUPATION6 0.0750 0.0704
OCCUPATION7 0.0416 0.0433
OCCUPATION8 0.1516 0.1938
OCCUPATION9 0.0636 0.0847
IND 1 0.0189 0.0176
IND 2 0.3049 0.3474
IND 3 0.0840 0.0712
IND 4 0.1266 0.1082
IND 5 0.0233 0.0242
IND 6 0.0933 0.0873
IND 7 0.0470 0.0240
IND 8 0.0940 0.0859
IND 9 0.0744 0.0730
IND 10 0.0555 0.0716
IND 11 0.0392 0.0419
SICKNESS1 0.0246 0.0349
SICKNESS2 0.0135 0.0754
REGION1 0.0555 0.0560
REGION2 0.0828 0.0931
REGION3 0.0726 0.0868
REGION4 0.0436 0.0406
REGION6 0.0845 0.0811
REGION7 0.0966 0.1100
REGION8 0.1075 0.1378
REGION9 0.0472 0.0403
REGION10 0.0902 0.0590
FIRMSIZE-20 0.2244 0.2226
COLOUR 0.9620 0.9731
PUBLIC SECTOR 0.2227 0.2281
PART-TIME 0.0430 0.0874
TENURE 9.0419 9.4231
MARRIED 0.6337 0.6525
Table 2
Labour force participation weighted probit estimates, males LFS, 1996 a
Variable Able-bodied Disabled
Coefficient t-stat Coefficient t-stat
Constant y0.5524))) y5.84 y1.0828))) y4.62
QUARTER4 0.0725)) 1.99 0.2444))) 3.39
QUAL4 0.4618))) 8.37 0.5449))) 5.63
QUAL3 0.5376))) 9.74 0.4325))) 4.60
QUAL2 0.7263))) 9.70 0.7601))) 4.88
QUAL1 0.9651))) 13.32 1.3647))) 8.31
EXP 0.0532))) 10.47 0.0207) 1.83
EXP SQ y0.0013))) y12.43 y0.0006))) y3.10
MARRIED 0.6241))) 14.22 0.5122))) 6.27
REGION1 y0.1745)) y2.15 y0.3504)) y2.25
REGION2 y0.0733 y1.03 y0.2448) y1.91
REGION3 y0.0289 y0.37 0.1709 1.17
REGION4 0.1905) 1.80 0.2183 1.03
REGION6 y0.0903 y1.27 y0.1828 y1.22
REGION7 y0.0067 y0.10 y0.0892 y0.69
REGION8 y0.1810))) y2.90 y0.2121) y1.78
REGION9 y0.2069)) y2.37 y0.5704))) y3.36
REGION10 y0.1896))) y2.82 y0.5572))) y3.82
WHITE 0.6882))) 9.25 0.6317))) 3.36
OTHER INCOME y0.0078))) y28.72 y0.0104))) y17.22
NO. OF OBS 8782 1846
2
x 1802.19 751.84
a
One, two and three asterisk imply significance at the 10%, 5% and 1% levels, respectively.
Yorkshire and Humberside. Participation is linked negatively with the size of exogenous non-labour income, as expected on theoretical grounds.
Ž .
As an aside, a specification including the type of disability not reported here was estimated for the disabled group. The results suggest that the type of disability plays an important role in the probability of employment. Those with physio-logical disabilities affecting sight, hearing, breathing and heart problems are much more likely to be in employment than those with psychological or learning
Ž .15
difficulties the omitted category . The former would be classified as disabled on
Ž .
the Tringo scale see Baldwin and Johnson, 1994 and the latter handicapped, so that these results appear to be consistent with North American experience.
Ž .
Turning to the Even and McPherson 1990, 1991 probit decomposition
out-Ž . out-Ž .
lined in Eqs. 4 – 6 , as already noted the able-bodied have an actual participation
15 Ž .
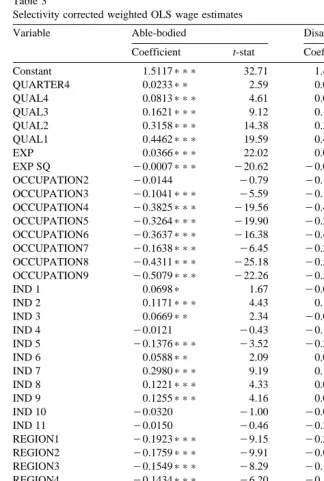
Table 3
Selectivity corrected weighted OLS wage estimates
Variable Able-bodied Disabled
Coefficient t-stat Coefficient t-stat
Constant 1.5117))) 32.71 1.4315))) 9.37
QUARTER4 0.0233)) 2.59 0.0435 1.45
QUAL4 0.0813))) 4.61 0.0828) 1.78
QUAL3 0.1621))) 9.12 0.1827))) 3.92
QUAL2 0.3158))) 14.38 0.3969))) 5.85
QUAL1 0.4462))) 19.59 0.4715))) 6.57
EXP 0.0366))) 22.02 0.0283))) 5.71
EXP SQ y0.0007))) y20.62 y0.0006))) y6.23
OCCUPATION2 y0.0144 y0.79 y0.1381)) y2.03
OCCUPATION3 y0.1041))) y5.59 y0.1874))) y2.94
OCCUPATION4 y0.3825))) y19.56 y0.4620))) y7.38
OCCUPATION5 y0.3264))) y19.90 y0.3675))) y6.66
OCCUPATION6 y0.3637))) y16.38 y0.4562))) y6.33
OCCUPATION7 y0.1638))) y6.45 y0.2354))) y2.82
OCCUPATION8 y0.4311))) y25.18 y0.5358))) y9.66
OCCUPATION9 y0.5079))) y22.26 y0.5741))) y8.37
IND 1 0.0698) 1.67 y0.0737 y0.57
IND 2 0.1171))) 4.43 0.1199 1.53
IND 3 0.0669)) 2.34 y0.0340 y0.39
IND 4 y0.0121 y0.43 y0.1327 y1.56
IND 5 y0.1376))) y3.52 y0.2892)) y2.50
IND 6 0.0588)) 2.09 0.0523 0.61
IND 7 0.2980))) 9.19 0.1801) 1.54
IND 8 0.1221))) 4.33 0.0516 0.62
IND 9 0.1255))) 4.16 0.0701 0.79
IND 10 y0.0320 y1.00 y0.0545 y0.60
IND 11 y0.0150 y0.46 y0.2679))) y2.75
REGION1 y0.1923))) y9.15 y0.2411))) y3.53
REGION2 y0.1759))) y9.91 y0.0945) y1.70
REGION3 y0.1549))) y8.29 y0.1239)) y2.24
REGION4 y0.1434))) y6.20 y0.1530)) y1.99
REGION6 y0.1313))) y7.48 y0.0854) y1.47
REGION7 y0.1531))) y9.16 y0.0993) y1.94
REGION8 y0.1631))) y10.17 y0.1664))) y3.46
REGION9 y0.1803))) y8.04 y0.1726)) y2.22
REGION10 y0.1262))) y7.27 y0.1281) y1.91
FIRM SIZE-20 y0.1508))) y13.08 y0.1607))) y4.18
COLOUR 0.0394 1.61 0.1786)) 1.97
PUBLIC SECTOR 0.0565))) 3.18 0.1043)) 2.03
PART-TIME y0.0045 y0.19 0.0184 0.32
TENURE 0.0160))) 9.99 0.0256))) 5.09
TENURE SQ y0.0002))) y4.73 y0.0004)) y2.50
MARRIED 0.0918))) 7.72 0.0814)) 2.26
SICKNESS1 y0.0404 y1.39 y0.1550)) y1.97
Ž .
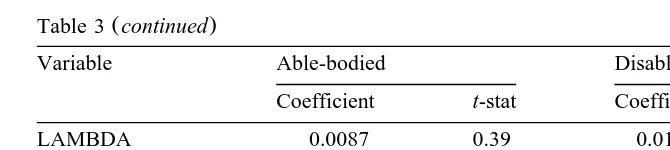
Table 3 continued
Variable Able-bodied Disabled
Coefficient t-stat Coefficient t-stat
LAMBDA 0.0087 0.39 0.0158 0.41
NO. OF OBS 7368 634
2
ADJUSTED R 0.522 0.567
F 179.60 19.45
rate of 84% compared to a rate of 34% for the disabled. The main question to be addressed is to what extent this differential is due to productivity related character-istics. Using the results provided in Table 2, the overall difference in participation may be decomposed into explained and unexplained components. The total difference in participation is approximately 0.50, that is evenly split between the component reflecting ablerdisabled differences in personal characteristics and residual differences. Thus, we can ‘explain’ roughly one half of the overall participation difference.
The sample selection corrected earnings equation results are presented in Table
Ž .
3. The Inverse Mills ratio l is clearly insignificant for both able-bodied and
Ž .
disabled groups. Baldwin and Johnson 1994 report a significant negative l
coefficient for the able-bodied implying that not-employed men with above average wage offers have more valuable opportunities outside the labour force. Given the insignificance of the sample correction, our results are little affected by whether or not a correction is made for sample selectivity.
The overall fit of the wage specification is relatively good with an R2 of 0.52
for the able-bodied and 0.57 for the disabled. Turning to a discussion of differ-ences in estimated coefficients between the two groups, the disabled obtain a slightly greater return to education than the able-bodied, this holds for each and
Ž .
Once again, as an aside, when type of disability is included as an additional set of regressors in the disabled wage equation, with the default representing psycho-logical illness, interestingly, none of the coefficients on type of disability are individually significant. This is in sharp contrast with the earlier probit results, suggesting that type of disability influences the employment-participation decision rather than wage determination.
Ž .
Turning to the earnings decomposition outlined in Eq. 8 and presented in Table 4, the crude log wage differential using OLS is 0.143. Thus, the disabled on average earn 13.32% less than the able-bodied. Ignoring the issue of sample selection and utilising uncorrected OLS results, suggests that this log wage difference may be decomposed into approximately half explained by differences in characteristics and half by differences in rewards for given characteristics.
[image:16.595.46.381.245.495.2]Taking into account the role of sample selection, the crude log offer wage differential is slightly greater at 0.152 or approximately 14.1%. This slight
Table 4
Decomposition of male wage differences, 1996 Wage effects
LN wage differential
Observed LN wage differential 0.1432
Offer LN wage differential 0.1524
a Ž . Ž .
Components of the differential XayXd Ba BayBd Xd Education qualifications and experience 0.0339
Sickness 0.0052
Occupation and industry 0.0416
Other y0.0019
Total 0.0789 0.0735
Employment effects b Probability of employment
Able discriminatory 0.8848
Able non-discriminatory 0.8844
Disabled discriminatory 0.2681
Disabled non-discriminatory 0.2687
Elasticities
c W.R.T. participation
Able wage elasticity 0.099
Disabled wage elasticity 0.032
W.R.T. hours
Able wage elasticity 0.27
Disable wage elasticity 0.02
a Ž . Ž .
Oaxaca and Ransom 1994 demonstrate that although the explained component column 1 may
Ž .
meaningfully be decomposed into sub-components, the unexplained column 2 cannot. b
The probability of employment in the discriminatory non-discriminatory cases are derived using
Ž . Ž .
Eqs. 9 and 10 , respectively. c
increase arises due to the sample selection effects being positive for both groups,
Ž .
and slightly larger for the disabled i.e. 0.011 vs. 0.0019 . Decomposing this offer wage gap once again leads to an even split between explained and unexplained components. Thus the contribution of characteristics is approximately 0.079 or 50% and 0.073 for the residual. Table 4 also decomposes the explained component into sub-components. The results suggest that all factors work in the same direction, with industryroccupation differences playing the major role. Interpret-ing the unexplained component in the traditional manner suggests that the disabled do suffer from significant wage discrimination.
Ž .
Following the Baldwin and Johnson 1992, 1994 methodology, it is possible to estimate the employment effects of wage discrimination for the disabled. Using the
Ž . Ž .
notation introduced in Eqs. 1 – 3 , the procedure involves two basic steps. First, the coefficient estimates of the probit model are used to predict the probability of employment for the representative average able and disabled individual, respec-tively:
gj
PjsF
ž /
YjŽ
jsD, A ..
Ž .
9su i
The second step estimates the average probability of employment in the absence of
Ž .16
discrimination, which leads to a straightforward adjustment of Eq. 9 :
0) 0
gj Wj yWj
)
Pj sF Yi jq .
Ž
10.
[image:17.595.81.208.309.344.2]su j su j
Table 4 includes the employment effects.17 The results suggest that the non-dis-criminatory employment probability is extremely close to the disnon-dis-criminatory or actual participation rate. This is important from a policy viewpoint — it suggests that wage discrimination per se may be important but the implied employment
16
The identification of the standard deviation termsu j is somewhat problematic. Following Baldwin
Ž .
and Johnson 1992 , we utilise the Heckman model of labour supply, i.e. we assume that hours worked are proportional to the gap between the offer and reservation wage. Thus,su j may be estimated as a
Ž .
by-product of the hours of work equation results available upon request . The sufficient condition for identification is that one variable in the wage offer specification is excluded from the reservation wage.
Ž . Ž .
We follow Heckman 1976 and Baldwin and Johnson 1992, 1994 by assuming that the variable, labour market experience, fulfils this role.
17 Ž .
effect associated with the discriminatory wage reduction is very small. This overall conclusion is robust across several specifications of the econometric model.18
Additional light on the responsiveness of the labour supply of the disabled is provided by the elasticities included in Table 4. The participation elasticity represents the responsiveness of the decision to participate to a change in the wage rate, i.e. the wage with and without discrimination. Theoretically the elasticity is a priori expected to be positive for both the able bodied and the disabled groups. The results suggest that the disabled have a very inelastic response, the estimated employment-participation elasticity is 0.099 for the able-bodied and only 0.032 for the disabled. In an attempt to put these numbers in context, Baldwin and Johnson
Ž1992 cite an equivalent elasticity of 0.1 for white men and 0.44 for white.
women.19 Table 4 also documents the responsiveness of hours worked to the wage
rate. The results suggest that the elasticities are 0.27 and 0.025 for the able bodied and disabled groups respectively.20 Once again this suggests that the response is
relatively inelastic. One important conclusion to draw from this analysis is that it would appear that legislation designed to combat wage discrimination against the disabled will have little impact upon their participation rate.
5. Conclusions
This paper, one of the first to analyse British data, confirms the presence of substantial wage and participation rate differences between the able-bodied and the disabled. Using traditional decomposition methods it would appear that differences in productivity related characteristics between groups are capable of explaining around 50% of both the wage and participation rate differential between the able-bodied and disabled. The unexplained components are somewhat difficult to interpret in the current context, since it is difficult to adequately control for the impact of disability upon productivity. However, there is a large unexplained wage
18
The main alternative specification follows the literal version of the Heckman model, i.e. the probit and hours worked specifications are identical and the wage equation is also identical apart from the exclusion of non-labour income. This is a very restrictive form, and by necessity it implies the absence of industryroccupation, firm size, public, part-time, tenure and sickness variables as they are not observable for non-participants.
19 Ž .
Baldwin and Johnson 1992 argue that the higher female elasticity is to be expected given that the average female wage is lower than that of the male. The same argument might be employed for the relative magnitudes for the able and disabled groups. However, it could also be argued that health related issues might be expected to lower the responsiveness of the disabled group. Thus a priori, the expected relative magnitudes of the elasticities is unclear. In the alternative literal Heckman specifica-tion of the model, the elasticities are 0.055 for the able bodied and 0.13 for the disabled group. Thus, relative magnitudes of elasticity for the two groups are not robust across specification. However, participation response rates for both groups are always small, i.e. inelastic.
20
component, which may, in part, be addressed by the implementation of the 1995 Disability Act.21 Interestingly, the size of the gap in participation rates between the two groups is vast and only approximately half of the difference can be explained via observed differences in productivity related characteristics. Given the inelastic participation response of the disabled, it appears that even if legisla-tion can lead towards wage convergence with the able-bodied, this will have little impact upon the participation rate.
References
Baldwin, M., Johnson, W.G., 1992. Estimating the employment effects of wage discrimination. Review of Economics and Statistics 74, 446–455.
Baldwin, M., Johnson, W.G., 1994. Labor market discrimination against men with disabilities. Journal
Ž .
of Human Resources XXIX 1 , 1–19.
Baldwin, M.L., Zeager, L.A., Flacco, P.R., 1994. Gender differences in wage losses from impairments: estimates from the survey of income and program participation. Journal of Human Resources XXIX
Ž31 , 865–887..
Blinder, A.S., 1973. Wage discrimination: reduced form and structural estimates. Journal of Human Resources 8, 436–455.
Cater, B., Smith, J.B., 1999. Inferring disability from post-injury employment duration. Applied Economics Letters 6, 747–751.
Cotton, J., 1988. On the decomposition of wage differentials. Review of Economics and Statistics, 236–243.
Cousins, C., Jenkins, J., Laux, R., 1998. Disability data from the LFS; comparing 1997–98 with the past. Labour Market Trends, 321–335.
Department for Education and Employment, 1996. Guidance on Matters to be Taken into Account in Determining Questions Relating to the Definition of Discrimination, HMSO.
Even, W.E., MacPherson, D.A., 1990. Plant size and the decline of unionism. Economic Letters 32, 393–398.
Even, W.E., MacPherson, D.A., 1991. The impact of unionism on fringe benefit coverage. Economic Letters 36, 87–91.
Harkness, J., 1995. Earnings of the Disabled: A Case of Discrimination, Queens University, Ontario,
Ž .
mimeo February .
Haveman, R., Wolfe, B., 1990. The economic well-being of the disabled: 1962–1984. Journal of
Ž .
Human Resources XXV 1 , 32–54.
Heckman, J.J., 1976. The common structure of statistical models of truncation, sample selection and limited dependant variables and a simple estimator for such models. Annals of Economic and Social Measurement 5, 475–492.
Jenkins, J., 1997. Assessment of the quality of data from the Spring 1997 LFS disability module. Labour Market Trends, 494–495.
Johnson, W.G., Lambrinos, J., 1985. Wage discrimination against handicapped men and women.
Ž .
Journal of Human Resources XX 2 , 264–277.
21
Lambrinos, J., 1991. Health: a source of bias in labour supply models. Review of Economics and Statistics, 203–212.
Loprest, P., Rupp, K., Sandell, S.H., 1995. Gender, disabilities and employment in the health and retirement study. Journal of Human Resources XXX, 5293–5318, Supplement.
Luft, H.S., 1975. The impact of poor health on earnings. Review of Economics and Statistics 57, 43–57.
Oaxaca, R.L., Ransom, M., 1994. On discrimination and the decomposition of wage differentials. Journal of Econometrics 61, 5–21.
O’Donnell, O., 1998. The effect of disability on employment allowing for work incapacity. University of Kent, Department of Economics, Discussion Paper 98r13.
Oi, W., Andrews, E.S., 1992. A Theory of the Labour market for Persons with Disabilities. Report for the US Department of Health and Human Services.
Ž .
Raskin, C., 1994. Employment equity for the disabled in Canada. International Labour Review 133 1 , 75–88.
Reimers, C.W., 1983. Labor Market Discrimination Against Hispanic and Black Men Review of Economics and Statistics 135.
Sly, F., 1996. Disability and the labour market. Labour Market Trends, 413–424.
Tyler, M.C., 1993. The Disability Discrimination Act 1992: genesis, drafting and prospects. Melbourne University Law Review 19, 211–228, June.
Glossary
DependentÕariables
LOG HOURLY EARNINGS dependent variable of the wage equation, defined as gross weekly earnings divided by usual hours worked per week.
PARTICIPATION dependent variable of the probit equation, equal to 1 if employee has a positive wage and hours, otherwise equal to 0.
Human capitalÕariables
EXPERIENCE years of labour market experience
TENURE length of time in present job
QUAL1 degree or higher degree
QUAL2 diploma
QUAL3 A level or equivalent
QUAL4 O level or equivalent
Ž .
QUAL5 no qualifications default
IndustryÕariables
IND 1 agriculture and mining
IND 2 manufacturing
IND 3 electricity and construction
IND 4 wholesale, retail and motor trade
IND 5 hotels and restaurants
IND 6 transport storage and communication
IND 8 real estate and renting
IND 9 public administration and defence
IND 10 education
IND 11 health and social work
Ž .
IND 12 and 13 other default
OccupationÕariables
Ž .
OCCUPATION1 managers and administrators default
OCCUPATION2 professional occupations
OCCUPATION3 associate professional and technical occupations OCCUPATION4 clerical and secretarial occupations
OCCUPATION5 craft and related occupations
OCCUPATION6 personal and protective service occupations
OCCUPATION7 sales occupations
OCCUPATION8 plant and machine operatives
OCCUPATION9 other occupations
Regional dummies
REGION1 North
REGION2 Yorkshire and Humberside
REGION3 East Midlands
REGION4 East Anglia
Ž .
REGION5 London and South East default
REGION6 South West
REGION7 West Midlands
REGION8 North West
REGION9 Wales
REGION10 Scotland
OtherÕariables
SICKNESS1 period of sicknessrinjury 1–6 days SICKNESS2 period of sicknessrinjury )1 week
Ž .
SICKNESS3 no period of sicknessrinjury default
COLOUR dummy variable denoting ethnic origin, equals 1 if white
MARRIED dummy variable denoting marital status, equals 1 if married
FIRMSIZE-20 dummy variable denoting firm size of less than 20 workers
PUBLIC SECTOR dummy variable denoting employment in public or private sector, equals 1 if a public sector employee PART-TIME dummy variable denoting full-time or part-time
employment
Q4 dummy variable, equals 1 if 1996Q4, 0 if 1996Q2