4
THE EFFECT OF PERCEIVED ENVIRONMENTAL UNCERTAINTY ON THE RELATIONSHIP BETWEEN BUDGETARY PARTICIPATION AND PERFORMANCE: A CASE STUDY ON NGO THE NATURE
CONSERVANCY-INDONESIA MARINE PROGRAM A.A.Ayu Putri Mirayanti D.
Ni Luh Supadmi I Made Karya Utama
Abstract
Previous research papers have announced that budgetary participation is one of
the many variables affecting performance on organizations. Many others, unfortunately,
have not produced consistent supporting results. The drawn theory about the effect of
budgetary participation on performance is still unclear to this day.
This paper supports the thought that the inconsistent research output is due to the
failure to recognize that participation impacted upon performance in an indirect way.
One of the ways suggested is through moderating variables. The most frequent variable
that affects an NGO is contingency variable. This paper brought up a contingency
variable, perceived environmental uncertainty, as the moderating variable.
The result of this research is consistent with some similar attempts on
understanding the effect of budgetary participation on performance. Budgetary
participation variable in this case studyhave a significant effect upon performance,
perceived environmental uncertainty is a significant moderating factor of the relationship
between budgetary participation and performance at The Nature Conservancy –
Indonesia Marine Program.
Keywords: Budgetary participation, Perceived environmental uncertainty, Performance, NGO
5
The uncertain nature of current economy and business drives entities, both profit
and non-profit, to be highly effective and efficient. Succeeding the competition means organizations need to increase their performance and accountability. One of the ways to elevate performance and accountability is the use of budget as a management tool
Participation in budgeting helps organization to yield all functions of a budget. These functions include planning tool, control platform, and evaluation standard.
Involving the lower level manager and workers in setting a budget canaid organizations to set realistic goals.Realistic goals are important to create effective plans, reliable control
platform, and measurable evaluation standard. Realistic goals are also significant in stabilizing performance by reducing the possibilities of slack.
Participatory budgeting has always been an enthusiastic fieldto be researched as it
involves behavioral factors that affect performance. Through the various previous researches, there has been no consistent empirical proof of the participatory budgeting influence upon performance. The bipolar difference in research results has failed to
support a strong theory regarding participatory role in changing performance.
Kenis (1979)has found that participatory budgeting has positive and significant
effect on performance. Similar findings also discovered by Brownell (1981), Brownell (1982), Brownell &McInnes (1986), and Murray (1990). These researchers have done their research in profit oriented environment, and have all found that the higher
participation level in budgeting usually lead to higher performance.
In contrast,Milani (1975) has found a rather inconsistent almost insignificant
6
results. Hirst (1987),in his attempt to replicate Brownell‟s (1982) research methodology, has failed to discover the same result.Kren (1992), who used information availability and environmental volatility as intervening variables between participatory budgeting and
performance, also has failed to find a significant result.
The lack of result trend found throughout the researches causes researchers to
look for the reason for this inconsistency. Murray (1990) has dedicated his research to finding the intervening and moderating variables that affect participatory budgeting impact on performance. Dunk &Lysons (1997) also support the thought that research
result inconsistency was a result of another outsider factor. The most frequently pointed factor to affect relationship between participatory budgeting and performance is
contingency factor.
Contingency is closely related with organization‟s external environment. The environment, in which a non-profit organization exists, is a dynamic and constantly
changing existence. This dynamic scene is a source of uncertainty. Dunk &Lysons (1997) have found that when an organization exists in a complex and rather volatile environment, the judgments of its operators will be affected. This includes judgment in
undertaking budgetary decisions. Participation in budgetary decision is expected to reduce the level of uncertainty felt by organization operators. This finding indicates that
uncertainty, whichperceived by organization‟s operators, is one of the factors that can influence the relationship between participatory budgeting and performance.
7
Milani (1975) mentions that a budgetary system cannot exist without human resource that operates it. When budgetary participation is present while setting the organizational goals, operators of the organization will experience internalization or
acceptance process. Internalization of organizational goal may lead to motivation and ultimately increase in performance (Murtanto&Hapsari, 2006). This further proof that
participatory budgeting is essential to shift operators‟ focus upon the participative goal that has been set(Murray, 1990; Brownell, 1981; Milani, 1975). Thus, the first hypothesis of this research is:
H1: Participatory budgeting affects performance.
Many researches have been dedicated in explaining the lack of consistency
explaining the relationship between participatory budgeting and performance. Most suspicions fall upon contingency factors as an outside affecter behind this inconsistency. Perceived environmental uncertainty is one of contingency variables that affect every
organization faced with its changing environment (Duncan &Moores, 1989). Perceived environmental uncertainty also alleged as the real factor affecting budgetary decision-making because the actual uncertainty is immeasurable (Downey dkk, 1975). Thus, the
second hypothesis of this research is:
H2: Perceived environmental uncertainty affects relationship between budgetary
participation and performance
Data and Methodology
8
organization, especially Non Governmental Organization (NGO), has made this research attempts to better understand the impact of participatory budgeting upon performanceat The Nature Conservancy – Indonesia Marine Program (TNC-IMP). The organization‟s
primary office in JalanPengembak no. 2, Sanur, Denpasar, Bali, Indonesia.
The data for this research is gathered throughquestionnaires, which target TNC-IMP‟s employee based on four criteria: 1) respondent must be an employee who has
passed his/her three month probation period; 2) respondent must be an employee who has a job description that is directly related to the organization programmatic budget; 3)
respondent must be an employee who is involved in budgetary process; and 4) respondent must be an employee who hold one of the four level of structural tier (director, manager,
coordinator, officer). From these criteria, 40 employees were suitable for becoming respondents out of the 61 total employees.
Questionnaires were adapted from Milani (1975), Duncan (1972), and Mahoney
inPasoloran (2002).Some adjustments were made to the questions dimension and structure used, since they were previously intended for profit-oriented entities. The measurement scale used for the questions is the four Likert Scale. Research instruments
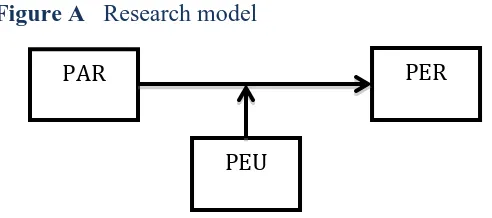
will be tested using reliability and validity tests, while the hypothesis will be analyzed using both linear regression and moderated regression analysis. The model used within
this research can be found in Figure A. Figure A Research model
PAR PER
9 Explanation:
PAR = Budgetary Participation PER = Performance
PEU = Perceived Environmental Uncertainty Results and Discussion
This section will provide the findings regarding the respond rate and respondent
characteristics, which are important in determining validity of a case study. Online survey tools were used to spread the questionnaire among the chosen potential respondent. Out
of the 40 survey links sent, only 38 return with answers. From the 38 answered questionnaire, only 35 were usable because the other 3 were incompletely submitted. This
means the survey usable respond rate is 87.5 percent. The high usable respond rate may be caused by author‟s direct involvement as an employee of TNC-IMP, and thus
elevating response control significantly.
Complete respondent characteristics can be found in Appendix 1. According to Appendix 1, 42.86 percent of respondents have been working at TNC-IMPfor 2-4 years. This means that most of TNC-IMP‟s employees have sufficient organizational and
work-related knowledge to fit into the organization. On the other hand, 45.86 percent of the employees have just been in their current position for less than a year. This means though
many of them are long-serving employee, most have just been given a new position and in the process of adjusting to their new workload.
Most of the respondents come from the coordinator level and without supervisory
responsibility, with both achieving 42.85 percent.This means that the survey data is dominated by views from those whose authority upon budgetary decision is minimal.
10 Instruments and Data Tests
This section reports on the tests used to measure instruments‟ validity and
reliability, and also data eligibility to be regressed. The first test is validity test for the questionnaire used in this research. The validity test is done through conducting Pearson
Correlation test with the help of SPSS software.According to the result of Table A below, all instruments used to measure each variable are valid as they all have Pearson Correlation result higher than 0.3 and p value less than 0.05.
Table A Validity test
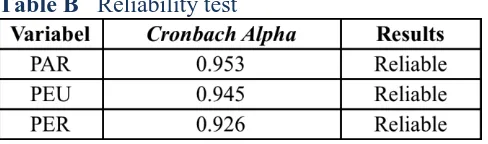
The second test is reliability test, which also used to test questionnaire as the research instrument. Counting the Cronbach Alpha of each instrument does the reliability
test in this research. Based on Table B, all instrument in this research is reliable as the produce Cronbach Alpha higher than 0.7.
Table B Reliability test
Based on normality test, the data used in this research is normally distributed based on the p value produced from K-S one sample test. The p value produced, 0.399, is
11 Hypothesis Tests
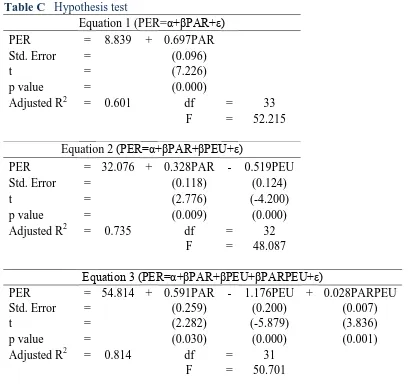
This section delivers the results on each methodology used to test hypothesis that exist in this research. The first hypothesis is tested using linear regression inputted into
Equation 1 in Table C. Meanwhile, the second hypothesis is tested using Moderated Regression Analysis (MRA). MRA requires three equations to be inputted according to
Ghozali (2011), but only focuses on the third (Equation 3) for determining moderating variable.
Table C Hypothesis test
Equation 1 (PER=α+βPAR+ε)
PER = 8.839 + 0.697PAR
Std. Error = (0.096)
t = (7.226)
p value = (0.000)
Adjusted R2 = 0.601 df = 33
F = 52.215
Equation 2 (PER=α+βPAR+βPEU+ε)
PER = 32.076 + 0.328PAR - 0.519PEU
Std. Error = (0.118) (0.124)
t = (2.776) (-4.200)
p value = (0.009) (0.000)
Adjusted R2 = 0.735 df = 32
F = 48.087
Equation 3 (PER=α+βPAR+βPEU+βPARPEU+ε)
PER = 54.814 + 0.591PAR - 1.176PEU + 0.028PARPEU
Std. Error = (0.259) (0.200) (0.007)
t = (2.282) (-5.879) (3.836)
p value = (0.030) (0.000) (0.001)
Adjusted R2 = 0.814 df = 31
F = 50.701
The result of the first equation reveals that budgetary participation has a positive
12
coefficient produced (0.697) and the p value of 0.000, which is less than 0.05. This result means that the first hypothesis is supported by the data in this research.
The regression result of the third equation reveals that perceived environmental
uncertainty has a direct negative and significant effect on performance. This is showed by the negative coefficient (-1.176) and p value less than 0.05. The regression result also
reveals that interaction between perceived environmental uncertainty and budgetary participation can positively and significantly impact performance at TNC-IMP. This is showed by the positive coefficient (0.028) and p value less than 0.05 or 5 percent. This
means that perceived environmental uncertainty is a moderating variable that strengthen relationship between budgetary participation and performance.
Beside those results, Adjusted R2has increased from equation to equation. Equation 3 produces the highest Adjusted R2, 0.814. This means that 81.14 percent of performance variances at TNC-IMP can be explained by budgetary participation,
perceived environmental uncertainty and the interaction of both.This result supports the second hypothesis in this research thatperceived environmental uncertainty affects relationship between budgetary participation and performance.
Conclusion
This paper hypothesizes thatbudgetary participation affects performance, and that perceived environmental uncertainty affects relationship between budgetary performance and performance. Through a series of tests and analysis, this paper has found
13
will lead to higher performance in a certain limit. This finding support the findings of Rinarti and Renyowijoyo (2007) and Nor (2007) that have found the similar positive and significant effect of budgetary participation on performance.
In an NGO such as TNC-IMP, environment is an important existence that cannot be lightly counted in its budgetary decision-making. This paper has found evidence that
when an environment is highly volatile and uncertain; the elevating level of participatory budgeting is necessary to balance out the employee performance. This finding differs from that of Rinarti&Renyowijoyo (2007) which did not find any evidence of significant
effect of perceived environmental uncertainty upon performance. This finding supports the research done by Kren (1992), which has found that increasing level of participation
in budgeting is necessary to maintain the level of performance when faced with a highly uncertain environment.
This research has some limitation beside that this is a case study. In a case study
such as this paper, general conclusion is hard to be drawn as the data only represent one organization. The number of respondents able to participate is also low due to the nature of this research location and subject. Future development of theories and empirical
studies regarding perceived environmental uncertainty, budgetary participation, and performance of NGOs should include various organization and hetero sample to be closer
in withdrawing general conclusion and even a theory.
This research was started and conducted by an employee of the organization who did not pass the sampling criteria nor was included. Although precautions have been
14
15
List of Reference
Brownell, P. 1981. "Participation in Budgeting, Locus of Control and Organization Effectiveness", The Accounting Review, LVI(4), 844-860.
________. 1982. "A Field Study Examination of Budgetary Participation and Locus of Control", The Accounting Review, LVII(4), 766-777
________ andHirst, M. 1986. "Reliance on Accounting Information, Budgetary Participation, and Task Uncertainty: Tests of a Three-Way Interaction",
Journal of Accounting Research, 24(2), 241-249.
________ andMcInnes, M. 1986. "Budgetary Participation, Motivation, and Managerial Performance", The Accounting Review, LXI(4), 587-600.
Downey, H. K., Hellriegel, D., and Slocum, J. W. 1975. "Environmental Uncertainty: The Construct and Its Application", Administrative Science Quarterly, Vol. 20, 613-629.
Duncan, K. and Moores, K. 1989. "Residual Analysis: A Better Methodology for Contingency Studies in Management Accounting", JMAR, Vol. One Fall, 89-103.
Duncan, R. B. 1972."Characteristics of Organizational Environment and Perceived Environment Uncertainty", Administrative Science Quarterly, 313-327.
Dunk, A. S. and Lysons, A. F. 1997. "An Analysis of Departmental Effectiveness, Participative Budgetary Control Processes and Enviromental Dimensionality Within The Competing Values Framework: A Public Sector Study", Financial Accountability & Management, 13(1), 1-15.
Ghozali, I. 2011. AplikasiAnalisis Multivariate dengan Program IBM SPSS 19.Semarang:BadanPenerbitUniversitasDiponegoro.
Hirst, M. K. 1987."Some Further Evidence on the Effects of Budget Use and Budget Participation on Managerial Performance", Australian Journal of Management, 12(1), 49-56.
Kenis, I. 1979. "Effects of Budgetary Goal Characteristics on Managerial Attitudes and Performance", The Accounting Review, LIV(4), 707-721.
16
Latham, G. P., Steele, T. P., and Saari, L. M. 1982. "The Effects of Participation and Goal Difficulty on Performance", Personnel Psychology, 35, 677-686.
Milani, K. 1975. "The Relationship of Participation in Budget-Setting to Industrial Supervisor Performance and Attitudes: A Field Study", The Accounting Review, April, 274-284.
Murray, D. 1990. "The Performance Effects of Participative Budgeting: An Integration of intervening and Moderating Variables", Behavioral Research in Accounting, 2, 104-123.
MurtantodanHapsari, W. A.
2006."PengaruhPartisipasiPenyusunanAnggaranTerhadapKinerjaManajeri aldenganDesentralisasidanKarakteristikSistemInformasiAkuntansiManaje mensebagaiVariabel Moderating", JurnalBisnisdanAkuntansi, 8(1), 1-18.
Nor, W. 2007."Desentralisasidan Gaya KepemimpinansebagaiVariabel Moderating
dalamHubunganantaraPartisipasiPenyusunanAnggarandanKinerjaManajeri al", SNA X, Juli, 1-27.
Pasoloran, O. 2002. “Pengaruh Perceived Environmental Uncertainty (PEU) terhadapHubunganantaraKarakteristikSasaranPenganggarandenganKinerja Manajerial”, Tesis, Magister Akuntansi Program PascasarjanaUniversitasDiponegoro Semarang.
Rinarti, D. danRenyowijoyo, M.
2007."PengaruhKetidakpastianLingkungandanBudayaOrganisasiTerhadap PartisipasiPenganggarandankinerjaManajerial",
JurnalBisnisdanAkuntansi, 9(2), 124-135.
20 Appendix 3: Normality Test Result
One-Sample Kolmogorov-Smirnov Test Unstandardized
Residual
N 35
Normal Parametersa,b Mean 0E-7
Std. Deviation 2,09166047
Most Extreme Differences
Absolute .151
Positive .082
Negative -.151
Kolmogorov-Smirnov Z .896
Asymp. Sig. (2-tailed) .399
21
Appendix 4: Regression Result
Variables Entered/Removeda
Model Variables Entered Variables
Removed
Method
1 PARb . Enter
2 PEUb . Enter
3 PARPEUb . Enter
a. Dependent Variable: PER b. All requested variables entered.
Model Summary
Model R R Square Adjusted R Square Std. Error of the
Estimate
1 .783a .613 .601 3.66107
2 .866b .750 .735 2.98514
3 .911c .831 .814 2.49757
a. Predictors: (Constant), PAR b. Predictors: (Constant), PAR, PEU
c. Predictors: (Constant), PAR, PEU, PARPEU
ANOVAa
Model Sum of
Squares
df Mean Square F Sig.
1
Regression 699.858 1 699.858 52.215 .000b
Residual 442.314 33 13.403
Total 1142.171 34
2
Regression 857.017 2 428.509 48.087 .000c
Residual 285.154 32 8.911
Total 1142.171 34
3
Regression 948.798 3 316.266 50.701 .000d
Residual 193.373 31 6.238
Total 1142.171 34
a. Dependent Variable: PER b. Predictors: (Constant), PAR c. Predictors: (Constant), PAR, PEU
22
Appendix 4: Regression Result (continued)
Coefficientsa
Model Unstandardized
Coefficients
Standardized Coefficients
t Sig.
B Std. Error Beta
1 (Constant) 8.389 2.599 3.228 .003
PAR .697 .096 .783 7.226 .000
2
(Constant) 32.076 6.025 5.324 .000
PAR .328 .118 .368 2.776 .009
PEU -.519 .124 -.557 -4.200 .000
3
(Constant) 54.814 7.782 7.044 .000
PAR .591 .259 .664 2.282 .030
PEU -1.176 .200 -1.260 -5.879 .000