587 © 2007 by the American Fisheries Society
* Corresponding author: suzyanna@indo.net.id
Economic Loss of Pollution to Fisheries: An Economic
Analysis of the Jakarta Bay Fisheries
SUZY ANNA
Department of Fisheries, Faculty of Fisheries and Marine Science, Padjadjaran University Jl. Raya Jatinangor, Bandung UBR, 40600 Indonesia
AKHMAD FAUZI
Head of Department of Resource and Environmental Economics, Faculty of Economics and Management IPB Jl. Kamper Wing 5 Level 5, Kampus IPB Darmaga Bogor 16680 Indonesia.
Introduction
Coastal resources play an important role in the economic development of coastal states. Besides providing goods and services worth more than US$10 trillion a year, coastal re-sources also provide direct employment for more than 200 million small-scale and com-mercial fishermen. In addition, more than half a billion of people rely their livelihood indi-rectly on coastal related activities (Hinrichsen 2002). For example, in Asia alone, of 3.7 bil-lion of total Asia’s population, 60% of them live within 400 km of coastal area and en-gages in coastal dependent activities such as fishing, harvesting, and mining. Consequently, coastal resources have been under tremendous pressure due to rapid economic development. According to a study by World Resource In-stitute, over one-half of the world’s coastlines have suffered from severe development pres-sure (Fauzi and Anna 2002; Fauzi and Anna 2003).
The pressures on coastal resources are also amplified by economic externalities such as pollution which flows through the river
run-off to the coastal areas. It is not doubt that pol-lution has contributed significantly to the fall-ing catches of the coastal fishfall-ing. There are number of cases of externalities which involve environmental degradation for coastal resources. For example, wastes, or even toxic wastes, dumped by households or industries located on the watershed area, may enter into water (or river) causing pollution to the coastal wa-ters once valued for fishing and water recre-ation. Examples from coastal waters from de-veloping countries reveal how badly pollution problems in coastal areas. Hinrichsen (2002), for example, noted that in Chile, the Bays of Valparaiso and Concepcion receive a combined of total of 244 million metric tons of untreated effluents a year. Worst yet, in India, the cities of Calcutta and Bombay, dump more than 400 million metric tons of raw sewage and 365 million metric tons of other municipal wastes into coastal waters every year causing a huge economic loss to society.
pollution on fishing activities. Collins et al. (1998), for example, have modeled the fish-ery–pollution interaction using a bioeconomic model by incorporation pollution variable as the driver for stock contamination and its ef-fect on effort displacement. Grigalunas et al. (1988) and Grigalunas et al. (2001) have modeled the fishery–pollution interaction by assuming that pollution will cause economic loss to the fishery through a decline in fishing mortality. Using a slightly different bioeconomic approach, this paper develops a fishery–pollution interaction by embedding pollution variable into fishery production func-tion and analyze its effect on the economic loss to the fishing industry.
The Model
To construct the bioeconomic model of fish-ery-pollution interaction, it is worth consid-ering the specific functional form of biomass growth function as well as the harvest func-tion. Let the biomass growth function be rep-resented by the Gompertz function,
where r is the intrinsic growth rate and k is the environmental carryng capacity. Let the harvest function be given by the following Cobb-Douglass type production function:
h = qxE
where q is catchability coefficient and E is level of effort exerted to fishery. Now suppose, the pollution variable affects directly into the bio-mass production function, then the dynamic of the biomass can be written as:
where is P pollution variable and g is a con-stant coefficient. The estimation of biological
parameters as well as pollution parameter can be carried out by transforming equation (1.3),
By introducing variable catch per unit effort (CPUE) at time t as , using algebraic simplification, equation (1).4) can now be modified as:
Parameters r, q, k, and γ can then be estimated using ordinary least square (OLS) technique from time series data of CPUE, pollution load and effort level. For the purpose of this study, sixteen years of time series data of catch and effort of demersal fishery as well as the data of pollution load were gathered. The pollution load is defined as total load of COD, BOD, and TSS collected from the Jakarta Environ-mental Impact Agency. The load is an aggre-gate measure of pollution discharge from 13 rivers runoff.
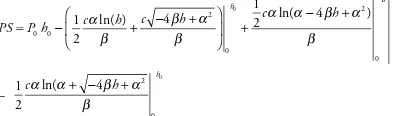
To calculate the economic loss due to pollu-tion, let assume that the economic rent gen-erated from the fishery without pollution vari-able is in the form of , while that with pollution variable is defined as . The economic loss to the fishery due to pollution is then defined as the difference between these two (i.e., L = ), where L denotes economic loss.
where parameters α and β are constant coeffi-cients of yield effort curve by solving simulta-neously equation (1).1) and equation (1).2) under steady state condition. By employing time series data of catch and effort these pa-rameters can simply be derived using OLS technique. Parameter P and c represent price per kg of fish and cost per unit of effort, re-spectively. Parameter h represents average land-ing from the fishery under pollution scenario, while h0 represents landing under untainted scenario. Data for these landings were obtained from adjacent landing sites with and without polluted waters.
Case Study: The Jakarta Bay Fishery
The Jakarta Bay, located in the north coast of Indonesia capital, Jakarta, has been an impor-tant area for both fishing as well as nonfishing activities. The bay is also well known for its high pollution discharge emanating from vari-ous river run-off (Anna 1999).
In terms of fishing activities, the Jakarta Bay serves as fishing ground for small-scale fisher-men. Since the area is relatively narrow, only some particular fishing gears operate in the area. These include, stationary liftnet, gillnet, traps and hook and line. Some mollusk fish-ermen also operate along the estuarine area. Besides being fishing area, the Jakarta Bay also serves as the gate for shipping and marine transportation to and from the busiest fishing port in the capital city namely Tanjung Priok Port. Other fishing gears such as liftnet (know as bagan to local fishermen) and traps (bubu) are often being accused of obstructing the transportation activities around the Bay.
The fishery production in the Jakarta Bay was primarily dominated by demersal fish cought by gears described above. The demersal land-ing accounts for more than 50% of the total landing of the Jakarta area. The demersal fish such as groupers and red snapper are consid-ered as highly economic fish in the market. The prices of these fish are substantially higher than the average pelagic fish. It is not surpris-ing, therefore some fishermen often use de-structive fishing practice such as cyanide and bombing, which have caused damage to al-most 80% of the coral reefs in the Bay and along the Seribu Island.
Results from analysis can be seen from Table 1 through Table 4. As can be seen from Table 1, pollution has significantly reduced the present value of economic rent that could have been generated from the fishery. This can be seen from the negative number of resource rent generated under pollution scenario. On aver-age, more than Rp 2.5 billion rupiah (approxi-mately U.S.$ 3 million ) of the present value of resource rent has lost due to the pollution. This is a significant loss for small-scale fishery such as the Jakarta Bay fishery.
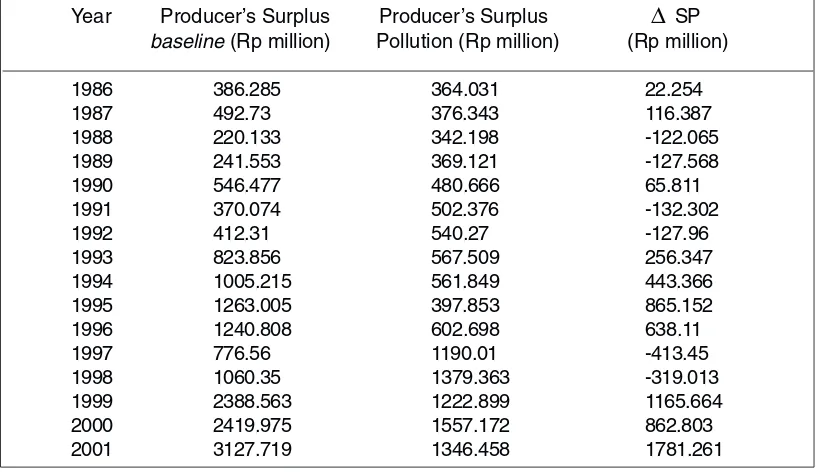
The economic loss could also be viewed from the loss in economic surplus that could have been secured from the fishery. As can be seen from Table 2, an average of Rp 310.92 mil-lion per year would loss because of pollu-tion. This Figure is considerably significant for the mostly traditional fishermen of the Jakarta Bay whose income from fishing is relatively low.
Year SYB SYP PVRbase PVRP
(mt) (mt) (Rp million) (Rp million)
1986 77.8 71.65 1251.88 1042.06
1987 91.98 67.88 1526.22 630.4
1988 38.47 59.29 786.48 1594.86
1989 39.91 60.49 858.64 1701.69
1990 82.54 70.77 1745.24 1208.62
1991 49.82 66.99 1285.61 2149.39
1992 52.72 68.36 1424.3 2254.41
1993 98.52 65.08 2498.11 540.52
1994 110.87 58.31 2905.38 -495.32
1995 139.07 37.87 3109.41 -4063.81
1996 118.51 53.32 3467.87 -1488.44
1997 39.67 60.29 2763.8 5499.08
1998 53.3 68.61 3656.12 5722.46
1999 115.7 55.22 6760.68 -2242.79
2000 102.67 63 7230.3 645.84
2001 124.68 48.95 8465.28 -5554.33
Table 1. Yield and present value of rent under baseline and pollution scenario.
Note: SYB=Sustainable Yield baseline, SYP=Sustainable Yield with Pollution, PVRbase=Present value rent baseline, PVRP=Present value rent with pollution.
Year Producer’s Surplus Producer’s Surplus
∆
SPbaseline (Rp million) Pollution (Rp million) (Rp million)
1986 386.285 364.031 22.254
1987 492.73 376.343 116.387
1988 220.133 342.198 -122.065
1989 241.553 369.121 -127.568
1990 546.477 480.666 65.811
1991 370.074 502.376 -132.302
1992 412.31 540.27 -127.96
1993 823.856 567.509 256.347
1994 1005.215 561.849 443.366
1995 1263.005 397.853 865.152
1996 1240.808 602.698 638.11
1997 776.56 1190.01 -413.45
1998 1060.35 1379.363 -319.013
1999 2388.563 1222.899 1165.664
2000 2419.975 1557.172 862.803
2001 3127.719 1346.458 1781.261
Baseline (Rp million) Pollution (Rp million) ∆TB
FR PS T B FR PS TB (Rp million)
1986 187.78 386.29 574.07 156.31 364.031 520.34 -53.73
1987 228.93 492.73 721.66 94.56 376.343 470.9 -250.76
1988 117.97 220.13 338.1 239.23 342.198 581.43 243.32
1989 128.8 241.55 370.35 255.25 369.121 624.38 254.03
1990 261.79 546.48 808.26 181.29 480.666 661.96 -146.3
1991 192.84 370.07 562.92 322.41 502.376 824.78 261.87
1992 213.64 412.31 625.95 338.16 540.27 878.43 252.48
1993 374.72 823.86 1198.57 81.08 567.509 648.59 -549.99
1994 435.81 1005.22 1441.02 -74.3 561.849 487.55 -953.47
1995 466.41 1263.01 1729.42 -609.57 397.853 -211.72 -1941.13
1996 520.18 1240.81 1760.99 -223.27 602.698 379.43 -1381.56
1997 414.57 776.56 1191.13 824.86 1190.01 2014.87 823.74
1998 548.42 1060.35 1608.77 858.37 1379.363 2237.73 628.96
1999 1014.1 2388.56 3402.67 -336.42 1222.899 886.48 -2516.18
Year
Table 3. Comparison of total benefit between the baseline and pollution scenario.
Note: FR=fishery rent, PS= Producer’s Surplus, TB=Total Benefit
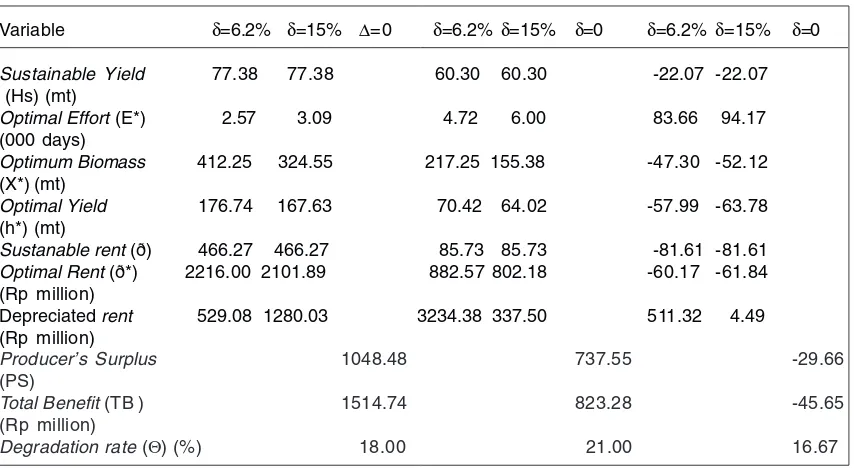
Variable δ=6.2% δ=15% ∆=0 δ=6.2% δ=15% δ=0 δ=6.2% δ=15% δ=0
Sustainable Yield 77.38 77.38 60.30 60.30 -22.07 -22.07
(Hs) (mt)
Optimal Effort (E*) 2.57 3.09 4.72 6.00 83.66 94.17
(000 days)
Optimum Biomass 412.25 324.55 217.25 155.38 -47.30 -52.12 (X*) (mt)
Optimal Yield 176.74 167.63 70.42 64.02 -57.99 -63.78 (h*) (mt)
Sustanable rent (ð) 466.27 466.27 85.73 85.73 -81.61 -81.61
Optimal Rent (ð*) 2216.00 2101.89 882.57 802.18 -60.17 -61.84
(Rp million)
Depreciated rent 529.08 1280.03 3234.38 337.50 511.32 4.49 (Rp million)
Producer’s Surplus 1048.48 737.55 -29.66
(PS)
Total Benefit (TB ) 1514.74 823.28 -45.65
(Rp million)
Degradation rate (Θ) (%) 18.00 21.00 16.67
ever, that this figure is applicable to the dem-ersal fishery only with two dominant fishing gears. Extrapolating to the fishery of the bay as a whole, the economic loss could have been very much higher than that the number above. As can be seen from Table 4, overall, pollu-tion has caused a significant reducpollu-tion in the optimum harvest level and some monetary in-dicators such rent and producer’s surplus. The optimum level of harvest or yield is calculated using standard bioeconomic model described in Clark (1990). This reduction in economic surpluses could be attributed to the resource degradation, which is as much as 21% per year due to pollution.
Conclusion
Studies on the economic analysis on the in-teraction between fishery and pollution are indeed a complex and difficult exercise.
Complexity of fishery system and its interac-tion with environment make the modeling of fishery–pollution interaction a challenging one. Few have attempted such a modeling due to these complexities. This paper, however, of-fers a simplified modeling of fishery-pollution interaction by imbedding the pollution vari-able into a standard bioeconomic model of the fishery. By doing this, the model offers an alternative way of analyzing the economic impacts of pollution to the fishery which have long been neglected. In terms of the case study in the Jakarta Bay area, the economic loss due to pollution is quite significant. The total eco-nomic loss in terms of net benefit deriving from the loss in resource rent and producer’s surplus is approximately Rp 700 million per year. An integrated fishery policy through what so-called Envo-Fishery should be encour-aged. That is, pollution control in the Bay should take into account its impact on the
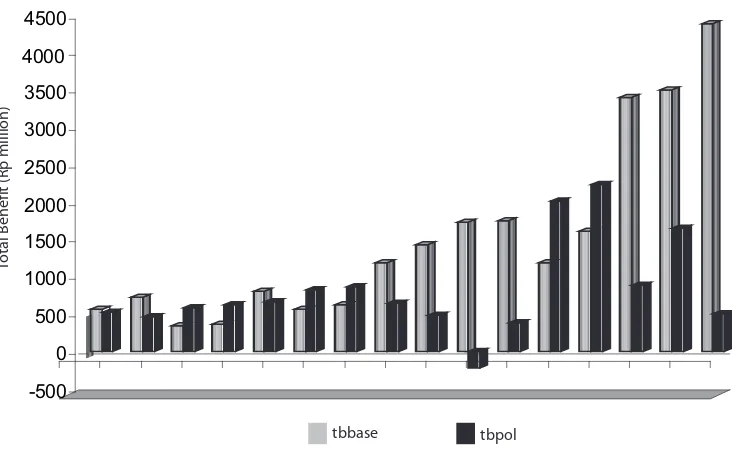
-500 0 500 1000 1500 2000 2500 3000 3500 4000 4500
tbpol tbbase
Total Benefit (Rp million)
fishery in the area, not only in terms of its biological dimension but also in terms of its economic consequences. The study also reveals that due to excessive production and input level in the fishery, there seems no room for further expansion of effort for the demersal fishery in the area. Therefore, management of input and output in the fishery should be di-rected into efficiency of the industry, through for example, a combination fiscal and envi-ronmental policies. Finally, even though this study had attempted to incorporate all pos-sible models with regards to analysis of fish-ery–pollution interaction, there might be some other things which could have been over-looked, such as incorporating stochastic pro-cess in the model. Further study to incorpo-rate such a process, therefore, is strongly en-couraged.
References
Anna, S. 1999. Analysis of pollution load and assimilative capacity in the Jakarta Bay. Master’s thesis. Bogor Agricultural University, Bogor, Indonesia.
Clark, C.W. 1990. Mathematical bioeconomics: the optimal management of renewable resources, 2nd editon. Wiley, New York.
Collins, A., S. Pascoe, and D. Whitmarsh. 1998. Fish-ery-pollution interactions, price adjustment and effort transfer in adjacent fisheries: a bioeconomic model. In Proceedings of the First World Congress of environmental and resource economists, Venice, Italy.
Fauzi, A., and S. Anna. 2002. Assessment of fishery re-source depreciation for policy considerations. Jour-nal of Coastal and Marine Resources 4(2):36–49. Fauzi, A., and S. Anna. 2003. Assessment of sustainability of integrated coastal management projects: a CBA-DEA approach. Journal of Coastal and Marine Re-sources, Special Issue 1:34–48.
Grigalunas, T.A., J. J. Opaluch, D. French, and M. Reed. 1988. Measuring damages to marine natural re-sources from pollution incidents under CERCLA: application of an integrated ocean system/economic model. Marine Resource Economics 5:1–21. Grigalunas, T.A., J. J. Opaluch and M. Luo. 2001. The
economic cost to fisheries from marine sediment disposal: case study of Providence, RI, USA. Eco-logical Economics 38:47–58.