HANDBOOK ON
Health Inequality
Monitoring
WHO Library Cataloguing-in-Publication Data
Handbook on health inequality monitoring: with a special focus on low- and middle-income countries.
I.World Health Organization. ISBN 978 92 4 154863 2
© World Health Organization 2013
All rights reserved. Publications of the World Health Organization are available on the WHO web site (www.who.int) or can be purchased from WHO Press, World Health Organization, 20 Avenue Appia, 1211 Geneva 27, Switzerland (tel.: +41 22 791 3264; fax: +41 22 791 4857; e-mail: [email protected]).
Requests for permission to reproduce or translate WHO publications – whether for sale or for noncommercial distribution – should be addressed to WHO Press through the WHO web site (http://www.who.int/about/licensing/copyright_form/en/index.html).
The designations employed and the presentation of the material in this publication do not imply the expression of any opinion whatsoever on the part of the World Health Organization concerning the legal status of any country, territory, city or area or of its authorities, or concerning the delimitation of its frontiers or boundaries. Dotted lines on maps represent approximate border lines for which there may not yet be full agreement.
The mention of speciic companies or of certain manufacturers’ products does not imply that they are endorsed or recommended by the World Health Organization in preference to others of a similar nature that are not mentioned. Errors and omissions excepted, the names of proprietary products are distinguished by initial capital letters.
All reasonable precautions have been taken by the World Health Organization to verify the information contained in this publication. However, the published material is being distributed without warranty of any kind, either expressed or implied. The responsibility for the interpretation and use of the material lies with the reader. In no event shall the World Health Organization be liable for damages arising from its use.
Acknowledgements
Ahmad Reza Hosseinpoor (World Health Organization, Geneva, Switzerland) coordinated the development of this handbook with the assistance of Nicole Bergen (Consultant, Geneva, Switzerland). The handbook was initially conceptualized by Ahmad Reza Hosseinpoor and Jennifer H. Lee (Consultant, Los Angeles, United States). The draft was prepared by Ahmad Reza Hosseinpoor, Nicole Bergen and Kyle Ragins (Intern, World Health Organization) as well as Aluisio J D Barros (Federal University of Pelotas, Brazil), Sam Harper (McGill University, Canada), Jennifer H. Lee and Cesar Victora (Federal University of Pelotas, Brazil). The work beneited greatly from the contribution of Ties Boerma (World Health Organization, Geneva, Switzerland), who reviewed the handbook and provided valuable comments.
Funding for this project was provided in part by the Public Health Agency of Canada (PHAC) and by the Rockefeller Foundation. The collaboration of the coordinating project team members from PHAC is gratefully acknowledged, in particular Jane Laishes, James McDonald and Andrea Long. John Dawson provided copy-editing support and AvisAnne Julien proofread the document. Design and layout by Paprika (Annecy, France)
iii
Contents
Foreword ... x
Introduction ... xii
Executive summary ... xiv
1. Health inequality monitoring: an overview ... 1
1.1 What is monitoring? ... 1
1.2 What is involved in health monitoring? ... 1
1.3 What is health inequality monitoring? ...6
1.4 Why conduct health inequality monitoring? ...10
1.5 How can health inequality monitoring lead to implementing change? ... 11
1.6 How are the social determinants of health related to health inequality monitoring? ...13
2. Data sources ... 17
2.1 Data source types ... 17
2.2 Population-based data sources ...19
2.3 Institution-based data sources ... 22
2.4 Strengths and limitations of key data sources ...23
2.5 Data source mapping ... 25
3. Measurement of health inequality ...29
3.1 How can health inequalities be measured? ...29
3.2 Simple measures of inequality (pairwise comparisons) ...29
3.3 Limitations of simple measures of inequality ...33
3.4 Complex measures of inequality ...38
3.5 Complex measures of inequality in ordered groups ...39
3.6 Complex measures of inequality in non-ordered groups ...46
4. Reporting health inequalities ... 57
4.1 Audience-conscious reporting ... 57
4.2 Methods of presenting data ... 57
4.3 Key aspects of health inequality reporting ...60
4.4 Selecting measures of health inequality to report ... 67
4.5 Special considerations ... 74
4.6 Reporting time trends ...78
4.7 Deining priority areas ...83
5. Step-by-step health inequality assessment: reproductive, maternal and child health in the Philippines ... 87
5.1 Selecting relevant health indicators and equity stratiiers ... 87
5.2 Data source mapping ...89
5.3 Data analysis ... 91
5.4 Reporting inequality ... 92
5.5 Deining priority areas ...99
Conclusion ... 103
v
Figures
Figure 1.1 Cycle of health monitoring ... 2
Figure 1.2 Components of a national health sector monitoring, evaluation and review framework ...3
Figure 1.3 Example health indicators related to reproductive, maternal and child health, displayed within a monitoring, evaluation and review framework ... 5
Figure 2.1 Data sources for health inequality monitoring ...18
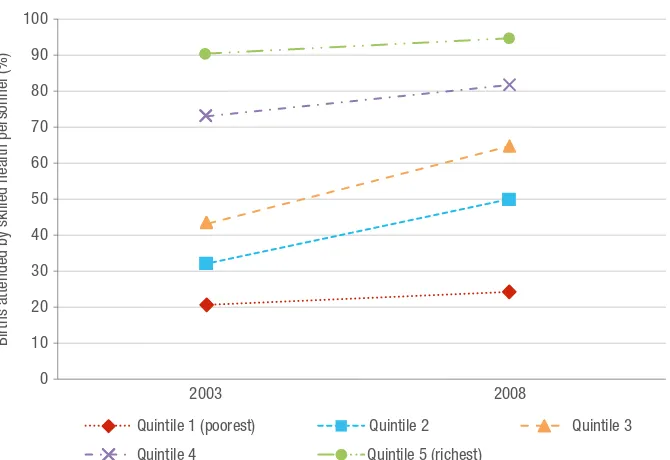
Figure 3.1 Births attended by skilled health personnel in Ghana, by wealth quintile, DHS 2003 and 2008 ... 34
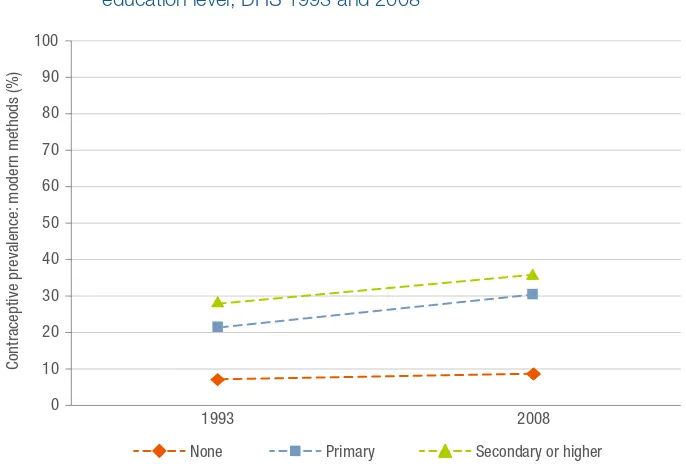
Figure 3.2 Contraceptive prevalence (modern methods) in the Philippines, by education level, DHS 1993 and 2008 ... 35
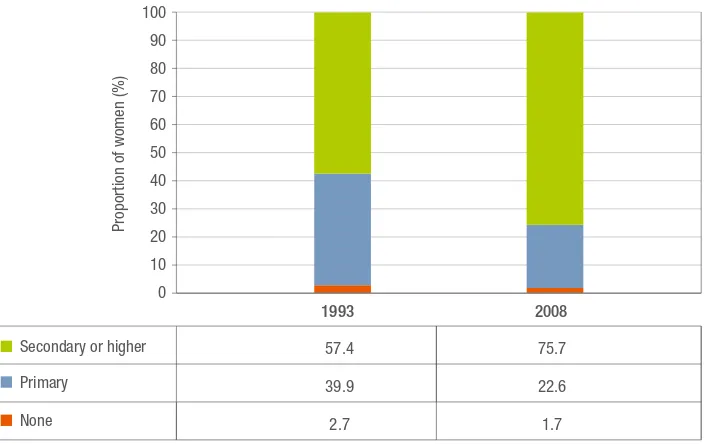
Figure 3.3 Proportion of women of reproductive age in the Philippines, by education level, DHS 1993 and 2008 ...36
Figure 3.4 Slope index of inequality: absolute inequality in smoking prevalence in a population of men living in 27 middle-income countries, World Health Survey 2002–2004 ...40
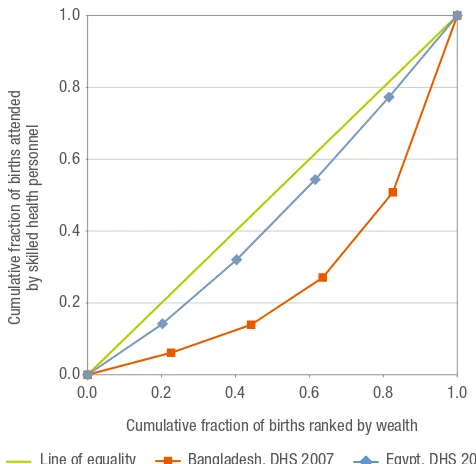
Figure 3.5 Relative wealth-based inequality in births attended by skilled health personnel in Bangladesh and Egypt, represented using concentration curves, DHS 2007 and 2008 ...43
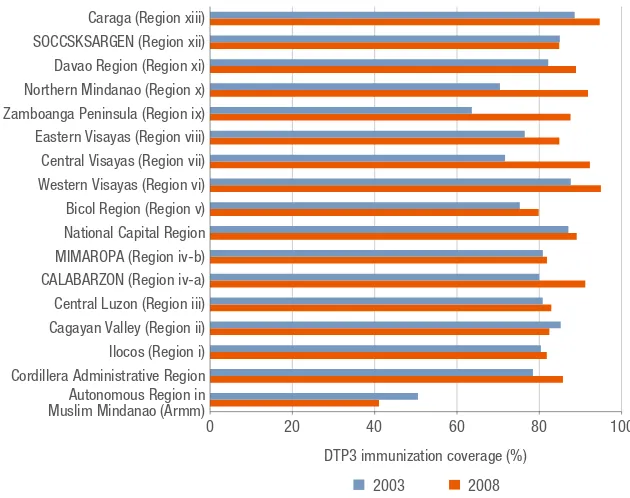
Figure 3.6 Region-based inequality in DTP3 immunization coverage among 1-year-olds in the Philippines, DHS 2003 and 2008 ...48
Figure 3.7 Region-based relative inequality in selected reproductive, maternal and child health indicators in Egypt shown using (a) ratio and (b) Theil index, DHS 1995 and 2008 ... 51
Figure 3.8 National average gap in coverage of reproductive, maternal and child health services and within-country wealth-based inequality in coverage gap in 24 low- and middle-income African countries, DHS and MICS 2005–2011 ... 54
Figure 4.1 Contraceptive prevalence (modern methods) in Egypt, by wealth quintile, DHS 1995, 2000 and 2005 ...60
Figure 4.3 Benchmarking the latest status of births attended by skilled health personnel in Malawi against 22 other low-income African countries, by wealth quintile, DHS 2005–2010 ... 64
Figure 4.4 Benchmarking the latest status of wealth-based absolute inequality in births attended by skilled health personnel in Vanuatu against 11 other low- and middle-income Asia-Paciic countries, DHS and
MICS 2005–2010 ... 65
Figure 4.5 Benchmarking time trend in under-ive mortality rate in Zambia against 12 other middle-income countries, by place of residence, DHS 1996–2000 and 2006–2010 ...66
Figure 4.6 Patterns of health inequality, shown using coverage of births
attended by skilled health personnel in Bangladesh, Gambia, Jordan and Viet Nam, by wealth quintile, DHS and MICS 2005–2007 ...68
Figure 4.7 Coverage of selected maternal health service indicators in the Philippines, by wealth quintile, DHS 2008 ...69
Figure 4.8 Wealth-based inequality in stunting among children under ive in 70 countries, DHS and MICS 2005–2011 ... 74
Figure 4.9 Wealth-based inequality and national average in stunting among children under ive in 70 countries, DHS and MICS 2005–2011 ... 75
Figure 4.10 Relative wealth-based inequality and national prevalence in smoking in (a) men and (b) women in 48 low- and middle-income countries, World Health Survey, 2002–2004 ... 77
Figure 4.11 Under-ive mortality rate in Nigeria, by place of residence and wealth, DHS 2008 ...78
Figure 4.12 Four-quadrant view of benchmarking time trends in infant mortality rate in 20 African countries over a ive-year period, wealth-based inequality versus national average ...80
Figure 4.13 Time trends in inequality in subgroups in the case of (a) increasing prevalence and (b) decreasing prevalence of a health indicator, highlighting different scenarios for absolute and relative inequality 81
vii Figure 5.1 Time trend of selected reproductive, maternal and child health
service indicators in the Philippines, by wealth quintile, DHS 1998, 2003 and 2008 ... 95
Figure 5.2 Time trend of (a) antenatal care (at least four visits), (b) antenatal care (at least one visit), (c) family planning needs satisied and (d) vitamin A supplementation among children under ive in the Philippines, by wealth quintile, DHS 1998, 2003 and 2008 ...96
Tables
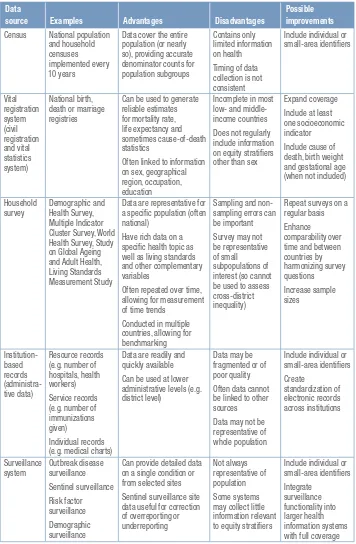
Table 2.1 Strengths, limitations and possible areas for improvement of key data sources for health inequality monitoring ... 24
Table 3.1 Area-based inequality in antenatal care (at least four visits) in
Colombia, DHS 1995, 2000, 2005 and 2010 ...30
Table 3.2 Sex-based inequality in under-ive mortality rates in Egypt, DHS 1995, 2000, 2005 and 2008 ... 31
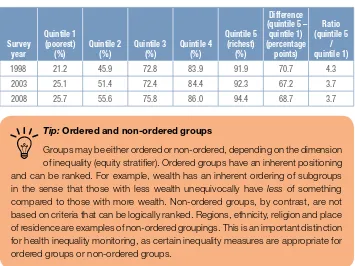
Table 3.3 Wealth-based inequality in births attended by skilled health personnel in the Philippines, DHS 1998, 2003 and 2008 ... 31
Table 3.4 Wealth-based inequality in births attended by skilled health personnel in Ghana, DHS 2003 and 2008 ...33
Table 3.5 Education-based inequality in contraceptive prevalence (modern methods) in the Philippines, DHS 1993 and 2008 ... 34
Table 3.6 Arriving at midpoint values of cumulative range based on education subgroups, for a population of men living in 27 middle-income countries and associated smoking prevalence, World Health Survey 2002–2004 ...40
Table 3.7 Arriving at cumulative fraction values for births and births attended by skilled health personnel using wealth-disaggregated data from Bangladesh and Egypt, DHS 2007 and 2008 ... 42
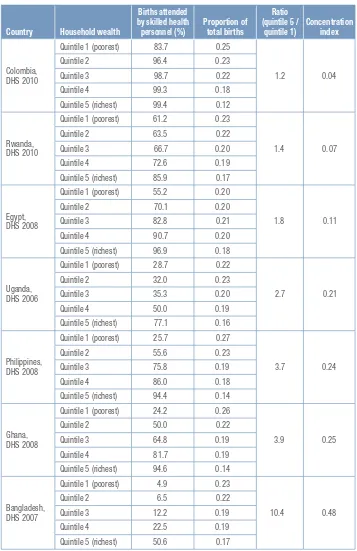
Table 3.8 Wealth-based relative inequality in births attended by skilled health personnel in selected countries, DHS 2006–2010 ... 44
Table 3.9 Education-based inequality in contraceptive prevalence (modern methods) in the Philippines, DHS 1993 and 2008 ... 45
Table 3.10 Region-based inequality in DTP3 immunization coverage among 1-year-olds in the Philippines, DHS 2003 and 2008 ...48
Table 3.11 Arriving at Theil index values for antenatal care (at least four visits), using region-disaggregated data from Egypt, DHS 1995, 2000, 2005 and 2008 ...50
Table 3.12 Wealth-based inequality in the coverage gap in family planning needs satisied in selected African countries, DHS 2000–2008 ...53
Table 4.1 Wealth-based inequality in contraceptive prevalence (modern
ix Table 4.2 Latest status of wealth-based inequality in selected health service
indicators in Rwanda, DHS 2010 ... 61
Table 4.3 Wealth-based inequality in births attended by skilled health personnel in low- and middle-income Asia-Paciic countries, DHS and MICS 2005–2010 ...65
Table 4.4 Wealth-based inequality in selected maternal health service indicators in the Philippines, DHS 2008 ...70
Table 4.5 Wealth-based inequality in selected reproductive, maternal and child health indicators in Ghana, DHS 1998 and 2008 ... 71
Table 4.6 Four-quadrant view of the time trend in various health indicators in Cameroon, wealth-based inequality versus national average DHS 1998–2004 ...79
Table 5.1 Reproductive, maternal and child health service indicators for health inequality monitoring in the Philippines ...88
Table 5.2 Measures used to quantify health inequality, by ive equity stratiiers 91
Table 5.3 Latest status of wealth-based inequality in selected reproductive, maternal and child health service indicators in the Philippines, DHS 2008 ... 94
Table 5.4 Assessing the latest status of inequality and national average in various reproductive, maternal and child health service indicators in the Philippines with a simple numerical scale ...100
Foreword
I welcome this comprehensive handbook on monitoring health inequalities at a time when health inequalities continue to persist around the world in general, and in low- and middle-income countries in particular. Inequalities in health become strikingly apparent when looking at social determinants. They are evident in the unequal way that health services are accessed by people of different income levels, gender, social classes and ethnic groups; they manifest in variations in health outcomes according to education level, and in the tendency for health systems to better meet the needs of populations in certain geographical areas.
As social determinants of health and progress towards universal health coverage emerge as priorities for global health, now is the time for action to tackle health inequalities. This means ensuring that all people can obtain the health services that they need without suffering inancial hardship or meeting other barriers, which are usually related to the social determinants of health. Effective inequality monitoring systems are essential to achieving meaningful progress in tackling health inequality and for improving accountability in public policy-making. A necessary prerequisite to creating an equity-oriented health sector is to systematically identify where inequalities exist, and then monitor how inequalities change over time.
The evidence generated from monitoring contributes to better-informed policies, programmes and practices, providing the necessary feedback to determine whether actions in the health sector and beyond are successful in reducing inequalities. In an effort to meet the demand for evidence-based results and accountability the World Health Organization, together with seven other agencies working in public health, have issued a call for action to strengthen the capacity for analysis, synthesis, validation and use of health data in countries.1 This includes ensuring that comparable estimates for common health indicators are made using the best available data and the most suitable methods, recognizing the need for coordination across settings.
The Handbook on health inequality monitoring: with a special focus on low- and middle-income countries is a resource that enables countries to do just that. It presents a comprehensive yet clear overview of health inequality monitoring in a user-friendly manner. The handbook succeeds in giving those involved in health inequality monitoring an appreciation of the complexities of the process, as well as building the practical knowledge and skills for systematic monitoring of health inequalities in low- and middle-income countries. The use of the handbook will enable countries to better monitor and evaluate their progress and performance
xi with a high degree of accountability and transparency, and allow them to use the
results to formulate evidenced-based policies, programmes and practices to tackle inequalities in an effective manner.
By committing to major health goals such as universal health coverage and addressing the social determinants of health, low- and middle-income countries are on the path to reducing health inequality. To this end, improved health inequality monitoring in low- and middle-income countries is a critical and timely priority to ensure the betterment of health across all members of society, especially the most disadvantaged.
Introduction
The World Health Organization developed the Handbook on health inequality monitoring: with a special focus on low- and middle-income countries to provide an overview for health inequality monitoring within low- and middle-income countries, and act as a resource for those involved in spearheading, improving or sustaining monitoring systems. The handbook was principally designed to be used by technical staff of ministries of health to build capacity for health inequality monitoring in World Health Organization Member States; however, it may also be of interest to public health professionals, researchers, students and others. We assume that the users of this handbook have basic statistical knowledge and some familiarity with monitoring-related issues. The aim of this handbook is to serve as a comprehensive resource to clarify the concepts associated with health inequality monitoring, illustrate the process through examples and promote the integration of health inequality monitoring within health information systems of low- and middle-income countries.
The early conceptualization of this handbook was informed by previous experiences working with ministries of health staff in low- and middle-income countries to develop competencies in health inequality monitoring. These experiences included developing and delivering training courses and modules and facilitating training workshops. This provided a foundation for the general approach of the handbook: to introduce and elaborate upon the stages of health inequality monitoring with a sustained focus on practical and useful applications of concepts at the country level.
The handbook presents the background and process of health inequality monitoring in ive sections. The irst section provides an overview of the health inequality monitoring process and its implications, and highlights considerations that underlie the selection of health indicators and equity stratiiers. Section 2 discusses issues related to inding appropriate data sources for inequality monitoring, including the types of data sources, their strengths, limitations and areas for improvement, and the process of data source mapping. In section 3, a number of measures used to calculate health inequality are introduced; the challenges that arise in their application and approaches to overcome these challenges are detailed. The guiding principles to navigate the task of reporting inequality monitoring are discussed in section 4. Finally, section 5 provides an example of health inequality monitoring in the Philippines, demonstrating how the concepts in sections 1–4 can be applied in the context of low- and middle-income countries.
xiii described can be applied to any health topic in any country or at any administrative
level. Unless otherwise indicated, the data for the examples contained in this handbook are published in the Global Health Observatory Health Equity Monitor.1
Readers of this handbook will encounter informative features throughout the text. This supplementary material appears alongside explanations of theoretical concepts
to familiarize the reader with its application and relevance within low- and middle-income countries.
• Tips: Short explanations elaborate on how to apply concepts to the actual practice of health inequality monitoring.
• Extra information: Building on the material in the main text, this supplementary information offers interested readers a deeper appreciation of the complexities of the subject and related topics.
• Read more: Recommended readings provide additional explanations, examples and discussions that reinforce and supplement topics in health inequality monitoring.
• Highlights: Summaries are provided for the reader to recall and review the most important information in the preceding section.
• Tables and igures: Various data visualization techniques help the reader to become accustomed to interpreting different forms of data presentation. The graphs, tables and visualizations that appear throughout the text were created
using various software programs, including both simple, widely available programs, and more specialized statistical and visualization programs.
This handbook was created so that individuals can become familiar with the steps of health inequality monitoring, and better interpret the vast literature available on the subject. It is our hope that this will enable the introduction of health inequality monitoring in areas where it is not currently conducted, and foster the improvement of current health inequality monitoring efforts.
1 World Health Organization. Global Health Observatory: Health Equity Monitor.
Executive summary
Monitoring is a process of repeatedly observing a situation to watch for changes over time. Monitoring health at the population level helps to show if the health situation is improving, worsening or staying the same. The results of monitoring indicate whether policies, programmes and practices are accomplishing what they are designed to achieve. In the health sector, monitoring can be thought of as a continuous cycle. For any given health topic, the monitoring cycle can be broken down into ive general steps: (1) identify relevant health indicators, (2) obtain data about the indicators, (3) analyse the data, (4) report the results, and (5) implement changes, when warranted, to improve relevant policies, programmes and practices. As the results of these changes unfold to shape a new health environment, the cycle begins anew.
This handbook explores health inequality monitoring, a speciic type of health monitoring. Health inequality is the metric by which health inequity can be assessed. By extension, monitoring health inequality has the speciic purpose of informing policies, programmes and practices to reduce differences in health that are unfair and unjust. Health inequality data provide a foundation for incorporating equity into evidence-based health planning, and also assessing whether current health initiatives promote equity. Throughout the handbook, the theoretical foundations and methodologies of health inequality monitoring are presented, focusing on applying the steps of the health monitoring cycle at the country level.
Before health inequality monitoring can begin, the concepts of health and inequality must be deined. Optimally, these should be construed broadly, inclusive of a wide range of health indicators and many dimensions of inequality. The World Health Organization’s monitoring, evaluation and review framework categorizes health indicators into four components spanning various levels of the health sector: inputs and processes, outputs, outcomes and individual-level health impacts. Depending on the scope of the monitoring activity, health indicators may be selected to cover the entire health sector, or there may be a narrower focus on parts of the health sector that are directly related to a speciic disease or health topic. Equity stratiiers – or the selected dimensions of inequality – should be relevant to both the population and the health indicator. Some commonly employed equity stratiiers include economic status, education level, sex, region, place of residence, and ethnicity or race. Identifying subgroups based on an equity stratiier can be a complex task; when possible, this should be done using systematic and established methods.
xv which are a combination of population-based and institution-based data. Each
of these sources has implicit advantages and disadvantages pertaining to data availability, scope, quality and representativeness. In low- and middle-income countries, household surveys are usually, by default, the most reliable data source of those available for health inequality monitoring, and thus the most commonly used. The process of assessing data sources begins with data source mapping, which catalogues all available data sources for health inequality monitoring according to the type of information contained within each source. Using data source mapping helps to identify where data can be obtained about health indicators and equity stratiiers of interest. Data source mapping can also reveal gaps where information is lacking.
Once relevant data have been obtained, the analysis step combines the health indicator and equity stratiier information. The mean level of the health indicator is calculated within each subgroup, and from here there are many diverse measures that can be used to analyse health inequality. Simple measures, such as difference and ratio, may be calculated to make pairwise comparisons between two subgroups. These measures are commonly used and easily interpreted; however, they cannot express inequality in more than two subgroups, and do not account for the subgroup size. Complex measures, such as slope index of inequality, concentration index, mean difference from the overall mean, Theil index and population attributable risk, may be useful in certain situations to overcome the limitations of simple measures. The selection of an appropriate set of measures to best quantify health inequality in a
given situation requires an understanding of the distinctions – and their implications – that underlie these measures. Important distinctions are:
• measures that make pairwise comparisons between two subgroups versus those that summarize differences across numerous subgroups;
• measures of absolute inequality versus relative inequality;
• measures that show inequality across subgroups with a natural order (such as income- and education-based classiications) versus subgroups that are non-ordered (such as ethnicity and region);
• measures that consider the subgroups’ population size (weighted data) versus those that do not (unweighted data);
• selection of the reference group (where applicable).
overall impression of how a country is performing, and may be useful to help identify priority areas within a health topic. Although analyses may involve several complex measurements to quantify inequality, the main conclusions should, when possible, be reported using simple measures that are easily understood by the audience. Disaggregated health data that show mean values in each subgroup should always be presented alongside the summary measures of inequality. Reports should cover both absolute and relative measures of inequality, and national averages should be presented alongside inequality data to provide a more complete picture. The results of a health inequality report may be used by policy-makers and other stakeholders when prioritizing areas for action. One way to do this is using a data reduction and scoring system, which yields evidence that key stakeholders from government, civil society, professional bodies, donor organizations, communities and other groups can integrate into decision-making and planning processes.
The handbook concludes with a step-by-step example of health inequality monitoring in the Philippines, applying the concepts of inequality monitoring. Indicators are chosen from the topic of reproductive, maternal and child health, and each step of the health monitoring cycle is illustrated and applied. The entire process from start to inish illustrates how health indicators are selected, data are obtained from available sources, inequality is measured, a meaningful report on health inequality is created and priority areas for action are identiied.
1. Health inequality monitoring: an overview 1
1. Health inequality monitoring:
an overview
1.1
What is monitoring?
Policies are created with the intent of improving the status quo. When there is a condition in a population that needs to be improved, a policy or programme is created to address it. However, it is sometimes dificult to judge whether policies and programmes accomplish the goals they set out to achieve.
Monitoring is a process that can help to determine the impact of policies, programmes and practices, and subsequently, to indicate whether change is needed. Generally speaking, monitoring is the process of repeatedly answering a given study question over time. In the world of policy, the study question usually pertains to the measurement of a condition that a policy seeks to impact. In this context, monitoring is useful and necessary as it has the ability to track policy outcomes over time and provides a means of evaluating the need for policy change. Once a policy has been changed, subsequent monitoring is necessary to evaluate the outcomes of the new policy, and thus monitoring should be an iterative and cyclical process that operates continuously.
While monitoring can help policy-makers identify success or problem areas, monitoring alone cannot typically explain the cause of troublesome trends. Rather, monitoring may be thought of as a warning system. In the case of health, monitoring picks up trends in health and allows policy-makers to target further research in those areas to determine the root cause of problems. Ongoing monitoring may identify subpopulations that are experiencing adverse trends in health. Thus, monitoring activities can both inform and direct research in a given area. While this handbook is primarily focused on one type of monitoring – health inequality monitoring – a general knowledge of monitoring can be applied to any ield where a study question can be repeatedly asked and answered.
1.2
What is involved in health monitoring?
Cycle of health monitoring
analysing health data can be as simple as creating overall summary statistics about the population’s health, or it can involve more complex statistical analyses. Following analysis, it is essential to report and disseminate the results so that they can be used to inform policy. Reporting can come in many forms, ranging from internal memos to press releases, technical reports and academic publications, each including various methods of presenting data (such as tables, graphs, maps or text). The goal should be to ensure that the results of the monitoring process are communicated effectively, and can be used to inform policies, programmes and practice. Selecting the most salient data to be presented in their clearest form is paramount in achieving this goal. Based on monitoring results, changes may be implemented that will impact and improve the health of the population. (This inal stage will not be covered extensively in the handbook, but will be discussed briely later in this section.) In order to monitor the effects of these changes, more data must be collected that describe the ongoing health of the population; thus, the cycle of monitoring is continuous.
Figure 1.1 Cycle of health monitoring
Select relevant health indicators
Obtain data Implement
changes
Analyse data Report results
Health indicators
1. Health inequality monitoring: an overview 3 Figure 1.2 Components of a national health sector monitoring, evaluation and
review framework Inputs and processes •Health inancing •Health workforce •Infrastructure •Information •Governance Outputs •Serviceaccess andreadiness •Servicequality andsafety Outcomes •Coverageof interventions •Riskfactors andbehaviours Impact •Healthstatus •Financialrisk protection •Responsive -ness
Source:AdaptedfromMonitoring, evaluation and review of national health strategies: a country-led platform for information and
accountability.Geneva,WorldHealthOrganization,2011.
Within each component of the monitoring, evaluation and review framework, various categories of indicators are deined that allow the measurement of health at many levels. Indicators of inputs and processes are broad, affecting many other parts of the health sector. Indicators that fall under outputs and outcomes tend to be quite speciic to a particular health topic, and may respond quickly to changes and progress in the health sector. Impact indicators, which are slower to respond to policy, programme and practice changes, are important to provide a snapshot of the health of a population. The monitoring, evaluation and review framework will be referenced and expanded upon throughout the handbook.
The components of the monitoring, evaluation and review framework can also be loosely linked to the type of data that are used. Outcomes and impact indicators tend to be calculated using individual- or household-level data, while others – mainly inputs and processes or outputs – are often calculated using subnational-level data. Certain inputs and processes indicators, such as total health expenditure, are calculated at the national level.
which are related to all health topics but only peripherally related to malaria. It may be appropriate to look more closely at certain outputs and outcomes components that contain a number of health indicators that are highly relevant to the topic of malaria (for example, health service indicators can be subdivided into categories of malaria treatment indicators, malaria prevention indicators, and so on); it would also be appropriate to include relevant impact indicators, such as malaria incidence rate.
An example of a package of health indicators relevant to monitoring progress and performance in reproductive, maternal and child health is presented in Figure 1.3, relecting indicators from all components of the monitoring, evaluation and review framework (Figure 1.2). Typically, the best indicators of progress in a priority health topic are those that are identiied by countries rather than imposed from outside sources; indicators selected by a country may be of greater relevance to the needs of that country. Note that the general approach to monitoring health will be the same regardless of the health indicators that are selected.
Tip: Tracer and composite indicators
Tracer and composite indicators may be used to monitor health performance in a given health topic, or progress towards a health goal such as universal health coverage. A tracer indicator is a speciic health indicator that is chosen to represent a broad health topic; a composite indicator is an index that is composed of several indicators within a health topic to represent that topic. Using tracer or composite indicators may be a concise way to report progress or performance in a health topic, and as an additional beneit, can help to facilitate comparisons between countries or over time.
For example, the topic of reproductive, maternal and child health could be covered by numerous indicators from all components of the monitoring, evaluation and review framework. A tracer indicator for health service coverage might be births attended by skilled health personnel, while a single composite indicator might include multiple indicators of maternal care, immunization, treatment of sick children and family planning.
1. Health inequality monitoring: an overview 5 Figure 1.3 Example health indicators related to reproductive, maternal and child
health, displayed within a monitoring, evaluation and review framework
Inputs and processes Health inancing •expenditureper target population (children,women, etc.) General government •expenditure onhealthasa percentage of general government expenditure Health workforce •midwives,per 10000population Governance •presenceofkey policiestopromote
maternal and child health Information •birthsregistered •deathsregistered (withcause) Outputs
Service access and readiness
•facilitiesthatoffer
and meet tracer
criteriaforbasic andcomprehensive obstetriccare,per 10000pregnant women •caesareansection
rate in rural
populations •facilitiesthatoffer
and meet tracer criteria for child
healthservices, per1000children Outcomes Coverage of interventions •antenatalcare: atleastfourvisits •birthsattended byskilledhealth personnel •immunization coverage •familyplanning needssatisied •childrenwith diarrhoea receiving oral rehydration therapy •childrenwith fever receiving antimalarials •insecticide-treated bednetuseamong children •antiretroviral prophylaxisamong HIV-positive pregnant women •vitaminA supplementation among children •postnatalcare
Risk factors and behaviours •contraceptive prevalence •accesstosafewater •accesstoimproved sanitation •lowbirthweight amongnewborns •earlyinitiationof breastfeeding •childrenwhoare stuntedor underweight Impact Health status •under-ivemortality •maternalmortality ratio •childmortalityby majorcauseof death,bysexand age Financial risk protection •out-of-pocket paymentsasa
percentage of total
healthexpenditure
Source:AdaptedfromMonitoring, evaluation and review of national health strategies: a country-led platform for information and
1.3
What is health inequality monitoring?
An explanation of health inequality monitoring begins with the concept of health inequity. Health inequities are the unjust differences in health between persons of different social groups, and can be linked to forms of disadvantage such as poverty, discrimination and lack of access to services or goods. While health inequity is a normative concept, and thus cannot be precisely measured or monitored, health inequality – observable differences between subgroups within a population – can be measured and monitored, and serves as an indirect means of evaluating health inequity.
Extra information: Readings about ethics and inequity
The ethical argument for the injustice of health inequity is beyond the scope of this handbook, but is discussed in other works, as follows.
Read more:
Marchand S, Wikler D, Landesman B. Class, health, and justice. Milbank Quarterly, 1998, 76:449–467.
Peter F, Evans T. Ethical dimensions of health equity. In: Evans T et al., eds. Challenging inequalities in health: from ethics to action. New York, Oxford University Press, 2001:25–33.
Whitehead M. The concepts and principles of equity and health. International Journal of Health Services, 1992, 22:429–445.
Health inequality monitoring describes the differences and changes in health indicators in subgroups of a population. The health indicators chosen for use in health inequality monitoring should be reasonably likely to relect unfair differences between groups that could be corrected by changes to policies, programmes or practices. The process of monitoring social inequalities in health follows the same cycle as any type of health monitoring, although there are some aspects that are unique to health inequality monitoring, namely (a) the need for two different types of intersecting data, (b) the statistical measurement of inequality, and (c) the challenge of reporting on different health indicators by different dimensions of inequality in a way that is clear and concise. While health monitoring needs only to consider data related to health indicators, health inequality monitoring requires an additional intersecting stream of data related to a dimension of inequality (for example, wealth, education, region, sex). This is sometimes referred to as an equity stratiier.
Equity stratiiers
1. Health inequality monitoring: an overview 7 the greatest emphasis has been placed on health inequality by economic status, and
many analyses of health inequality include only wealth-based inequality. However, there are many other policy-relevant equity stratiiers to describe health inequality, including education, social class, sex, province or district, place of residence (rural or urban), race or ethnic background, and any other characteristic that can distinguish population minority subgroups (for example, language, immigrant status). The acronym PROGRESS summarizes the equity stratiiers most frequently assessed in health inequality monitoring, but is not an exhaustive list of the stratiiers available and possibly relevant for analysis.
• Place of residence (rural, urban, etc.)
• Race or ethnicity • Occupation
• Gender • Religion
• Education
• Socioeconomic status
• Social capital or resources
Extra information: Total health inequality versus social inequality in health
Those who study health inequality should consider a fundamental decision of whether they wish to measure the overall distribution of health (total inequality) or inequalities between social groups (social inequality). Measures of total inequality consider only health indicator variables, and involve calculations such as standard deviation and variance. Studying social inequality in health requires at least two intersecting variables related to health indicators and equity stratiiers. Measures of social inequalities can indicate situations of health inequity when differences in health between social groups are unjust or unfair. This handbook describes techniques to measure social inequality in health; however, both are valid and important approaches that contribute to a comprehensive understanding of health inequality in societies.
Read more:
Braveman P, Krieger N, Lynch J. Health inequalities and social inequalities in health. Bulletin of the World Health Organization, 2000, 78(2):232–234.
Extra information: Readings about equity stratiiers
The acronym PROGRESS was irst proposed in 2003 by Evans and Brown, but has been adopted by several other sources to convey common types of equity stratiiers. For a succinct overview of the strengths and weaknesses of common socioeconomic stratiiers, see the paper by Galobardes et al.
Read more:
Evans T, Brown H. Road trafic crashes: operationalizing equity in the context of health sector reform. Injury Control and Safety Promotion, 2003, 10(1–2):11–12. Galobardes B et al. Indicators of socioeconomic position (part 1). Journal of Epidemiology and Community Health, 2006, 60(1):7–12.
There are a number of context-speciic issues that may arise when deciding upon the dimension(s) of inequality to use in health inequality monitoring and deining the parameters of how to classify subgroups. Not all equity stratiiers are equally relevant in all populations, depending on the characteristics of that population. For example, in some cultures an individual’s religion may – or may not – be closely tied to health-impacting behaviours or the types of health services that are accessed. Equity stratiiers may also vary in relevance depending on the health measure in question. For example, monitoring inequalities in trafic accidents may involve different dimensions of inequality than monitoring inequalities in modern contraceptive use.
Extra information: Age as an equity stratiier
1. Health inequality monitoring: an overview 9
Measuring equity stratiiers
Once having deined the types of relevant equity stratiiers, dividing a population into subgroups may seem like a straightforward task; however, looking closely at how individuals are categorized reveals several nuanced issues. The criteria that are used to deine subgroups within a population may depend on data collection, data availability or population characteristics. For example, when measuring inequality by occupation, how should someone whose occupation has changed, or who is retired, be classiied? Is it reasonable to compare the level of income across areas where the cost of living varies substantially? How many (and which) categories of race or ethnicity should be considered? Most equity stratiiers can be measured directly, or in some cases, using proxy measurements. To illustrate, economic status, one of the most common inequality dimensions, will be used to demonstrate how direct and proxy measures are constructed.
Direct measures of economic status include income and consumption or expenditure. One deinition of income may measure all money received during a speciied period of time, for labour or services, from sales of goods or property, as transfers from the government, other organizations or other households, or as earnings from inancial investments; alternatively, income is sometimes simply the amount of compensation received for employment. Income may be considered on an individual basis or divided by the number of people living in the household. There are some limitations of using income measurements that are particularly pertinent to low- and middle-income country settings: (a) non-monetary income, such as in-kind gifts or trading, may not be captured by the measurement tool; (b) problems arise on how to calculate income level when income is transitory, irregular or received through informal employment; and (c) questions about income may be a sensitive topic, especially in poor households. For these reasons, reliable data about income are dificult and expensive to collect. Consumption and expenditure are other direct measures of wealth, which measure the inal use of goods and services (consumption) and the money payments to obtain goods and services (expenditure). Measuring consumption and expenditure may have certain advantages in developing countries where income may be less predictable and the informal economy is more widespread. However, this information is usually not available from household health surveys, and may require a special set of questions speciically devoted to this measure.
Proxy measures of economic status strive to summarize household wealth using quickly and easily collected data about assets, housing and access to services. This may take the form of constructing simple asset indices, where equal weight
Extra information: Principal component analysis
Principal component analysis is a data reduction method that may be used to deine and calculate household wealth. Using this statistical technique, it is possible to answer the question: how can several household assets be aggregated into a single proxy variable of household wealth?
Principal component analysis is often applied to construct wealth indices using, for example, household survey questions about the number of rooms per capita, ownership of a car, ownership of a bike, ownership of a fridge or type of heating device. The technique generates a set of uncorrelated principal components. The irst component is that which explains the greatest amount of variance, and is commonly used to deine the asset index. Weights are assigned to each of the assets, and an aggregated score can be calculated for each of the surveyed households within a population, which can then be grouped based on their ranking (for example, into quintiles, where the 20% with highest scores comprise quintile 5, etc.).
Read more:
Filmer D, Pritchett LH. Estimating wealth effects without expenditure data – or tears: an application to educational enrollments in states of India. Demography, 2001, 38(1):115–132.
Howe LD et al. Measuring socio-economic position for epidemiological studies in low- and middle-income countries: a methods of measurement in epidemiology paper. International Journal of Epidemiology, 2012, 41(3):871–886.
O’Donnell O et al. Analyzing health equity using household survey data. Washington, DC, World Bank, 2008.
Vyas S, Kumaranayake L. Constructing socio-economic status indices: how to use principal components analysis. Health Policy and Planning, 2006, 21(6):459–468.
1.4
Why conduct health inequality monitoring?
1. Health inequality monitoring: an overview 11 From a statistical standpoint of health monitoring, ignoring health inequality can
present a variety of challenges. If only national averages of health indicators are monitored, they may not provide a complete representation of the changes in the health of a population. The national average of an indicator could remain constant over time, while certain population subgroups experience improvements in health and other population subgroups see their health deteriorating; it may even be possible to have improving national averages of health indicators while within-country inequality increases.
Disadvantaged population subgroups can also hold back a country’s national igures as outliers that affect national averages. Even in countries that are not explicitly aiming to reduce health inequalities, if disadvantaged subgroups are ignored in the national health plan, national igures may not reach their full potential. Donors and the international community look for progress in national health indicators (and increasingly to health inequality explicitly) to make decisions in funding. Addressing health inequalities and improving these igures can thus lead to a better national health system for all, not only those currently disadvantaged.
Extra information: Making comparisons on a global level
This handbook focuses on within-country inequality; that is, the inequalities that exist between subgroups within a country, based on disaggregated data and summary measures of inequality (for example, comparing the difference between infant mortality rates among urban and rural subgroups). This can be distinguished from cross-country inequality, which considers the inequalities between countries based on national averages (for example, comparing countries on the basis of national infant mortality rates). It is possible to make cross-country comparisons of within-country inequality. For example, countries could be compared based on the level of rural–urban inequality in infant mortality rate within each country.
1.5
How can health inequality monitoring lead to implementing
change?
Considerations for agenda setting
Extra information: Equity-based interventions
Interventions that are equity based seek to improve health outcomes in subgroups that are disadvantaged while, at the same time, improving the overall situation. Monitoring health inequalities helps to identify population subgroups that are underserved by health services and overburdened by morbidity or mortality; tracking national igures shows progress across the board.
In some cases, such as child health, there is evidence that targeting expansions in health services speciically towards the most disadvantaged may be more successful and cost effective than using limited resources to create across-the-board increases in services where they are not required by all.
Interventions that do not have an equity focus may inadvertently exacerbate inequalities, even when national averages indicate overall improvements. This happens when interventions fail to reach the most disadvantaged subgroups, and beneits are realized by other more advantaged subgroups. For example, media campaigns and workplace smoking bans are two types of interventions that showed evidence of increasing inequalities.
Read more:
Carrera C et al. The comparative cost-effectiveness of an equity-focused approach to child survival, health, and nutrition: a modelling approach. Lancet, 2012, 380(9850):1341–1351.
Lorenc T et al. What types of interventions generate inequalities? Evidence from systematic reviews. Journal of Epidemiology and Community Health, 2013, 67(2):190–193.
1. Health inequality monitoring: an overview 13 Developing strategies to tackle health inequalities often begins by considering what has
already been done in other environments, and whether previous successes are likely to be replicable in a new environment. This step should involve a systematic consideration of evidence to gather information about previous approaches to address a given problem. Experts with experience in the area may be consulted to offer suggestions and recommendations. After learning what has been done by others, decision-makers can begin to consider what might work in their situation. The more thorough the understanding of the situation at hand, the more appropriate a response can be developed.
Key stakeholders
In general, the process of implementing change should involve a diverse group of stakeholders, as appropriate for the health topic. There are several complementary approaches for improving equity in health. One such approach, which gained wide attention due to the World Health Organization’s Commission on Social Determinants of Health, is a multisectoral effort to tackle the “causes of causes”, or the social, economic and political factors that underlie the origins of inequities. Another approach entails focusing on what the health sector can do on its own, or by linking with other sectors.
Key stakeholders may include representatives from government, civil society, professional bodies, donor organizations, communities and any other interested group. Consulting with stakeholders helps to ensure a high degree of acceptability and “buy-in” across sectors, which ultimately promotes the success and longevity of a new policy, programme or practice. Because health and health inequality issues are indirectly related to many sectors and levels of government, they should be framed as broad problems; intersectoral approaches help to drive multifaceted solutions and garner the support of a wider community.
1.6
How are the social determinants of health related to
health inequality monitoring?
Extra information: Recommendations for promoting equity within the health sector
Recognize that the health sector is part of the problem.Health services do not, on their own, gravitate towards equity. Both public and private services contribute to generating inequalities in health if they are more accessible to the better off.
Prioritize diseases of the poor. When choosing which interventions to implement, an essential starting point is to match them closely to the local epidemiological proile of conditions affecting the poor. This requires assessing the burden of disease and allocating resources accordingly.
Deploy or improve services where the poor live. Because health services tend to be more accessible to the urban and better-off populations, there is a natural tendency for new interventions to reach them irst. Several recent examples show, however, that this logic can be subverted. Rather than introducing new interventions or programmes initially in the capital and nearby districts, countries can prioritize remote areas where mortality and malnutrition are usually highest.
Employ appropriate delivery channels.The same intervention may be delivered through more than one channel. For example, micronutrients or nutritional counselling may be delivered to mothers and children who spontaneously attend facilities, through outreach sessions in communities, or on a door-to-door basis. Either facility-based or community health workers may be used. Equity considerations are fundamental in choosing the most appropriate delivery channel for reaching the poorest families, who often live far away from the facilities and require community or household delivery strategies.
Reduce inancial barriers to health care. Out-of-pocket payments are the principal means of inancing health care in most of Africa and Asia. However, this often places extra burden on the sick, who are most likely to be poor, children or elderly. Such user fees would probably not have been instituted in most countries had equity considerations been high on the health agenda. Countries adopting a universal health system without any type of user fees, such as Brazil, have effectively removed inequities in access to irst-level health facilities.
Set goals and monitor progress through an equity lens. Progress towards equity depends on the continuous cycle of health inequality monitoring. Each component of the cycle can be strengthened and improved to match the goals of health equity.
Source:BasedonunpublishedworkbyCesarGVictora,FernandoCBarros,RobertWScherpbier,AbdelmajidTiboutiandDavidsonGwatkin.
Read more:
Bryce J et al. Reducing child mortality: can public health deliver? Lancet, 2003, 362(9378):159–164. Gwatkin DR, Bhuiya A, Victora CG. Making health systems more equitable. Lancet, 2004, 364(9441):1273–1280.
Marmot M. Achieving health equity: from root causes to fair outcomes. Lancet, 2007, 370(9593):1153–1163.
1. Health inequality monitoring: an overview 15 Actions to lessen the impact of the social determinants of health promote equity, and
thus reduce health inequalities. The Commission on Social Determinants of Health recommends three principles of action to achieve health equity:
• improve the conditions of daily life (the circumstances in which people are born, grow, live, work and age);
• tackle the inequitable distribution of power, money and resources – the structural drivers of the conditions of daily life – at global, national and local levels;
• measure the problem, evaluate action, expand the knowledge base, develop a workforce that is trained in the social determinants of health and raise public awareness about the social determinants of health.
The movement to garner support to address social determinants of health is inextricably linked to reducing health inequality and achieving health equity. Health inequality monitoring contributes to this end by providing data, direction and evidence.
Extra information: Readings about social determinants of health
Commission on Social Determinants of Health. Closing the gap in a generation: health equity through action on the social determinants of health. Final report of the Commission on Social Determinants of Health. Geneva, World Health Organization, 2008.
Marmot Review. Fair society, healthy lives: strategic review of health inequalities in England post 2010. London, Institute of Health Equity, 2010.
Highlights: Section 1
• The main steps of health inequality monitoring involve: (1) selecting relevant indicators and equity stratiiers for a given health topic; (2) obtaining data about health indicators and equity stratiiers; (3) analysing inequality between population subgroups; (4) reporting the results of the analysis; and (5) applying inequality measures to improve health-related policies, programmes and practices.
• Health inequities describe health differences that are unfair or unjust. Measuring and monitoring health inequalities shows objective differences in health, which can be used to evaluate and improve the state of health inequity in a population.
• Health inequality monitoring is important for all members of a population, for ethical and practical reasons. Integrating health inequality monitoring into agenda setting and decision-making can lead to reduced within-country health inequities and improved national health igures.
Read more:
Asada Y. A framework for measuring health inequity. Journal of Epidemiology and Community Health, 2005, 59(8):700–705.
Braveman P. Monitoring equity in health and healthcare: a conceptual framework. Journal of Health, Population and Nutrition, 2003, 21(3):181–192.
Braveman P. Monitoring equity in health: a policy-oriented approach in low- and middle-income countries. Geneva, World Health Organization, 1998.
Brownson RC, Gurney JG, Land GH. Evidence-based decision making in public health. Journal of Public Health, 1999, 5(5):86–97.
Commission on Information and Accountability for Women’s and Children’s Health. Country health information systems: a review of the current situation and trends. Geneva, World Health Organization, 2011.
Gakidou E, Fullman N. Monitoring health inequalities: measurement considerations and implications. Health Information Systems Knowledge Hub. Brisbane, University of Queensland, 2012.
Kawachi I, Subramanian SV, Almeida-Filho N. A glossary for health inequalities. Journal of Epidemiology and Community Health, 2002, 56(9):647–652.
Nolen LB et al. Strengthening health information systems to address health equity challenges. Bulletin of the World Health Organization, 2005, 83(8):597–603.
O’Donnell O et al. Analyzing health equity using household survey data. Washington, DC, World Bank, 2008.
Public Health Agency of Canada and World Health Organization. Health equity through intersectoral action: an analysis of 18 country case studies. Ottawa and Winnipeg, PHAC, and Geneva, World Health Organization, 2008.
Rockefeller Foundation Center. Measurement of trends and equity in coverage of health interventions in the context of universal health coverage. Meeting report, Bellagio, 17–21 September, 2012.
Wirth M et al. Monitoring health equity in the MDGs: a practical guide. New York, CIESIN and UNICEF, 2006.
2.Datasources 17
2. Data sources
Describing the state of health inequality in a population requires valid and reliable data, which are acceptable for use from an ethical and cultural standpoint. The infrastructure that collects and organizes data is important to consider, as its
strength will affect the merit of the data. Ideally, data for health monitoring should come from an information-producing system that has strong legitimacy, high-level political support and transparency, and includes policy, technical, academic and civil society constituencies. Sometimes health information infrastructure is created with the express purpose of collecting data for health monitoring, as is the case with large household surveys. Other times, data that are used for health monitoring are created for other purposes originally, but can also be applied for use in health monitoring.
Two intersecting types of data are necessary to monitor health inequalities: (a) health data; and (b) data describing a given dimension of inequality (such as wealth, education, region or sex). There are a variety of sources from which information in these two intersecting streams (health data and equity stratiiers) can be derived. This section presents various options for sources of data that can be used for inequality monitoring at a national level, along with their advantages, disadvantages and possibilities for improvement. At the end of this section, a four-step data source mapping process is detailed.
2.1
Data source types
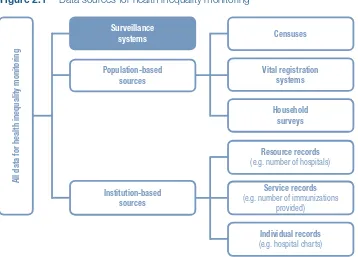
Figure 2.1 Data sources for health inequality monitoring
All data for health inequality monitoring
Surveillance systems
Population-based sources
Institution-based sources
Censuses
Vital registration systems
Household surveys
Resource records (e.g.numberofhospitals)
Service records (e.g.numberofimmunizations
provided)
Individual records (e.g.hospitalcharts)
Extra information: Surveillance systems
There are several types of surveillance systems. Outbreak disease surveillance systems aim to track cases of epidemic-prone diseases as well as their risk factors. Frequent reporting by health facilities, including laboratories, is the main source of data, but other sources are also used, such as media. Sentinel surveillance systems, in which a sample of clinics is used for intensiied monitoring, are used by several disease programmes, such as HIV and malaria. Risk factor surveillance is a term used to describe data collection and analysis in noncommunicable disease monitoring, and often focuses on data obtained through surveys. Finally, many low- and middle-income countries have established demographic surveillance sites. These sites have a longitudinal birth and death registration system for a local population where cause of death and other health-related data are often also collected.
Read more:
INDEPTH Network. Health equity.
2.Datasources 19
2.2
Population-based data sources
Censuses
Most countries now conduct population and household censuses every 10 years. In many countries, the census provides information on sex, socioeconomic status, race or ethnicity, age and geographical area, all of which can be used as equity stratiiers for inequality monitoring. These data are essential for determining the size of populations, and demographic characteristics of the subgroups within the population. This type of information is essential to ensure that survey data are representative of the entire population. However, the census is not usually health focused, and typically includes few health data. As a result, censuses may have limited utility for health inequality monitoring unless there is a means to link census data to other sources of health information (for example, using an individual’s social security number to link data from two different sources). Linkages often exist in high-income countries, but not in many low- and middle-income countries. Thus, the usefulness of census data may be limited to deriving demographic characteristics for various population subgroups.
One improvement that could be made to censuses in low- and middle-income countries in order to increase its utility for health inequality monitoring would be to include small-area identiiers, such as postal codes, to link with data from other sources. While individual-level identiiers would be ideal for providing such data linkages, small-area identiiers, if standardized across different data sources, could be more easily implemented and used for this purpose.
Vital registration systems
Vital registration systems (oficially called civil registration and vital statistics systems) record the occurrence of births, deaths, marriages and divorces in a population. In countries where these systems are functioning properly, they serve as the best and most reliable source for fertility, mortality and cause-of-death data. Countries that have strong vital registration systems can reliably determine and track mortality rates, life expectancies and causes of death at a population level. Additionally, vital registration systems often include information on geographical region, sex, and in some cases, education level and occupation; this provides necessary data about equity stratiiers that is useful for inequality monitoring.
Extra information: Global status of vital registration systems As of 2009, only 25% of the world population lived in countries where at least 90% of births and deaths are registered. Worldwide, only 34 countries (representing 15% of the global population) have high-quality cause-of-death data; 74 countries lack these data altogether. In many low- and middle-income countries, vital registration systems are far from complete, and have little utility for inequality monitoring. In the African Region of the World Health Organization, for example, 42 out of 46 countries reported having no death registration data.
World Health Organization. World Health Statistics 2012. Geneva, World Health Organization, 2012.
Expanding the coverage of existing vital registration systems is the single most important change that could improve the utility of vital registration systems for health inequality monitoring. If full coverage could be achieved with vital registration systems, including individual (or small-area) identiiers, cause of death, birth weight, gestational age and at least one socioeconomic stratiier, those systems would be quite useful for inequality monitoring.
Household surveys
Household surveys are currently the most common and overall most reliable data source for health inequality monitoring in low- and middle-income countries. Household surveys are conducted with the purpose of evaluating the status of a speciic topic (or topics) at a national level, and may be administered by countries, aid organizations, nongovernmental organizations or international organizations. Usually, household surveys cover a large number of indicators, all related to a similar theme, such as reproductive, maternal and child health, or nutrition.
2.Datasources 21 makes household surveys well-suited for use in health inequality monitoring. While
several low- and middle-income countries conduct their own household surveys, there are also an increasing number of multinational, multiround household survey programmes. The repeated rounds of these multinational surveys allow for the tracking of progress in inequalities over time; the inclusion of multiple countries allows for benchmarking between countries using comparable data methodologies.
By design, household surveys draw information from a sample of the population rather than each individual within the population. The uncertainty inherent in the estimation process of describing an entire population based on a sample of the population can be exacerbated in the course of health inequality monitoring, as the total sample is divided into several subgroups. While household surveys are generally designed to have suficient sample size to draw precise conclusions about the overall population, they are not necessarily designed with the purpose of having suficient sample sizes in all subgroups. If it is anticipated that the survey will have a low sample size in a certain subgroup, the design may compensate by oversampling. This may involve drawing larger samples from certain minority groups, regions, education levels, age groups or other categories, though these subgroups may represent a relatively small proportion of the overall population.
Household surveys could be improved for use in inequality monitoring through regular repetition and harmonization of questions across countries. Additionally, increasing sample sizes could improve the capacity for use in inequality monitoring.
Extra information: Examples of multinational household survey programmes
Survey name Organization Website
AIDSIndicatorSurvey(AIS) UnitedStatesAgencyforInternationalDevelopment http://www.measuredhs.com/What-We-Do/Survey-Types/ AIS.cfm
DemographicandHealthSurvey
(DHS) UnitedStatesAgencyforInternationalDevelopment http://www.measuredhs.com/
LivingStandardsMeasurement
Study(LSMS) WorldBank http://go.worldbank.org/IPLXWMCNJ0
MalariaIndicatorSurvey(MIS) UnitedStatesAgencyforInternationalDevelopment http://www.malariasurveys.org/
MultipleIndicatorClusterSurvey
(MICS) UnitedNationsChildren’sFund http://www.unicef.org/statistics/index_24302.html StudyonGlobalAgeingand
AdultHealth(SAGE) WorldHealthOrganization
http://www.who.int/healthinfo/
systems/sage/en/
2.3
Institution-based data sources
Institution-based data sources produce administrative data in the course of government and health system activities. Examples of administrative data include the many institutional records that exist for individuals, such as medical charts, police records, employment records and school records. Institution-based data sources also include the internally-kept records describing the activities of institutions, such as health facility resource records that contain district-level information about the personnel deployed in a given region, or the records of services delivered, for example, number of vaccines given or number of bednets distributed. These data sources tend to be numerous, and provide detailed data at the community level. Data from institution-based sources may relect any component of the monitoring, evaluation and review framework; health indicators that are listed in the inputs and processes component are often derived from institution-based data sources.
2.Datasources 23
Extra information: Data availability in low- and middle-income countries
Because of the large reliance on household survey data, health inequality monitoring in low- and middle-income countries is limited to the health indicators for which data are available. Often there is a focus on two components of the monitoring, evaluation and review framework: the outcomes component (for example, coverage of health interventions) and the impact component (with an emphasis on health status indicators, such as mortality and morbidity). Because health indicators related to inputs and processes, and outputs are generally collected from institution-based sources, the inclusion of these indicators in health inequality monitoring in low- and middle-income countries is uncommon.
Thus, certain health topics might be challenging to monitor in low- and middle-income countries due to a lack of data. However, there are occasionally studies in low- and middle-income countries that are speciically dedicated to cover these oft-neglected topics. As detailed in the references below, Li et al. (2012) provide examples of health inequality reporting using impact indicators related to inancial risk protection in China, and Sousa, Dal Poz and Carvalho (2012) report health inequalities in Brazil using inputs and processes indicators related to the health workforce.
Read more:
Li Y et al. Factors affecting catastrophic health expenditure and impoverishment from medical expenses in China: policy implications of universal health insurance. Bulletin of the World Health Organization, 2012, 90(9):664–671.
Sousa A, Dal Poz MR, Carvalho CL. Monitoring inequalities in the health workforce: the case study of Brazil 1991–2005. PLoS One, 2012, 7(3):e33399.
2.4