Synthesis and Characterization of Zn
1-xMn
xO Nanoparticles by
Coprecipitation Method
Pelangi Eka Yuwita
1, a, Sri Yani Purwaningsih
1, b, and Darminto
1, c1
Departement of Physics, Faculty of Mathematics and Natural Sciences
Institute Teknologi Sepuluh Nopember
a
[email protected], b [email protected], c [email protected]
Keywords: Synthesis, Coprecipitation, Nanoparticle, ZnO
Abstract. Zinc Oxide Nanoparticles are materials that are developed in the nanotechnology today, because it has mechanical properties, electrical, and optical applicable to such conversion solar cells, thin-film UV protection, and gas sensors. To produce Zinc Oxide nanoparticles materials there are many ways including wet chemical methods, sol-gel, spray pyrolysis, physical vapor deposition, solvothermal, and hydrothermal [1]. Previous research has been done to synthesize ZnO
nanoparticles by coprecipitation method. Synthesis and characterization Zn1-xMnxO nanoparticles by
coprecipitation method. This study is an extension of previous research. The study was conducted by using a powder material Dyhidrat Zinc Acetate, Mangan powders, solvents HCl, and NH4OH
precipitating agent was stirred for 1 h at 65 ºC and then heated in air at 100 ºC and annealed 400 ºC [2].
Zn1-xMnxO nanoparticle synthesis performed with the variation of Mn doping (x=0,00, 0,01, 0,02,
0,03) to the solution precursor. Characterization testing performed using X-ray diffraction (XRD) and Scanning Electron Microscopy (SEM). XRD data analysis performed using the Match software, X'Pert High Score Plus (HSP), and Material Analysis Using Diffraction (MAUD) and the analysis of crystal size by Scherrer method. The results showed that the Zn1-xMnxO successfully synthesized.
X-ray diffraction patterns suggest that Mn2+ ions were successfully incorporated into the lattice
position of Zn2+ ions in ZnO host. Doping variations that have smaller radii than parent effect on the
crystal lattice parameters. Lattice parameters of Zn1-xMnxO produced decreased with increased
doping Mn2+ are given. Decrease in the lattice parameter caused the smaller volume of the crystal
cell. With the diminution of the volume of the crystal causes the crystal size is getting smaller.
Introduction
Nanoparticle Zinc Oxide is one of the nanoparticle semiconductor material which has been developed recently . Zinc Oxide Nanoparticles been developed in the field of nanotechnology because it has mechanical properties, electrical, and optical which can be applied to them for solar cells, catalysts, thin film UV protector, gas sensors, etc.. Zinc oxide nanoparticles have many ways to synthesize them with wet chemical methods, sol-gel, spray pyrolysis, physical vapor deposition, solvotermal , and hydrothermal.[1,2,3]
Coprecipitation method is one method of synthesis of inorganic compounds based on the deposition of more than one substance together when passing through the point of saturation . Coprecipitation method uses a low temperature in the process and can produce particle small size. So expect from this coprecipitation method produced smaller particle size and more homogeneous than the solid state method .
In a previous study conducted by R. Nurul synthesis ZnO used coprecipitation method. In the synthesis of ZnO is successfully performed using low temperatures and using variations of temperature , pH, and duration of stirring . This synthesis is an extension of previous studies which use temperature high enough to obtain ZnO nanoparticles.
In the present study will be conducted through the synthesis of Zn1 – xMnxO coprecipitation
method. Given by the variation of Mn doping (x= 0,00, 0,01, 0,02, 0,03) in the ZnO precursor.
agent. Characterization is done with some testing that is testing X-ray diffraction ( XRD ) and Scanning Electron Microscope test ( SEM ). The output of the X - Ray Diffractometry analyzed using
the software Match ! for phase identification, MAUD ( Materials Analyzing Using Diffraction ) to
identify the size of the crystal phase in the sample , and Reitica to determine the crystal size or particle
size.
In result Lattice parameters a, b, and c change with increasing doping , although the difference
is very small. Due to a shift in the lattice, indicating that the doping Mn2 +has entered the parent
compound ZnO and replaced most position of Zn2 +ions on the composition of the compounds Zn
1 –
xMnxO.
Methods
The materials used in this study are powder Zinc Acetate Dihydrate [ Zn(CH3COO)2.2H2O]
(Merck), powder of pure Manganese (Mn) (Merck), HCl (Merck), and a solution of ammonium hydroxide (Merck).
The first process of the dissolution of the powder [Zn(CH3COO)2.2H2O] and pure Mn
powder with each composition (x = 0.00, 0,01, 0,02, 0,03) conducted by adding 37 % HCl solution that has been diluted into 0.5 M HCl solution with stirring Forum using a magnetic stirrer with a temperature of 48 °C treatment. Then, the addition of 0.5 M NH4OH solution little by little (titration), so the solution mixed. After the precursor solution pH was tested using a test paper (universal
indicator). The addition of concentrated NH4OH solution with a pH titration method to achieve the
desired precursor solution (pH 9). After the precursor solution is at the desired pH , then the next step is the precursor solution was stirred using a hot plate while. After filtering the precipitate was formed. After the precipitate formed was filtered washed with a solution of distilled water and drying process is carried out in an oven with a temperature of 100 °C for 15 hours. Then performed with the calcination temperature of 400 °C for 3h.
Result and Discusion
1. XRD diffraction patterns of Zn1 – xMnxO results (x = 0, 0,01, 0,02, 0,03)
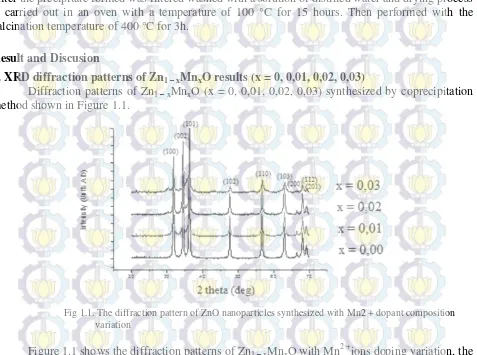
Diffraction patterns of Zn1 – xMnxO (x = 0, 0,01, 0,02, 0,03) synthesized by coprecipitation
method shown in Figure 1.1.
Fig 1.1. The diffraction pattern of ZnO nanoparticles synthesized with Mn2 + dopant composition variation
Figure 1.1 shows the diffraction patterns of Zn1 – xMnxO with Mn2 +ions doping variation, the
The results of the analysis with the software Match ! In accordance with the data PDF ( Powder
Diffraction File ) 00-079-0208 of ZnO phase seen that the inorganic phase is formed Zinc Oxide (ZnO) is hexagonal shaped with Zincite crystal structure.
From Figure 1 the results obtained diffraction peaks conformance with the database ZnO on (hkl) (100), (002), (101), (102), (110), (103) , (200), (112), and (201) which occupies the location of
2θ = 31,91º , 34,58 º, 36,38 º, 47,68 º, 56,73 º, 63,01 º, 66,50 º, 68,07 º and 69,23 º . Furthermore, it
appears also a shift in the lattice parameter. This indicates the success of doping Mn2 +entry in the
parent compound ZnO .
From the results of research conducted diffraction pattern of a shift in the lattice parameter .
For the analysis of the shift of the lattice on the sample Zn1 – xMnxO used Reitica software . In Table 1
are given the results of the analysis of the lattice parameters of the samples Zn1 – xMnxO using Reitica.
Table 1. Results of lattice parameters by the Reitica analysis
Lattice parameters x = 0,00 x = 0,01 x= 0,02 x = 0,03
a=b (Å) 3, 2518 3,2598 3,2512 3,2509
c (Å) 5,2062 5,2172 5,2056 5,1961
α=β (o) 90 90 90 90
γ (o) 120 120 120 120
Lattice parameters a, b , and c change with increasing doping, although the difference is
very small. Due to a shift in the lattice , indicating that the doping Mn2 + has entered the parent
compound ZnO and replaced most position of Zn2 +ions on the composition of the compounds Zn1 –
xMnxO. It also can be explained by reviewing the ionic radii of Mn2 + (r=0,91 Å) is larger than the
radius of Zn2 +ion (r=0,74 Å) because dopant ionic radius is smaller, resulting in cell volume of the
compound material will also change. Changes in the lattice parameters a, b , and c are not regular because it is in the form of hexagonal lattice of ZnO not be cubic. The shift in the lattice parameter of each graph is shown in Figure 1.1. shows most of the shift towards the left.This is because the radius
of the dopant ion Mn 2 + is greater than the radius of Zn2+ ions. But look at the graph with the
composition of dopant Mn (x=0,03) the shift is not seen, this is due to the difficult nature of Mn has to substitute into a compound and the nature of the coordination number of Mn which has more than one. At the peak of the graph is the graph looks widened, this is due to the greater number of dopants, but given the size of the crystals can be changed.
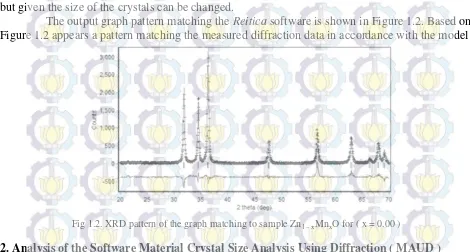
The output graph pattern matching the Reitica software is shown in Figure 1.2. Based on
Figure 1.2 appears a pattern matching the measured diffraction data in accordance with the model
Fig 1.2. XRD pattern of the graph matching to sample Zn1 – xMnxO for ( x = 0.00 )
2. Analysis of the Software Material Crystal Size Analysis Using Diffraction ( MAUD )
The wider the diffraction peaks , the crystal size will be smaller . For the analysis of crystal size on the
sample Zn1 – xMnxO used software MAUD.
Example plot smoothing the measured data samples Zn1 – xMnxO with x = 0,00 is shown in
Figure 2.1. From the results of the matching between the calculated diffraction pattern with diffraction patterns obtained measured value output smoothing results on any smoothing parameters . The results of the analysis with MAUD smoothing performed on samples of ZnO can be declared acceptable if the Sig < 2 % .
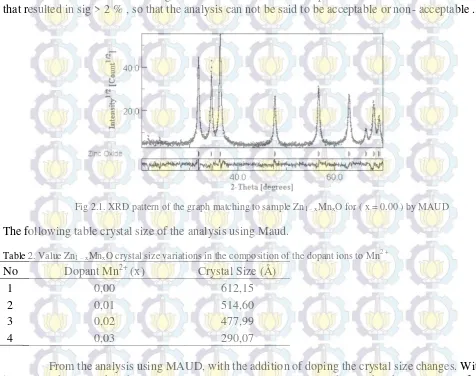
The output graph pattern matching the MAUD software is shown in Figure 2.1. Based on Figure 2.1 appears a pattern matching the measured diffraction data according to the model. Of all the measured diffraction data matching with the model are not all acceptable. There is some research data that resulted in sig > 2 % , so that the analysis can not be said to be acceptable or non- acceptable .
Fig 2.1. XRD pattern of the graph matching to sample Zn1 – xMnxO for ( x = 0.00 ) by MAUD
The following table crystal size of the analysis using Maud.
Table 2. Value Zn1 – xMnxO crystal size variations in the composition of the dopant ions to Mn2 +
No Dopant Mn2+ (x) Crystal Size (Å)
1 0,00 612,15
2 0,01 514,60
3 0,02 477,99
4 0,03 290,07
From the analysis using MAUD, with the addition of doping the crystal size changes. With increasing doping makes the smaller crystal size. Large crystal size indicates that the crystal is perfect and has a high diffraction peaks. If the Mn dopant is too large given the parent compound ZnO crystals can make and break the crystal size becomes small due to the addition of more doping and size of ionic radii of dopant also greater. Causing the diffraction peak and decline widened.
0.00 0.01 0.02 0.03
Fig 2.2. The relationship between variation graph Mn2 + doped with Crystals Size
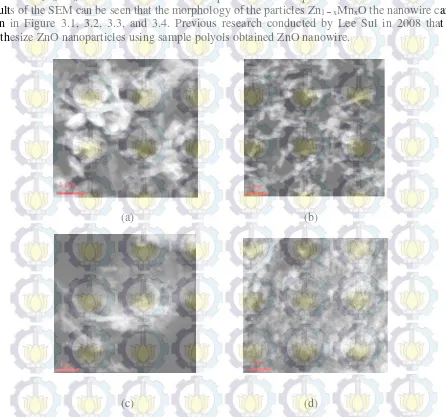
3. Results of Scanning Electron Microscopy ( SEM )
Scanning Electron Microscopy Testing is performed to determine the morphology of the
particles Zn1 – xMnxO with variations in the composition of the dopant ions Mn2 +. Based on the test
results of the SEM can be seen that the morphology of the particles Zn1 – xMnxO the nanowire can be
seen in Figure 3.1, 3.2, 3.3, and 3.4. Previous research conducted by Lee Sul in 2008 that can synthesize ZnO nanoparticles using sample polyols obtained ZnO nanowire.
(a) (b)
(c) (d)
Fig 3.1. SEM with a magnification 27.500 times of composition Zn1 – xMnxO (a) dopant ions Mn2 + (x=0,00) (b) dopant
From the SEM results indicated that the more a given Mn dopant composition, morphology produced
more subtle. This is because the particle size of Zn1 – xMnxO getting smaller with increasing doping.
Summary
Based on the results of the study entitled " Synthesis of Nanoparticles Zn1 – xMnxO by
Coprecipitation Method " it can be concluded that the synthesis of Zn1 – xMnxO nanoparticles have
been successfully carried out. There was a shift in the lattice parameters so that the resulting
diffraction pattern can be indicated that the success of doping Mn2 + entry in the parent compound
ZnO . Increasing Mn2 + dopant ions in Zn1 – xMnxO cause a decrease in crystal size.
References
[1] S.W. Jung, S.J. An, G.C. Yi, Appl. Phys. Lett. 80 (2002) 4561 [2] K.J Kim, Y.R. Park, J. Apll. Phys. 8 (2002) 1420
[3] Liu, Zhifeng, Zhengguo Jin, Wei Li, and Jijun Qiu., Preparation of ZnO Porous Thin Films by
Solgel Method Using PEG Template., Materials Letters 59, no. 28 (December 2005): 3620–3625.