Journal of Physics: Conference Series
PAPER • OPEN ACCESS
Development of Low Sidelobe Level Array
Antenna for Synthetic Aperture Radar Sensor
To cite this article: Yohandri et al 2018 J. Phys.: Conf. Ser.1040 012052
View the article online for updates and enhancements.
Related content
Influence of Electric Field Distribution on High-Power Array Antenna Radiation Pattern with Rectangular Aperture
Yang Yi-Ming, Yuan Cheng-Wei and Qian Bao-Liang
-Low-Crosstalk Acoustooptic Wavelength Filter Composed of Cascaded Dissimilar Mode Converters
Hideaki Okayama and Takeshi Kamijoh
-Correction of failure in antenna array using matrix pencil technique
SU Khan and MKA Rahim
1234567890 ‘’“”
International Conference on Mathematics and Natural Sciences (IConMNS 2017) IOP Publishing
IOP Conf. Series: Journal of Physics: Conf. Series 1040 (2018) 012052 doi :10.1088/1742-6596/1040/1/012052
Development of Low Sidelobe Level Array Antenna for
Synthetic Aperture Radar Sensor
Yohandri1, Yulkifli1 and J T S Sumantyo2
1
Physics Department, Faculty of Mathematics and Natural Science, Universitas Negeri Padang, Jl. Prof. Hamka, Padang, Sumatera Barat, Indonesia 25131
2Microwave Remote Sensing Laboratory, Center for Environmental Remote Sensing,
Chiba University, 1-33, Yayoi Cho, Inage Ku, Chiba Shi, Chiba, Japan 263-8522
E-mail: [email protected]
Abstract. The radiation pattern of the array antenna is an important characteristic in the synthetic aperture radar (SAR) sensor to maintain the quality of the images. In this work, an array antenna consists of five elements square microstrip antenna (SMA) having a low sidelobe level for SAR sensor is presented. The proposed antenna is designed to propagate in circular polarization with a corner-truncated technique. The low sidelobe level is obtained by implementing the Chebyshev polynomial to distribute the power to each element of the patch. For five elements square array antenna, the simulated axial ratio bandwidth (<3 dB) of about 11.2 MHz (0.88 %), which is consistent with the measured fabricated model of 10.5 MHz (0.83 %). The maximum sidelobe levels of the proposed antenna for measurement and simulation are about 20.0 dB and 21.5 dB, respectively. The both measured and simulated results are in line with the theoretical design made by using Chebyshev polynomial of 20 dB. The low side lobe level and reasonable axial ratio bandwidth indicate the antenna is satisfying the specifications of SAR sensor.
1. Introduction
A Synthetic Aperture Radar (SAR) sensor has played an important role in current remote-sensing technology. Various applications such as land mapping, land use, oceanography, and disaster monitoring are the implementing of this technology. Even further, the SAR sensor can be operated to measure the changing in the earth surface to millimeter accuracy [1]. As compare with the detection radar, the SAR sensor has a complex system due to the image generating as a result. In image construction, the SAR system receives the back scattering signal from the object or target area. The radiation pattern of the array antenna is an important characteristic in the synthetic aperture radar (SAR) sensor to maintain the quality to the images.
2
1234567890 ‘’“”
International Conference on Mathematics and Natural Sciences (IConMNS 2017) IOP Publishing
IOP Conf. Series: Journal of Physics: Conf. Series 1040 (2018) 012052 doi :10.1088/1742-6596/1040/1/012052
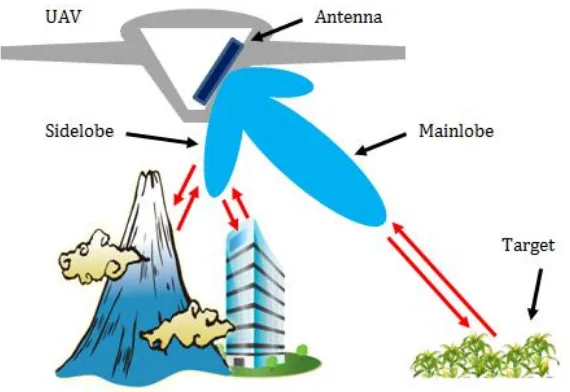
Figure 1. Illustration of the sidelobe effect on the data recording.
In previous work [3]–[6] several arrays antenna has been developed for the SAR sensor. The performance of the antenna, however, was not satisfactory in terms of the sidelobe level. In general, the high sidelobe is found in radiation pattern of the antenna with the sidelobe level of 12 dB. The sidelobe effect can be overcome by managing the difference between sidelobe and main lobe higher. Therefore, the compression of the sidelobe is obligatory for be done to avoid an error in recording data of the SAR sensor.
The purpose of this work is to present the development of low sidelobe level array antenna for SAR sensor. The low sidelobe level is obtained by arranging the power distribution of each element of the radiator. A Chebychev polynomial is adopted to distribute the power in the feed network of the proposed antenna. The coefficients of excitation are implemented in managing the weight of the power divider in the fed network in reduction the sidelobe level. The five elements Square Microstrip Antennas (SMA) are arranged in 1x5 array configuration and designed for of 20 dB sidelobe level. A corner truncated and proximity fed method are employed in generating the circular polarization. The circular polarization is beneficial since the future SAR requires a sensor that insensitive to Faraday rotation effect and produces more information from the target. The proposed antenna is operated in L-Band (1.27 GHz) and planned to be installed onboard an Unmanned Aerial Vehicle (UAV). In next section, the description of the SAR sensor will be presented. The design of proposed antenna and research result will be discussed in section three and four, respectively. Finally, the conclusion from this work will be presented in the last section.
2. SAR Sensor
1234567890 ‘’“”
International Conference on Mathematics and Natural Sciences (IConMNS 2017) IOP Publishing
IOP Conf. Series: Journal of Physics: Conf. Series 1040 (2018) 012052 doi :10.1088/1742-6596/1040/1/012052
Figure 2. Block diagram of SAR sensor.
Based on the Figure 2, the antenna is operated as transmitter and receiver the electromagnetic wave. In the SAR system, the characteristics of the antenna are similar for both transmitter and receiver. In terms of power, the transmitter antenna is working with high power, while the receiver antenna with low power since receives the reflected signal from the target.
3. Antenna Design
3.1. Power Distribution
The power distribution of each element of the array antenna is calculated based on uniform space (d =
0/2) and sidelobe level of 20 dB. The excitation coefficient is used to arrange the power ratio in the feed network. The Array Factor (AF) for five elements array (P = 5, M = 2) can be derived as [8].
AF (u) = a1 + a2 cos 2u + a3 cos 4u (1)
In here, u = 2 (d/) cos , for uniform spaced (d = /2) then u can be simplified as u = cos . The excitation coefficient of the array factor for five elements antenna can be obtained by substituting the Chebyshev polynomial and AF can be expressed as
AF (u) = 1 + 1.5022 cos 2u + 0.4317 cos 4u (2)
3.2. Geometry Design
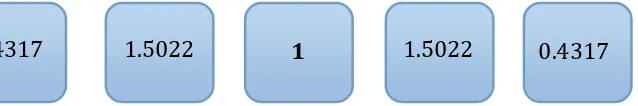
Five elements square microstrip antenna with corner truncated and proximity feed are employed in the proposed antenna. The power ratio in a corporate feed network is configured based on the array factor calculation. Figure 3 is shown the illustration of the power distribution to each element.
Five elements square microstrip antenna with corner truncated and proximity feed are employed in the proposed antenna. The power ratio in a corporate feed network is configured based on the array factor calculation. Figure 3 is shown the illustration of the power distribution to each element.
Figure 3. Power distribution for each patch.
1
1.5022
0.4317
4
1234567890 ‘’“”
International Conference on Mathematics and Natural Sciences (IConMNS 2017) IOP Publishing
IOP Conf. Series: Journal of Physics: Conf. Series 1040 (2018) 012052 doi :10.1088/1742-6596/1040/1/012052
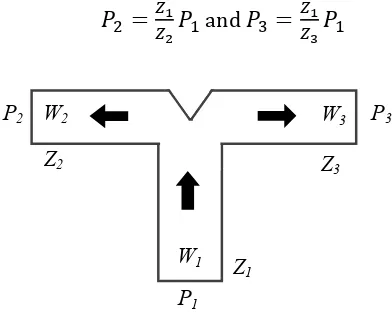
The T junction power divider is implemented at the feed network as presented in Figure 4. In Figure 4, the input power P1 is delivered to the intersection on a microstrip of width W1 and impedance
Z1. The line then branches into two arms with power, width and impedance given by P2, W2, Z2 and P3,
W3, Z3, respectively. The power on each arm can be obtained using the equations
and
Figure 4. T Junction power divider.
The power distribution based on the excitation coefficient of the array factor can be realized in a corporate feed network as shown in Figure 5. In this Figure, the A, B and C T Junction are operated for dividing the source power as illustrated in Figure 4. The power dividing ratio each T junction is listed in Table 1.
A
B
A
C
Figure 5. Geometry design of the Chebyshev array antenna.
Table 1. The power dividing ratio of the T Junction.
T Junction P2 P3 Ratio (P2/P3)
C 1.5022+0.4317 1+1.5022+0.4317 0.66
B 1 1.5022+0.4317 0.52
A(right) 1.5022 0.4317 3.48
A(left)(mirror A right) 0.4317 1.5022 0.29
In this work, a Nippon Pillar substrate (NPC-H220A) is employed having a thickness 1.6 mm, a dielectric constant r = 2.17 and a loss tangent = 0.0005. The photograph of fabricated feed network
and the patches are shown in Figure 6 and 7, respectively. Z1 W1
P1
Z3 W3 P3
1234567890 ‘’“”
International Conference on Mathematics and Natural Sciences (IConMNS 2017) IOP Publishing
IOP Conf. Series: Journal of Physics: Conf. Series 1040 (2018) 012052 doi :10.1088/1742-6596/1040/1/012052
Figure 6: Power distribution on fabricated feed network
Figure 6. Power distribution on fabricated feed network.
Figure 7. Photograph of fabricated 1x5 corner-truncated SMA.
4. Result and Discussion
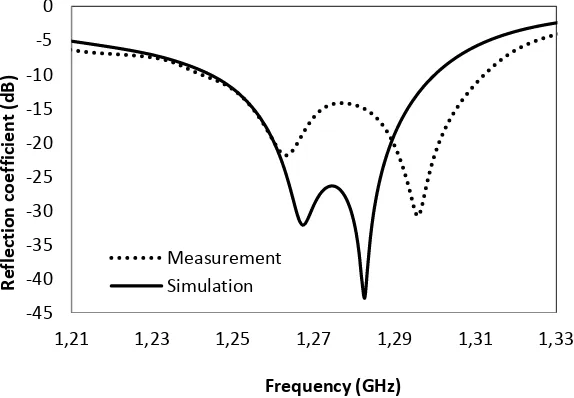
Figures 8 to 11 shows the characteristics of the proposed antenna. In Figure 8, simulated and measured the reflection coefficient (S11) as a function of frequency is plotted. The return losses at 1.27 GHz are lower than 29.21 dB and 16.29 dB in the simulation and the measurement, respectively. Such degradation is probably caused by the transitions mismatch. The measured S11 characteristics show slightly broadened characteristics from 1.242 GHz to 1.312 GHz of 5.51%. Meanwhile, the simulated S11 shows slightly narrower than measured result ranging from 1.244 GHz to 1.300 GHz.
Figure 8. Reflection coefficient plotted as a function of frequency. -45
1,21 1,23 1,25 1,27 1,29 1,31 1,33
6
1234567890 ‘’“”
International Conference on Mathematics and Natural Sciences (IConMNS 2017) IOP Publishing
IOP Conf. Series: Journal of Physics: Conf. Series 1040 (2018) 012052 doi :10.1088/1742-6596/1040/1/012052
The polarization characteristic of the antenna is shown through the axial ratio (AR) as presented in Figure 9. The AR characteristics are slightly shifted to the higher frequency end, but the bandwidth remains almost the same in both simulation and measurement. A simulated axial ratio bandwidth of 0.9% is obtained from 1.264 GHz to 1.275 GHz where the measured results show a bandwidth of 0.83% from 1.268 GHz to 1.278 GHz.
Figure 9. Axial ratio (AR) plotted as a function of frequency.
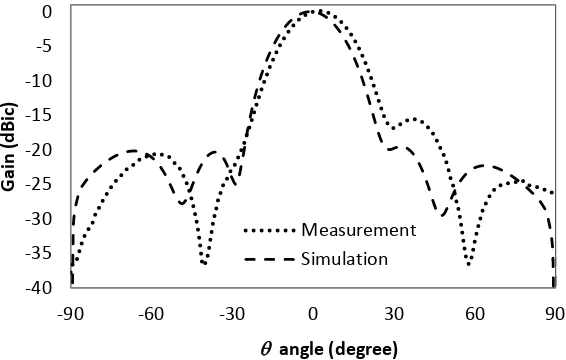
The performances of the antenna in terms of gain and sidelobe level are presented in Figure 10 and Figure 11. A maximum gain of 11.9 dBic in simulation and 10.4 dBic in measurement is obtained. Figure 11 shows the sidelobe level in radiation pattern of the antenna at the theta plane. The good agreements between calculation, simulation and measurement result are presented. The 3 dB beamwidth for calculation, measurement and simulation are 24, 23 and 22.25 degrees, respectively. The first side lobe appears at -36o and 32.4o with sidelobe level 20.8 dB and 19.5 dB for the simulation, for the measured are -58.7o and 36o with side lobe level 20.5 dB and 15.5 dB, respectively.
Figure 10. Relationship between antenna gain and frequency at angle of 0o. 0
1,24 1,25 1,26 1,27 1,28 1,29 1,30
A
1,24 1,25 1,26 1,27 1,28 1,29 1,30
1234567890 ‘’“”
International Conference on Mathematics and Natural Sciences (IConMNS 2017) IOP Publishing
IOP Conf. Series: Journal of Physics: Conf. Series 1040 (2018) 012052 doi :10.1088/1742-6596/1040/1/012052
Figure 11. Normalized radiation pattern of the array antenna in the theta plane (x – z plane) at f = 1.272 GHz.
5. Conclusion
In conclusion, the low sidelobe level array antenna for synthetic aperture radar sensor is designed and comprehensively characterized by simulation and experiment in 1.27 GHz centre frequency (L-band). Simulation results exhibit that proposed antenna can operate at low sidelobe level, which is in good agreement with the experiments. Moreover, the fabricated antenna has shown good performance in terms of return losses and axial ratio. This low sidelobe level and good properties of the array antenna is satisfying the requirements for a SAR sensor.
References
[1] Sri Sumantyo J T, Shimada M, Mathieu P P and Abidin H Z 2012 IEEE Trans. Geosci. Remote Sens.50 (1) 259–270
[2] Baharuddin M Z, Izumi Y, Sumantyo J T S and Yohandri 2016 IEICE Trans. Electron.E99.C
(10) 1174–1181
[3] Yohandri V, Wissan I, Firmansyah P, Rizki Akbar J T, Sri Sumantyo and Kuze H 2011 Progress In Electromagnetics Research C19 119-133 doi:10.2528/PIERC10121708
[4] Hussein M, Yohandri, Sri Sumantyo J T and Yahia A 2013 Journal of Electromagnetic Waves
and Applications27 (15) 1931-1941 https://doi.org/10.1080/09205071.2013.828577
[5] Yohandri, Asrizal and Sumantyo J T S 2016 Design of tilted beam circularly polarized antenna for CP-SAR sensor onboard UAV, in 2016 International Symposium on Antennas and Propagation (ISAP) pp. 658–659
[6] Yohandri, Sri Sumantyo J T and Kuze H 2011 Circularly polarized array antennas for synthetic aperture radar in Progress in Electromagnetics Research Symposium pp 1244–1247
[7] Koo V C, et al. 2012 Progress In Electromagnetics Research122 245-268