Zenoss Core Network and
System Monitoring
A step-by-step guide to configuring, using, and adapting
the free open-source network monitoring system
Michael Badger
Copyright © 2008 Packt Publishing
All rights reserved. No part of this book may be reproduced, stored in a retrieval system, or transmitted in any form or by any means, without the prior written permission of the publisher, except in the case of brief quotations embedded in critical articles or reviews.
Every effort has been made in the preparation of this book to ensure the accuracy of the information presented. However, the information contained in this book is sold without warranty, either express or implied. Neither the author, Packt Publishing, nor its dealers or distributors will be held liable for any damages caused or alleged to be caused directly or indirectly by this book.
Packt Publishing has endeavored to provide trademark information about all the companies and products mentioned in this book by the appropriate use of capitals. However, Packt Publishing cannot guarantee the accuracy of this information.
First published: June 2008
Production Reference: 1060608
Published by Packt Publishing Ltd. 32 Lincoln Road
Olton
Birmingham, B27 6PA, UK.
ISBN 978-1-847194-28-2
www.packtpub.com
Credits
Author
Michael Badger
Reviewers
Mark Turner
Matt Ray
Mark Hinkle
Erik Dahl
Acquisition Editor Bansari Barot
Technical Editor Usha Iyer
Editorial Team Leader Akshara Aware
Project Manager
Abhijeet Deobhakta
Project Coordinator Zenab Kapasi
Indexer
Monica Ajmera
Proofreader Camille Guy
Production Coordinator Shantanu Zagade
Foreword
As the world becomes more connected, the complexity of information technology is expanding. Information workers rely on an expanding number of technologies to collaborate: email, instant messaging, web forums, and wikis. Organizations that at one time relied solely on paper are becoming more dependent on information systems. In addition there is an increase in network-enabled devices including security systems, building environmental controls, power meters, and more. IT administrative staffers are responsible for a growing number of services and the IT fabric used by organizations is continuing to become more intricate.
The way we develop technology is also changing. Highly skilled programmers once wrote their code secretly behind closed doors. This is the old way of doing things Today millions of people develop, distribute, and use open-source software that is produced collaboratively over the Internet. The new model thrives on user input and collaboration. It enables the users of software to take control and become produces of technology the barrier for participation has been lowered.
The trends of open source software use and a growing complexity in information technology have lead to the perfect storm for the adoption of open source systems management. It's no longer good enough to have tools that are purpose-built. It's just as important to have management tools that are easy to deploy, easy to use, and easy to integrate with existing systems. This presents an opportunity for system and network administrators to deploy open source systems management tools that can be adapted to an ever-changing environment.
users of the software to have full access, not just to run the program, but also to modify and redistribute it. This freedom is one reason that Zenoss' popularity has risen so quickly. Zenoss Core presents a unique opportunity for systems management professionals, as it is enterprise-grade software but also free and open source.
In true open-source fashion, this book was not written by Zenoss project members or Zenoss Inc. employees. It was authored by one of our community members who was passionate about our software and took it upon himself to share his knowledge. We are very proud that our software generates that kind of enthusiasm and hope that our efforts and the efforts of our community of users are evident as you use Zenoss Core.
Mark R. Hinkle
About the Author
Acknowledgement
I'd like to thank Mark Hinkle for connecting me with Packt Publishing and helping me get this book started. You believe in my writing and my work ethic, and for that, I can only say thank you. I am honored to call you my friend.
Thank you, Zenoss, Inc., for providing me with support in the way of training and resources. Chet Luther, your superb training and support accelerated my Zenoss learning curve dramatically. Thank you, Drew Bray, for providing some documentation to help me get started in my research.
Bill Karpovich and Erik Dahl, I enjoyed our conversations. Of course, without Erik I wouldn't have a software application to write about. Thank you.
I owe a special thank you to my primary reviewers, Mark Turner and Kells Kearney. I appreciate every last comment you provided to me, and have no doubt that your work has improved the quality of this book. Mark, it has been a pleasure to work with you again, and I hope that we can collaborate on future projects. Kells, thank you for accepting my invitation to review, and I look forward to working with you in the future.
I'd like to thank my writing mentor, Charles Kemnitz, for preparing me to write my first book. Your guidance and disciplined advice gave me the confidence to know that once I started writing, I would finish.
About the Reviewer
Table of Contents
Preface
1
Chapter 1: Introduction
7
What is Zenoss? 7
Web Portal 8
Device Management 9
Availability and Performance Monitors 10
Event Management 13
System Reports 13
Zenoss Inc. 13
Summary 14
Chapter 2: System Architecture
15
User Layer 16
Data Layer 17
Collection Layer 18
Device Management 19
Performance And Availability 20
Event Information 22
Summary 23
Chapter 3: Installation and Set up
25
Server Specifications 26
Supported Operating Systems 26
Zenoss Dependencies 27
Quick Start with Virtual Appliance 27
Install Virtual Appliance 28
Working with The Virtual Appliance 29
Binary Installation 31
Source Installation 32
System Setup for Source Install 33
Download Zenoss Source 34
Build And Install Zenoss 35
Server Setup 36
Start Zenoss at Boot Time 36
Firewall Policies 37
SNMP on Linux 39
Install SNMP on Linux 39
WMI And SNMP on Windows 40
Summary 42
Chapter 4: The Zenoss User Interface
43
Welcome to Zenoss 43
Navigation Techniques 44
User Accounts 47
Main Views 47
Locations with Google Maps 49
Device Issues 49
Zenoss Issues 50
Watch List 50
Root Organizers 51
Production State 51
Browse By Organizers 52
Locations 53
Systems And Groups 55
Networks 56
Inheritance 60
Classes 61
Set Device Properties 64
Summary 66
Chapter 5: Device Management
67
Add Devices 67
Device Status 71
Device Administration 74
Lock Or Unlock Device 74
Rename A Device 75
Reset IP Address 76
SNMP Collector Plug-ins 83
Model Device 84
SSH Modeling 86
SSH Collector Plug-ins 86
Zenoss Plug-ins 87
Model Device 89
Port Scan Modeling 90
OS Tab 91
Hardware Tab 92
Device zProperties 92
Summary 96
Chapter 6: Status And Performance Monitors
97
Available Monitors 97
Status Monitors 98
Performance Monitors 100
Add A New Monitor 102
Attach A Monitor To Devices 102
Component Status 104
Reorder The Graphs on The Perf Tab 124
Customize A Threshold 125
Summary 126
Chapter 7: Event Management
127
Monitor Syslog Messages 127
Collect Cisco Router Syslogs 129
Test Syslog Configuration with Logger 131
Monitor Windows Event Logs 131
Test Event Log Configuration with Eventcreate 132
Event Console 133
Event Log 135
Event Classes 138
Events And History 143
zProperties 143
Event Manager 145
Fields 146
Commands 148
Working with Events 150
Add Events 150
Map Events 152
Overridden Objects 154
Transformations 155
Event Work Flow 156
Event De-Duplication 157
Summary 158
Chapter 8: System Reports
159
Report Overview 159
Device Reports 161
All Devices 161
Manufacturers and Products 162
All Monitored Components 164
Device Changes 164
Model Collection Age 165
New Devices 165
Ping Status Issues 165
SNMP Status Issues 166
Software Inventory 166
Event Reports 167
All Event Classes 167
All Event Mappings 168
Filesystem Utilization Report 181
Chapter 9: Settings And Administration
185
Alerting Rules 185
Back Up and Restore 207
Automate Backups 208
Update Zenoss Core 210
RPM Update 211
Source Update 212
Virtual Appliance Update 212
Summary 213
Chapter 10: Extend Zenoss
215
ZenPacks 215
Install 216
Monitor Websites with HttpMonitor 216
Create 221
Add Objects to ZenPack 222
Export ZenPack 223
Contribute ZenPacks 224
Plug-ins 224
Apply The Plug-in to A Device 225
Access Zenoss Objects Database with zendmd 234
Summary 236
Chapter 11: Technical Support
237
Troubleshoot Zenoss 237
Reports 237
Appendix A: Event Attributes
245
Appendix B: TALES And Device Attributes
249
Preface
Regardless of the size of your organization, information technology (IT) plays an increasingly important role in day-to-day business, which implies we have incentives to manage the servers, routers, workstations, printers, and other systems attached to our networks. Zenoss Core Network and System Monitoring: A Step-by-Step Guide for Beginners provides a narrowly focused guide that helps users set up an environment to manage their IT assets regardless of systems administration background or lack thereof.
We use step-by-step examples with ample screen captures to demonstrate Zenoss Core's capabilities that you can easily apply to your environment. The book keeps the emphasis on using Zenoss Core through its web interface. Advanced users will be able to identify ways in which they can customize the system to do more, while less advanced users will appreciate the ease of use Zenoss provides.
If you work through each chapter in sequence, you will start with installation and finish with monitoring solution that can be deployed on your network. Each chapter builds on the knowledge gained from the previous chapter. However, each chapter can stand on its own, allowing you to pick and choose the features you want to explore.
What This Book Covers
Chapter 1—Introduction: Provides an overview of Zenoss Core's network and systems management capabilities.
Chapter 2—System Architecture: Discusses the underlying components and how they fit together to form Zenoss Core.
Chapter 4—Zenoss Dashboard: Introduces the web interface's navigation and organization properties. The dashboard holds the key to the rest of the book. From Chapter 4 onwards, the emphasis is on using the dashboard.
Chapter 5—Device Management: Walks through the process of discovering and modeling devices to build an inventory of the network. In Zenoss, everything is viewed as a device, and without devices, we have nothing to monitor.
Chapter 6—Status and Performance Monitors: Describes how to set up monitoring so that we know the operational status of our devices and components, such as file systems, interfaces, and processes.
Chapter 7—Event Management: Provides an in-depth review of how Zenoss Core generates events and how we can manage them from the Event Console.
Chapter 8—System Reports: Takes us on a tour of Zenoss Core's included reporting features. The reports aggregate system-wide data to provide real-time and historical status views about devices, events, and performance.
Chapter 9—Settings and Administration: Documents how to manage users, define
alerting rules, and customize event views. Includes information about general Zenoss Core administration, including backups and updates.
Chapter 10—Extend Zenoss: Extend Zenoss Core with ZenPacks, Nagios plugins, and command line utilities.
Chapter 11—Technical Support: The place to start when things go wrong. Outlines the vibrant community support resources and provides a synopsis of how to troubleshoot Zenoss Core.
Appendix A—Event Attributes: A table of available event fields that are used to
describe and process events.
Appendix B—TALES and Device Attributes: Provides a list of the device and event attributes available to the Templating Attribute Language Expression Syntax (TALES).
What You Need for This Book
Hardware
Network with up to 250 devices 4 GB RAM
Core 2 Duo E6300 1.86/1066 RTL 75 GB disk storage
Network with more than 250 devices 8 GB RAM
XEON 5120 DC 1.86/1066/4MB Four 75 GB drives in two RAID-1 pairs
The following table shows the available installation options.
Installation Type Platform Virtual Appliance Windows
Linux
Binary Installer Red Hat Enterprise Linux 5 Fedora Core 6
Virtual appliance users do not need to install any dependencies because they are included in the image. For all other installations, you need to install the following software packages prior to installing Zenoss:
MySQL 5.0.22 or higher
MySQL development environment Python 2.3.5 or 2.4
Python development environment
Who Is This Book For
This book is for anyone who would like to proactively monitor their network resource, including Windows and Linux systems administrators.
Readers should have a basic knowledge of networking concepts and be able to administer the systems they plan to monitor. Some Linux knowledge is helpful but not required. This book does not assume any existing system and network monitoring experience.
Conventions
In this book, you will find a number of styles of text that distinguish between different kinds of information. Here are some examples of these styles, and an explanation of their meaning.
Code words in text are shown as follows: “We can include other contexts through the use of the include directive.'
A block of code will be set as follows:
#Setup Zenoss environment
export ZENHOME=/usr/local/zenoss export PYTHONPATH=$ZENHOME/lib/python export PATH=$ZENHOME/bin:$PATH
Any command-line input and output is written as follows:
zentestcommand --device=Fox –datasource=checkCpu
New terms and important words are introduced in a bold-type font. Words that you see on the screen, in menus or dialog boxes for example, appear in our text like this: “clicking the Next button moves you to the next screen'.
Important notes appear in a box like this.
Reader Feedback
Feedback from our readers is always welcome. Let us know what you think about this book, what you liked or may have disliked. Reader feedback is important for us to develop titles that you really get the most out of.
To send us general feedback, simply drop an email to [email protected], making sure to mention the book title in the subject of your message.
If there is a book that you need and would like to see us publish, please send us a note in the SUGGEST A TITLE form on www.packtpub.com or
email [email protected].
If there is a topic that you have expertise in and you are interested in either writing or contributing to a book, see our author guide on www.packtpub.com/authors.
Customer Support
Now that you are the proud owner of a Packt book, we have a number of things to help you to get the most from your purchase.
Downloading the Example Code for the Book
Visit http://www.packtpub.com/files/code/4282_Code.zip to directlydownload the example code.
The downloadable files contain instructions on how to use them.
Errata
Questions
Introduction
If you have ever arrived at work to answer voice mails and emails about a down web server, print server, or mail server, then you must be familiar with the customer-driven monitoring solution. It's cheap to implement but unreliable, and sometimes the monitor gets an attitude and for good reason. Our customers should not bear the responsibility of monitoring our networks for problems. Unfortunately, commercial monitoring tools lie beyond the budget of many organizations, and the available open-source tools require several packages to be "glued" together by users to get a complete solution.
Zenoss Core replaces prohibitive costs and incomplete solutions with a capable, feature-rich network and systems monitoring package.
What is Zenoss?
Zenoss Core is a web-based application which installs to a central server on the network and uses the Zope application server. It is written in Python. It's a Linux-based application, but we do not need to be Linux administrators to install and use Zenoss Core. Zenoss Inc. releases a virtual appliance that requires no Linux knowledge or setup and enables Mac, Windows, and Linux users to install Zenoss Core inside VMware Player or VMware Server.
The Zenoss Core native Linux installers continue to improve and support a broader range of distributions, which means the Linux skills required to install Zenoss Core natively continue to decrease. Starting with the Zenoss Core 2.2 release, we will have the option of using point and click installers built on BitRock installers; but don't worry, we can still install from source if we so choose. Chapter 3 outlines several installation options.
Administrators access Zenoss Core via a web interface that allows us to do:
Device Management
Availability and Performance Monitoring Event Management
System Reports Generation User and Alert Management
We can do all this from a web portal, which we will look at first.
Web Portal
The web portal is the face of the Zenoss system and is the place where we spend most of our time. It's an AJAX enabled interface that provides a single access point to the monitoring system and requires no operating-system-specific knowledge to use. The web interface features drag-and-drop dashboard portlets that display a customized view of our network's health at any given time. The following screen capture shows the web portal.
Device Management
Zenoss allows us to organize devices by user-defined locations, groups, and systems. One of the Zenoss's most powerful organizational concepts is classes, which allow us to define monitoring characteristics based on a hierarchical classification of devices. The following screen capture provides a look at a device status page.
Availability and Performance Monitors
By using ICMP and SNMP monitoring, Zenoss reports on the availability of the following:Network devices
TCP/IP services and ports
URL availability
Windows services and processes Linux/UNIX processes
Zenoss monitors are Level-3 network topology aware, which reduces the amount of alert chatter by creating an event about the problem device only and not about the devices that depend on the down device.
Zenoss Core 2.1 introduces a Flash-based map of the network topology that displays a view of the network on a single page, which can be seen in the following screen capture.
Performance monitors collect time series data and provide us with a graphical analysis of the following components:
File system statistics CPU and memory usage
JMX monitoring for J2EE servers Nagios and Cacti plug-in support
If a monitored device crosses a defined threshold, Zenoss generates an event.
Event Management
Zenoss monitors a variety of sources for signs of trouble, including syslogs,
availability and performance monitors, SNMP traps, and Windows event logs. Core features of the event management system include:
Custom events
Automatic prioritization Event deduplication
Up/down event correlation
Zenoss processes events based on a customizable set of rules. In response to events, Zenoss can send email or pager alerts, run a script, or do nothing. We can configure how Zenoss responds to an event by defining alerting rules for users and groups.
System Reports
Zenoss packages a set of standard reports that allow us to view what is happening right now, as well as what has happened. The reports integrate with the device management, performance monitors, events and user functionalities of Zenoss. Advanced users can create custom reports as needed.
Zenoss Inc.
Zenoss Core is backed by the commercial company, Zenoss Inc., which was co-founded by Erik Dahl and Bill Karpovich in 2006. Prior to founding Zenoss Inc., Dahl began development of Zenoss in 2002 to address a need he saw in the enterprise-systems monitoring market. He did this by setting out to develop an affordable, functional, and easy to use solution for organizations of all sizes.
In addition to sponsoring the development of Zenoss Core, Zenoss Inc. provides consulting, training, paid support, and an enterprise edition of Zenoss. Zenoss Enterprise extends the functionality of Zenoss Core by offering an extended report library, synthetic web transactions, certified monitors (ZenPacks), and a global dashboard for multiple Zenoss installations.
Today, Zenoss Inc. makes systems and network monitoring available to everyone under the GPL v2 license.
Summary
System Architecture
Zenoss blends innovative development with several open-source software projects to create a robust network and systems management solution. Before we jump into installation, we can pause for a moment to take a peek under the hood and see what makes Zenoss work. Reviewing the system architecture now provides us with an understanding that can help troubleshoot problems that may arise later.
Zenoss provides everything that we need to discover, collect, store, and manage our IT resources; and when we talk about the system architecture, it helps to conceptually segregate Zenoss into three layers:
User Data Collection
The User Layer (refer to the following screenshot) allows us to connect to the Zenoss from any computer running Mozilla Firefox or Microsoft Internet Explorer. From the User Layer, we manage the device data that Zenoss collects from our network. Although Zenoss automatically handles many collection and monitoring tasks, we can manually control the collection components from the Zenoss web interface.
The most notable open-source software components that integrate with Zenoss include Zope, Python, MySQL, RRDtool, and Twisted. In this Chapter, we will examine each layer and its core components.
User Layer
Zenoss is flexible enough to work from a command line, but most of our work will take place via an AJAX enabled interface, which is based on the Zope application server framework. We limit our command line work to installation, troubleshooting, and general curiosity.
The following screenshot shows the view of the Zenoss dashboard.
Through the web interface, we provide input with both the data and collection layers to accomplish tasks related to the following areas:
Navigation and organization Device management
Availability and performance monitors System reports
Event Management
Settings and Administration
Data Layer
As we might expect, databases are the heart of the data layer, and Zenoss stores data in three types of databases. The Collection layer funnels device information to ZenHub, which in turns stores the data in the appropriate place. (Refer to the following screenshot).
Events are stored in a MySQL database. Zenoss generates Events when an established threshold is crossed, such as a server outage or high memory usage. Events trigger actions, such as email or pager alerts.
MySQL is a popular open-source database commonly used by web applications as part of the LAMP (Linux, Apache, MySQL, and PHP) stack. It is often praised in the industry for being fast and reliable.
Time series performance gets stored in a Round Robin Database (RRD). A round robin database differs from a linear database, such as MySQL, in that it’s circular— which means the size does not increase over time. Data is stored in a first in, first out basis. RRDtool provides Zenoss with the ability to log and graph performance data.
The third database deployed by Zenoss is a Configuration Management Database (CMDB). The CMDB is an Information Technology Infrastructure Library (ITIL) standard for managing the configuration, relationship, and change history of the IT environment, which creates a detailed model of the network. Zenoss uses a Zope object database to house the CMDB.
Collection Layer
The collection layer includes several daemons that gather information about devices, performance, and Events (refer to the following screen capture). They feed information to ZenHub to distribute to the appropriate database. As we’ll find out, the Zenoss daemons are easy to identify—they all start with the prefix "zen."
We access the daemons by selecting Settings > Daemons from the Zenoss
If we browse the file system, we will find each daemon in $ZENHOME/bin. $ZENHOME is an environment variable, which allows us to talk about the Zenoss installation directory without knowing exactly where it is. For example, I may install to /usr/ local/zenoss while you install to /home/zenoss.
Twisted is an integral network communication protocol for the daemons. The Twisted Core README file describes Twisted as an "event based framework for internet applications, which works on Python 2.3.x or 2.4.x"
Device Management
Finding the devices on our networks is a prerequisite to managing them, and Zenoss not only finds the devices, it models them. Device modeling builds a detailed
Zenoss provides several ways to view information about a device or a group of devices. The following screen capture shows an alphabetical list of all devices from the Device List view.
The following table describes the daemons responsible for discovering and modeling devices.
Device Daemon Description
zenmodeler Queries the devices via SSH, SNMP, and port scans when we model the device. Each time zenmodeler runs on a device, it compares its findings with existing configuration and updates it as necessary.
zendisc Runs when we add a network subnet to Zenoss and choose to discover all devices attached to the network.
Zenoss uses Simple Network Management Protocol (SNMP) as a primary collection protocol.
Performance And Availability
The following daemons play an important role in collecting performance and availability data.
Performance Daemon Description
zenperfsnmp Stores the collected performance data in RRD files so that RRDtool can graph device performance over hourly, daily, weekly,
monthly, or yearly durations.
zencommand Provides a way to run custom scripts and third party plug-ins including Nagios and Cacti plug-ins from within Zenoss.
zenprocess Monitors performance data, such as CPU and Memory usage using SNMP collection.
Event Information
When a device goes down or a service crosses a predetermined threshold, such as available disk space, Zenoss generates an event. One of the ways Zenoss displays monitoring activity is via the Event Console, as shown in the following screen capture.
We can configure Zenoss to notify us by email or pager when events occur. Zenoss can also automatically run custom commands in response to events as a first step in problem resolution.
Event Daemon Description
zensyslog Creates events from syslog messages. zeneventlog Creates events from Windows event logs.
Summary
At a high level, we want to find and monitor devices, then be notified when
Installation and Set up
In this chapter, we fill in the step-by-step details required to get a functioning Zenoss system. We identify dependencies, review installation options, and take a look at server setup.Our first step is to choose one of the three installation methods: virtual appliance, binary installer, or source. The virtual appliance makes a good choice, if we want to evaluate or demonstrate Zenoss. The virtual appliance runs a functional Zenoss system using VMware Player or VMware Server out-of-the-box and needs no Linux knowledge. When run from VMware, the Zenoss virtual appliance may be used to monitor networks with relatively few devices.
The binary installer makes a good choice if we want to avoid building Zenoss from source and we run a supported distribution. The Supported Operating Systems section in this chapter includes a list of distributions that have binary installation support.
We can build from source on a variety of Unix-based environments, such as Ubuntu and Mac OS X. A source installation gives us the ability to install Zenoss in the environment of our choice but requires more work. Of the three installation methods, a source install requires the most familiarity with your operating system and
presents more points of failure.
As we move beyond installing Zenoss to set up, we focus on firewall policies and Simple Network Management Protocol (SNMP) for Linux and Windows systems. Even though Zenoss can use other methods to monitor devices, SNMP is the default monitoring protocol. We are free to change how we monitor and collect information at any time.
When working from the command line, we assume knowledge of two basic tasks: opening the terminal window and navigating the file structure. For all other tasks, the book provides the exact command to type.
After installation and set up, we spend most of our time working with Zenoss through the web interface. Let's get this installation out of the way so we can discover Zenoss.
Server Specifications
Actual server specifications may vary depending on the amount and frequency of the data you collect. Zenoss Inc. recommends the following hardware specifications as a starting point based on feedback from the community:
Network with up to 250 devices 4 GB RAM
Core 2 Duo E6300 1.86/1066 RTL 75 GB disk storage
Network with more than 250 devices
8 GB RAM
XEON 5120 DC 1.86/1066/4MB Four 75 GB drives in two RAID-1 pairs
Supported Operating Systems
Zenoss requires a Unix-based platform and installs on systems capable of running a GNU build environment. However, Zenoss supports only a few distributions with binary installers. The following table shows the available installation options.
Installation Type Platform Virtual Appliance Windows
Linux
As more binary installers become available, Zenoss posts them to http://www.zenoss.com/download.
Zenoss Dependencies
Virtual appliance users do not need to install any dependencies because they are included in the image. For all other installations, you need to install the following software packages prior to installing Zenoss:
MySQL 5.0.22 or higher
MySQL development environment Python 2.3.5 or 2.4
Python development environment
If you plan to build a Zenoss installation from source code, you need to install the following:
SWIG Autoconf
GNU build environment
Dependent software packages are available via your distribution's normal software package manager. However, the package names and installation commands vary based on distribution. Consult your distribution's documentation for more information.
Quick Start with Virtual Appliance
If we know how to download and install software in our host environment, we can get a working Zenoss system with the virtual appliance. The Zenoss virtual appliance packages a working Zenoss Core installation inside a Linux guest that can be booted from a host system, including Windows, using VMware's Player, Server, or Workstation programs.
The virtual appliance is great for:
Users with little or no Linux knowledge Demonstrations and Evaluations
Monitoring small networks with a few devices
Install Virtual Appliance
We will finish the installation as fast as we can download files and install the VMware Player. Let's begin:
1. Download the VMware Player from http://www.vmware.com/player/. Registration is required to complete the download.
2. Install VMware Player according to VMware's installation instructions for your operating system.
3. Download the Zenoss virtual appliance from http://www.zenoss.com/download/.
4. Unzip the Zenoss virtual appliance download file to a working directory in your system.
5. Open VMware Player:
On Windows, select Start > Programs > VMware Player. On Linux, select VMplayer from the application menu, or type the command:
vmware
6. VMware Player prompts us to load the virtual machine configuration file we previously unzipped, as shown in the following screenshot:
7. Open the Zenoss virtual appliance we unzipped in step 4.
The Zenoss virtual appliance takes a few minutes to load depending on the
performance of your system. When the appliance boots, a welcome window opens and displays the IP address of the Zenoss management console and the standard Linux login prompt, as shown in the following screenshot:
When we connect to Zenoss through our web browser, we use the IP address of the Zenoss management console that displays on the welcome screen (e.g. http://192.168.1.125.8080). We cannot access our virtualized Zenoss installation by navigating to localhost, which is the host name of the Zenoss virtual appliance. If the IP address of the Zenoss console does not display, we can obtain the IP address using the ifconfig command, as described in the next section: Working with The Virtual Appliance.
Zenoss is ready to monitor. Our next step is to set up the servers on our network to be monitored. If you can't wait to see Zenoss in action, feel free to skip the server setup section for now and check out Chapter 4 for an introduction to web interface. You can come back and set up your servers later.
If this is the first time you are working with VMware or Linux, take a few minutes to get acquainted with the environment.
Working with The Virtual Appliance
The Zenoss virtual appliance is a streamlined but functional Linux system, which means we can log in and have access to the underlying Linux environment. Let's cover a few basic tasks.
In order to type inside the virtual appliance window, use the keyboard shortcut:
Ctrl + G
To return the cursor to the host desktop, use the keyboard shortcut:
By default, the root login does not have a password assigned. To log in to the virtual appliance, enter the following user name at the login prompt:
root
To set a password for the root user, enter the command:
passwd
The passwd command prompts us to enter a new password. Assigning a password to the root user makes the system more secure and allows us to connect to the virtual appliance as root via SSH.
The IP address of the Zenoss virtual appliance is displayed at the top of the terminal window when the appliance loads. The most confusing part about using the
Zenoss virtual appliance may be picking the correct IP address and port number. We connect to Zenoss on port 8080. So if our virtual appliance has an IP address of 192.168.1.103, then we use http://192.168.1.103:8080 to open the Zenoss login screen. If we use port 8003, we access the rPath management console, which is the underlying system used to build the Zenoss virtual appliance.
After login, we can find additional IP configuration as shown in the following screenshot, with the command:
To shut down the virtual appliance, select Player > Exit from the VMware Player. We may also use the the command:
shutdown –h now
If we shut down the virtual appliance, Zenoss no longer monitors the network and the web interface is not accessible.
We may now jump ahead to the Server Setup section of this chapter for help in configuring the servers we wish to monitor.
Binary Installation
Zenoss provides a binary installer in RPM format for Red Hat Enterprise Linux, which covers CentOS and Fedora Core. Binaries for additional distributions are added by Zenoss as the market demands and as time allows.
To install Zenoss and its dependencies on Red Hat:
1. Download the latest RPM for Red Hat Enterprise Linux from http://www.zenoss.com/download/.
2. Open a terminal window and become the root user: su
-3. If you have not yet installed the Zenoss dependencies, run:
yum -y install mysql mysql-server net-snmp net-snmp-utils / python python-dev
Let's test our installation. Open a browser and enter the URL of the Zenoss server, which listens on port 8080 (for example http://192.168.115:8080). A screen appears as shown in the following screenshot.
Chapter 4 tells us more about logging in and using the web interface. For more setup information, continue with the Server Setup section.
Source Installation
Like any open-source project, we can install Zenoss using the source code on any Linux- or Unix-based system including FreeBSD, Mac OS X, and Ubuntu. The installation requires more setup, but in return for the extra work, we are able to extend Zenoss to a variety of architectures.
Distribution-specific tips for Ubuntu users are included in the Ubuntu Notes section to help make the installation smoother. Additional distribution notes can be found in the INSTALL.TXT file located in the top level of the source code directory.
Ubuntu Notes
Debian derivative distributions use APT to add, update, and remove software packages from the system. We can use APT from the command line or from the graphical interface Synaptic, available from the System > Administration menu in Ubuntu. Update the repositories with the following two commands:
sudo apt-get update sudo apt-get upgrade
Now, install the Zenoss dependencies with apt-get. The example commands specify each package installation command on a separate line for clarity.
sudo apt-get install mysql-server sudo apt-get install mysql-client
sudo apt-get install libmysqlclient15-dev sudo apt-get install python2.4
sudo apt-get install python2.4-dev sudo apt-get install build-essential sudo apt-get install snmp
sudo apt-get install snmpd sudo apt-get install autoconf sudo apt-get install swig
sudo apt-get install python-setuptools
To reduce the amount of typing, we may supply all the package names as arguments to the apt-getinstall command. For example:
sudo apt-get install mysql-server mysql-client ...
Ubuntu installs Python 2.5, but Zenoss requires we install Python 2.4 to properly build all of its dependencies. Prior to starting the Zenoss installation, update the /usr/bin/python symlink to point to the python2.4 file:
unlink /usr/bin/python
ln -s /usr/bin/python2.4 /usr/bin/python
After the installation, you can change the /usr/bin/python symlink back as follows:
unlink /usr/bin/python
ln -s /usr/bin/pythong2.5 /usr/bin/python
From this point, follow the source installation procedures to set up and install Zenoss.
System Setup for Source Install
Open a terminal window and become the root user:1. Install the dependencies listed earlier in this chapter. 2. Create the Zenoss user:
3. Add the ZENHOME and PYTHONPATH environment variables to the zenoss user's environment by adding the following lines to the zenoss user's .bashrc file (as shown in the following screenshot):
export ZENHOME=/usr/local/zenoss
export PYTHONPATH=$ZENHOME/lib/python export PATH=$ZENHOME/bin:$PATH
4. Create the installation directory: mkdir /usr/local/zenoss
5. Change the installation directory's ownership to the zenoss user: chown zenoss /usr/local/zenoss
We can install Zenoss to any directory, but we must set the ZENHOME environment variable in the .bashrc file to match the installation directory.
Download Zenoss Source
Next, we download the Zenoss source file from http://www.zenoss.com/download and unpack it to a working directory on the Zenoss server with the following command, where x.x-x equals the latest version:
tar xzvf zenoss-2.x.x-x.tar.gz
When we build and install Zenoss, we work as the user zenoss, which presents some permission problems during the build, if we download the files as a user other than zenoss. As root, use the following commands to move the source files to /home/ zenoss and set ownership:
mv zenoss-2.x.x-x /home/zenoss
chown -R zenoss /home/zenoss/zenoss-2.x.x-x We are ready to build the source code.
Build And Install Zenoss
To build and install Zenoss, we run the included install.sh script. The script collects configuration information for the web and database components of the Zenoss system, then builds the source files.
We continue our work from the command line: 1. Log in as the user zenoss:
su - zenoss
2. From the Zenoss source directory, run the install script: ./install.sh
3. The install script prompts for the following Zenoss database configurations (refer to the following screenshot):
Admin password for the dashboard The host name of the MySQL server A root user for the MySQL server A password for the MySQL root user Name of the MySQL events database A user name for the events database
Password for the events database user name
.
4. After the install completes, set ownership and uid on zensocket. As root, enter the following commands:
chown root:zenoss /usr/local/zenoss/bin/zensocket chmod 04750 /usr/local/zenoss/bin/zensocket
If the installation fails, the error message prints to the terminal window and to the zenbuild.log file in the installation source directory. Source installations most often fail because the dependencies are not properly installed.
To continue with a failed installation after we fix the problem, clean the installation source, and run the install script again with the commands:
make clean ./install.sh
The "makeclean" command removes the build files and zenbuild.log file.
After a successful installation, we can log in to Zenoss by navigating to port 8080 of the Zenoss server (e.g., http://192.168.1.115:8080)
Server Setup
The second part of the installation equation is server setup. We'll examine the following configuration options:
Start Zenoss at boot time Firewall policies
SNMP on Linux and Windows
Start Zenoss at Boot Time
By default, Zenoss does not automatically start during the boot process and it is required to start the Zenoss daemons manually. As the zenoss user, run the command:
zenoss start
Red Hat users can enable Zenoss at boot time by running the following commands as root:
/sbin/chkconfig zenoss
/sbin/chkconfig –-level 345 zenoss on
If you use a Debian based distribution, such as Ubuntu, do the following as root: cp /usr/local/zenoss/bin/zenoss /etc/init.d/
update-rc.d zenoss defaults 95
The next time the system reboots, use the following command as the zenoss user to verify whether Zenoss started:
zenoss status
If the Zenoss daemons are not running, consult your distribution's documentation for help in automatically starting programs at boot time. Remember, we can run the following command as the zenoss user to start Zenoss:
zenoss start
Firewall Policies
Zenoss requires access to a few ports on the network in order to communicate with the the systems we want to monitor. The Zenoss server needs to accept connections on the following ports:
8080 for HTTP access 514 for syslog access 22 for SSH access
To facilitate monitoring, the systems on the network need to allow access to the following ports:
161 for SNMP 22 for SSH
This is a common list of ports, but network and monitoring needs are unique from one site to the next. For example, if you do not plan to connect to your Zenoss server via SSH, then you do not need to open port 22.
Iptables is a popular tool for managing firewall access on Linux systems. Firestarter, a graphical front end to iptables is shown in the following screenshot. Windows has built-in firewall support via the Windows Firewall Control Panel (as shown in the screenshot following the next one). If you are unsure about how to configure port access, consult your firewall documentation or system administrator.
• • •
SNMP on Linux
Zenoss uses SNMP to collect information, such as file system statistics, memory usage, and interface status from the systems attached to the network. The network devices report data to Zenoss via an SNMP agent, which is installed on each device, but SNMP is only a collection protocol. The information SNMP collects about each device depends on the device's Management Information base (MIB). MIBs are management, that define the devices on the network and are part of the OSI network management model. MIBs further rely on object identifiers (OIDs) to tell SNMP which data values to return.
As we will see in later chapters, Zenoss can discover and monitor our networks without using SNMP, but if we choose not to use SNMP, we sacrifice a detailed model of our networks.
Install SNMP on Linux
If we plan to collect device information from the network using SNMP, we need to install SNMP on the Zenoss server and the devices attached to the network. The package names vary from one distribution to the next, so be sure to check with your distribution, if you are unsure of which file you need.
Red Hat users can install SNMP with the command:
yum -y install net-snmp
Ubuntu users can install SNMP with the command:
apt-get install snmpd
Zenoss recommends we add several configuration changes to the snmpd.conf file. Before you make any changes, back up the snmpd.conf file. As root:
cp /etc/snmp/snmpd.conf /etc/snmp/snmpd.conf.bak
In the section that begins "First, map the community name into a security name," add:
com2sec notConfigUser default public
In the section that begins "Second, map the security names into group names," add:
In the section that begins "Third, create a view for us to let the groups have rights," add:
view systemview included .1
In the section that begins, "Finally, grant the 2 groups access to the 1 view with different write permissions," add the following line:
access notConfigGroup "" any noauth exact systemview none none
Add the following lines to the System Contact Information section:
syslocation Unknown (edit /etc/snmp/snmpd.local.conf)
syscontact Root <root@localhost> (configure /etc/snmp/snmpd.local. conf)
Add the following lines to the Further Information section to configure the default community string for sending traps:
trapcommunity public trapsink default
WMI And SNMP on Windows
Often, we want to know more about our Windows servers than a simple up or down status. In order to view specific information about Windows services and events, we need to enable Windows Management Instrumentation (WMI) and SNMP.
WMI provides several management options for Windows 2000, Windows XP, and Windows Server 2003, including the ability to access Windows event logs.
WMI and SNMP are enabled from the Windows Management and Monitoring Tools packages. To install WMI and SNMP (refer to the following screenshot):
1. Open the Windows Control Panel.
2. Select Add/Remove Windows Components.
5. Save the changes to install the Windows Components.
After WMI installs, we can get detailed information about the services running on server and confirm WMI is properly configured. From the Windows Computer Management control panel:
1. Run the command wbemtest from Start > Run. 2. Select the Connect. button.
5. Click the Query button.
6. In the search box, type "select * from win32_service" to see a list of services as shown in the next screen capture.
The Windows SNMP agent does not return information about the server's CPU, memory, or file system. For these stats, Zenoss Inc. recommends we install the third-party SNMP Informant from http://www.snmp-informant.com. No configuration is necessary for SNMP Informant.
Summary
In this chapter we examined the Zenoss installation from several angles, and we found an installation type that meets our abilities and needs. We prepared the servers on our network for monitoring by configuring SNMP and we opened the necessary firewall access to our systems.
The Zenoss User Interface
Before we jump straight into monitoring and modeling devices, we need to cover a few concepts that will help us manage our device data. If we have not yet thought about our device hierarchies, we will raise those questions as we move through the chapter. Our device hierarchies establish relationships to with other devices, locations, systems, and groups.
In this chapter, we log in and explore the interface using four types of navigation techniques: navigation panel, bread crumbs, page tabs, and table menus.
As we navigate the Zenoss interface, we create organizers to help us build device relationships.
Establishing device relationships help us understand how a device fits into our IT environment by location, system, group, and class. The relationships we build in this chapter help us manage our devices by assigning common configurations to a group of devices. The groupings provide all devices a way to inherit the configurations of a common organizer.
To demonstrate Zenoss' hierarchy and inheritance concepts, we need devices to organize, so we'll let Zenoss auto-discover the devices on our networks. The auto-discovery process provides a quick way to build an inventory of the devices on the network and jump-start our monitoring process.
Welcome to Zenoss
When prompted for a user name and password, enter the values you defined during setup. The defaults are:
User name: admin Password: zenoss
The following screenshot shows the Zenoss login screen.
After a successful login, the Zenoss interface displays the default dashboard view, which includes drag-and-drop portlets for Locations, Device Issues, and Zenoss Issues. Additional portlets are available from the Add Portlets link.
Navigation Techniques
At first look, the interface to the Zenoss web application appears overwhelming and we don't have any big red buttons that say, "start here." As we take a few minutes to acquaint ourselves with the application, the overwhelming feeling will subside.
The navigation panel runs down the left side of the screen and contains headings for Main Views, Classes, Browse By, and Management. The navigation panel provides the primary way to move from one section to the next within Zenoss (refer to the following screen capture).
To hide the navigation panel, click the triangle located above the Main Views heading. When the panel is hidden, the triangle inverts and the screen automatically resizes to give the page content more space. Click on the inverted triangle to display the panel, and pin the panel in place by clicking the tack.
To see the bread crumbs in action, select Devices from the navigation panel. Click on Server from the list of sub-devices, then Linux. The bread crumbs display a navigable path which can be found directly under the Zenoss Core log, and based on our example, we see /Devices/Server/Linux (as shown in the following screenshot). Each time we select a sub-device or device, the bread crumbs update to reflect the current location. To get back to the list of Server sub-devices, click on the Server link in the bread crumbs.
From /Devices/Server, we notice a third navigation method, tabs. Tabs should be fairly self explanatory in that we click on the tab and a new screen displays. Zenoss uses the tabs to display information and configurations specific to the device you are on. The following screenshot shows the view of tabs within a page.
The fourth level of navigation occurs on the tables that display on each page. The inverted white triangles next to Classes, Sub-Devices, and Devices represent the table menus and display context sensitive options. Most of what we do to manipulate our monitoring environment will be based on the page menus. The following
screenshot shows a sample table menu.
User Accounts
Zenoss is a multi-user system, so we should create a user account for ourselves and any other person who may use Zenoss. To add a user account:
1. Select Settings from the navigation panel. 2. Click on the Users tab.
3. From the User table menu, select Add New User. 4. Enter a user name and click OK.
5. Click on the new user name do display the user properties and make the following changes:
Enter a password.
Set the role to ZenManager. 6. Click Save.
Chapter 9 provides a step-by-step guide to adding and managing users, including a discussion about the roles. The ZenManager role gives us sufficient access permissions to add, edit, or delete our device inventory within Zenoss.
We may now click the Logout link at the top of the Zenoss interface and log in using our user account.
Main Views
The Zenoss interface opens to the Dashboard view, which contains a list of
The Location, Device Issues, and Zenoss Issues portlets display by default, but we can remove them by clicking on the asterisk at the top-right corner of the portlet to show a settings panel, as seen in the following screenshot. From the settings panel, choose the Remove Portlet link.
To add a portlet, click on the Add Portlet link at the top of the Dashboard view. From the Add Portlet dialog box that gets displayed, select the portlet you want to see on the Dashboard (refer to the following screenshot).
To arrange the portlets, click on the Configure Layout link at the top of the Dashboard view to display the Column Layout dialog box. We can choose from various combinations of one, two and three column arrangements. After we choose a layout, we can rearrange the order of the portlets on the screen by dragging and dropping a portlet to a new position on the screen.
Locations with Google Maps
The Locations portlet not only displays our configured locations, but it also shows the network connections between our locations. The locations on the map also display the current status of the devices at a location and we can drill down to any device from the portlet.
In order to make the Locations portlet work, we need to add a Google Maps API key to the Zenoss settings. To acquire a Google Maps API key:
1. Visit http://www.google.com/apis/google. 2. Follow the "Sign up for a Google Maps API key" link. 3. Agree to the Google Maps license agreement .
4. Enter the URL of the Zenoss server to generate the key. 5. Copy the key.
6. Open Zenoss and click on Settings from the navigation panel.
7. Scroll to the bottom of the settings screen and paste the key into the field labeled Google Maps API Key.
8. Save the changes.
The page refreshes and displays a status message which says that we have
successfully saved the settings. Navigate back to the Dashboard view by selecting Dashboard from the navigation panel. The Location portlet displays a map, but Google Maps doesn't know which specific location we want to see, so it guesses. We'll come back to locations in a while, but first, we need to finish our review of the Dashboard portlets.
Device Issues
The Device Issues portlet displays a list of all devices with an event using a color-coded status. Each device name is a hyperlink that links to the devices main status page. Likewise, clicking on the event redirects us to the event page for each device.
Zenoss Issues
Zenoss not only monitors our network but it monitors itself and reports its status. If one of the daemons we discussed in Chapter 2 has a problem, Zenoss displays that problem in the Zenoss Issues portlet (refer to the following screenshot).
Like the Device Issues portlet, we can only change the portlet Title and Refresh Rate.
Watch List
With the Watch List portlet we can monitor the status of an entire device hierarchy, also known as a class, for example, /Devices/Network. If any device we classify as Devices/Network generates an event, the status updates on the Watch List portlet.
Root Organizers
Zenoss allows us to organize our data in several ways, including by location,
systems, groups, and devices. The Root Organizers portlet displays the status for the grouping we choose. The Locations, systems, and groups are user defined while the devices are primarily Zenoss defined.
The default organization is by device class. We configure locations, systems, and groups later in this chapter. If you want to select a new Root Organizer, choose the new organizer from the settings pane of the portlet. We can also change the portlet Title and Refresh Rate (refer to the following screenshot).
Production State
The Production States portlet displays the Devices assigned to the selected
Select the Production States to display from the settings pane. To monitor multiple states, hold down the Ctrl key while selecting the states. You may also change the portlet Title and Refresh Rate (refer to the following screenshot).
Browse By Organizers
We use the organizers in the Browse By category to define a classification hierarchy that lets us identify and manage our assets by systems, groups, locations, and networks. How we define our organizers depends on our monitoring environment and to what level we want to manage devices.
We'll start by adding a location by selecting the Locations menu from the navigation panel (refer to the following screenshot).
Locations
Location names can be generic or specific depending on individual needs. We use the locations to identify our network, so it's important to use values that have meaning. To enter a new location:
1. Select Add New Organizer from the Sub-Locations table menu. 2. Type a description (for example, Mill Race) in the ID field of the Add
Organizer dialog.
3. Save the change by clicking OK.
The new location displays in the Sub-Locations table and includes several fields in addition to the location name. The Subs field provides sub-locations assigned to Mill Race. The Devices field lists the total number of devices assigned to the location, and the Events column shows the highest severity event and the number of corresponding number of events. Since we just started, we see all zeros.
If we click on the First Floor link, we see the status screen that displays information specific to the /Locations/Mill Race/First Floor organizer. Let's go back to the Mill Race location by clicking on Mill Race link in the bread crumbs.
The Summary table on the Mill Race Status tab contains Descriptions and Address fields that we can edit. Click on the Edit link next to Description and enter any number of items, such as driving directions or contacts. Save the changes (refer to the following screenshot).
In order to use the Google Maps portlet, we need to enter a mappable address, such as city and state. Edit the Address field and enter the address to pass to Google Maps and click Save. Click on the Map tab to display the map view.
To see multiple locations on the map, add an address for each location; however, you can enter only one address for each location. Click on the Dashboard view and note that the Location portlet now displays a map.
Systems And Groups
We continue defining our monitoring environment by setting up system organizers for our example company, which is similar to adding locations. From the navigation panel, select Systems. On the Systems screen, Zenoss displays the Status tab by default. To add a system organizer:
1. Select Add New Organizer from the Sub-Systems table menu.
2. Type a description (e.g., Support) in the ID field of the Add Organizer dialog. 3. Save the change by clicking OK.
4. Enter a second organizer for Development.
The Sub-Systems table displays the newly added Development and Support organizers, and each system lists the number of sub-locations, devices, and events (refer to the following screenshot).
The Systems screen includes tabs for Performance, Events, History, and
Next, we'll create a developers group and a software testers group. From the navigation menu, select Groups to display the Groups Status page. To add a system organizer:
1. Select Add New Organizer from the Sub-Groups table menu. 2. Type a description (e.g., Developers) in the ID field of the Add
Organizer dialog.
3. Save the change by clicking OK.
4. Enter a second organizer for Software Testers.
The Sub-Groups table displays both groups, but what if we want to classify software testers within the developers group?
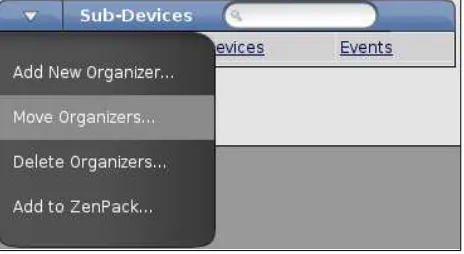
No problem. We'll move the groups:
1. Check the box next to Software Testers in the Sub-Groups menu. 2. Choose Move Organizers from the Sub-Groups page menu.
3. Select Developers from the drop-down list in the Move Organizers dialog (refer to the following screenshot).
4. Click Move.
Zenoss refreshes the page and displays the /Groups/Developers group page which now shows the Software Testers sub-group.
Networks
Zenoss can automatically discover all the devices with an IP address on our
The Mill Race Communications network we use throughout the book is not publicly accessible. Each person should apply network addresses and device names that are specific to their environment in place of the book's examples.
Before we can discover devices, we need to add a network:
1. Select Networks from the navigation panel.
2. Select Add Networks from the Sub-Networks table menu.
3. Enter the IP address (Ex: 192.168.1.1) of the network in the ID field of the Add Network dialog.
4. Click OK.
The following screenshot shows the Networks Overview page:
Our new network displays in the Subnetworks table. To discover devices:
1. Select the checkbox for the network you want to discover. 2. Select Discover Devices from the Sub-Networks table menu.
Zenoss initiates a ping sweep of the network and looks for active IP addresses. Devices are added to the Discovered device class.
Scroll to the bottom of the device discovery log and click on the Navigate to Networks link.
The IP Addresses table lists the discovered IPs on the network along with a Ping and SNMP status.
From the network overview, we get our first look at zProperties, which Zenoss uses as a way to define common configuration information for a category of devices. We'll encounter zProperties again when we cover the class organizers for events, devices, services, and processes.
The available network zProperties are:
zProperty Description
zAutoDiscover Tells zendisc to automatically discover the devices on the network. Enter either true or false.
zDefaultNetworkTree Lists network subnets in CIDR format. Default values are 24 and 32.
zDrawMapLinks Tells Google Maps not to draw links for the network. Default value is false. Set to true if you do not use Google Maps or if the network is not at a mappable location.
zIcon Sets the location of the default network icon.
Inheritance
Our discussion about Network zProperties introduces an opportune time to talk about inheritance in Zenoss. Inheritance means that devices assume the configuration of its parent organizers and often go from general to specific. We'll demonstrate inheritance using networks.
From the navigation panel, select Networks. Our test company has at least one network added to Zenoss already; let's add a second network. We'll use 192.168.2.0 for our example. Our list of networks now contains 192.168.1.1 and 192.168.2.0, which translates into the following hierarchies:
/Networks/192.168.1.1 /Networks/192.168.2.0
For our test, we'll make configuration changes at the network organizer level and to the individual 192.168.1.1 network:
1. At the Network level, select zProperties. 2. Set zAutoDiscover to false and save.
3. Select the Overview tab to display the list of networks. 4. Follow the 192.168.1.1 network link.
5. Select the zProperties tab from the 192.168.1.1 Networks Overview page. 6. Set zAutoDiscover to true and save (refer to the following screenshot). 7. Go back to the Network level to display the list of all networks.