Draft genome sequence of adzuki bean,
Vigna angularis
Yang Jae Kang1, Dani Satyawan1, Sangrea Shim1, Taeyoung Lee1, Jayern Lee1, Won Joo Hwang1, Sue K. Kim1, Puji Lestari2, Kularb Laosatit3, Kil Hyun Kim4, Tae Joung Ha5, Annapurna Chitikineni6, Moon Young Kim1, Jong-Min Ko7, Jae-Gyun Gwag8, Jung-Kyung Moon4, Yeong-Ho Lee1,
Beom-Seok Park9, Rajeev K. Varshney6& Suk-Ha Lee1,10
1Department of Plant Science and Research Institute for Agriculture and Life Sciences, Seoul National University, Seoul 151-921, Korea,2Indonesian Center for Agricultural Biotechnology and Genetic Resources Research and Development
(ICABIOGRAD-IAARD), Jalan Tentara Pelajar No. 3A Bogor 16111, Indonesia,3Program in Plant Breeding, Faculty of Agriculture at Kamphaeng Saen, Kasetsart University, Kamphaeng Saen, Nakhon Pathom 73140, Thailand,4National Institute of Crop Science, Rural Development Administration, Suwon, 441-857, Korea,5Research Policy Bureau, R&D Performance Evaluation & Management Division, Nongsaengmyeong-ro 300, Wansan-gu, Junju, 560-500, Korea,6International Crops Research Institute for the Semi-Arid Tropics, Patancheru, Andhra Pradesh, India,7Soybean Research Team, Legume & Oil Crop Research Division, Jeompiljae-ro 20, Miryang, Gyeongnamdo, 627-803, Korea,8National Agrobiodiversity Center of NAAS, RDA, Suwon 441-707, Korea, 9Agricultural Genome Center, National Academy of Agricultural Science, Rural Development Administration, Suwon, 441-707, Korea,10Plant Genomics and Breeding Institute, Seoul National University, Seoul, 151-921, Korea.
Adzuki bean (Vigna angularis var. angularis) is a dietary legume crop in East Asia. The presumed progenitor (Vigna angularis var. nipponensis) is widely found in East Asia, suggesting speciation and domestication in these temperate climate regions. Here, we report a draft genome sequence of adzuki bean. The genome assembly covers 75% of the estimated genome and was mapped to 11 pseudo-chromosomes. Gene prediction revealed 26,857 high confidence protein-coding genes evidenced by RNAseq of different tissues. Comparative gene expression analysis withV. radiata showed that the tissue specificity of orthologous genes was highly conserved. Additional re-sequencing of wild adzuki bean,V. angularis var. nipponensis, and V. nepalensis, was performed to analyze the variations between cultivated and wild adzuki bean. The determined divergence time of adzuki bean and the wild species predated archaeology-based domestication time. The present genome assembly will accelerate the genomics-assisted breeding of adzuki bean.
A
dzuki bean (Vigna angularisvar.angularis) is a diploid legume crop (2n52x522) with an estimated genome size of 538 mega bases (Mb)1. It is one of the AsianVignain the Ceratotropis subgenus, under the papilionoid subfamily of the Fabaceae2. Adzuki bean is widely cultivated in East Asian countries like China, Japan, and Korea as an ingredient for traditional dessert cuisines due to its sweet taste, as well as its nutritious protein and starch contents. The annual cultivation area for adzuki bean in China, Japan, Korean peninsula, and Taiwan is estimated to be 670,000, 120,000, 30,000, and 20,000 ha, respectively3. The wild species of adzuki bean such asV. angularisvar.nipponensis,V. nakashimae, andV. nepalensis, are widely distributed across East Asia and Himalayan countries2. However, archaeological evidences suggested multiple domestication origins in northeast Asia4.Several important legume crops and model plants have been sequenced. This includes warm-season legumes such asGlycine max,Phaseolus vulgaris,Cajanus cajan5–7, andVigna radiata8.V. angularisvar.angularisis a close relative of V. radiataand is adapted to sub-tropical and temperate climate zone. In spite of its economic importance and the demands for improvedV. angularisvar.angularisvariety, genomic studies for agriculturally important traits and efficient breeding methods for this species have been lacking. Elucidation of the genome sequence ofV. angularisvar.angulariscould reveal the general genome structure and evolution of this legume species in comparison to closely related genomes and greatly assist comparative genomics ofV. angularisvar. angularisand other well-studied legume genomes. In addition, the re-sequencing efforts of cultivated and wild adzuki beans will facilitate the measurement of genetic diversity of each locus and the development of useful markers for putative domestication-related loci.
Here, we assembled a draft genome of adzuki bean into pseudo-chromosomes using sequence data from next generation sequencing. This adzuki bean genome was compared to other warm-season legumes to study genome
SUBJECT AREAS:
GENETICS PLANT GENETICS
Received 24 September 2014
Accepted 2 January 2015
Published 28 January 2015
evolution and speciation. Well established quantitative trait loci (QTLs) ofG. maxwere translated into the adzuki bean genome using gene order conservation. In addition, we sequenced two wild adzuki bean species,Vigna angularisvar.nipponensisandVigna nepalensis, and identified the putative loci related to domestication in order to develop SNP markers for more efficient breeding. Our genome sequence ofV. angularisvar.angularisand QTL-associated genetic markers will boost genomics of warm season legumes and breeding programs of adzuki bean.
Results
Genome assembly.V. angularisvar.angularishas a diploid genome. Based on flow cytometry analysis the genome size was estimated to be 612 Mb (Supplementary Table S1) which is higher than the previous estimate of 538 Mb1. The selected domesticated line for sequencing was Gyeongwon, a widely grown variety in Korea, which was developed by the Rural Development Administration (RDA) in Korea to reduce root lodging and to improve grain quality.
Forde novogenome assembly, we prepared two paired-end lib-raries with 180 bp insert size, along with two 5 kb mate pair, and one 10 kb mate-pair libraries for 100 bp short read sequencing using the Illumina HiSeq 2000 (Supplementary Table S2). A single linear lib-rary was also constructed for sequencing using the Roche GS-FLX1 producing total 1,288,628 reads with average read length, 458 bp. Approximately 291-fold sequence read coverage of the estimated genome size was generated by the two sequencing platforms. For reads generated by the Illumina HiSeq 2000, ALLPATHS-LG assem-bler was used forde novoassembly9. The long reads generated by GS FLX1were assembled using Newbler software and the resulting contigs were transformed into paired end reads with 180 bp insert and used as input for ALLPATHS-LG assembly. Using Jellyfish10 software at 22 k-mer frequency, we estimated the genome size to be 591 Mb which is close to the size calculated using flow cytometry analysis (Supplementary Fig. S1). The assembly produced 3,883 scaf-folds with proper read coverage statistics of sequencing libraries including the pseudo-library from Newbler assembly and the N50 length of the scaffolds was 703 kb (Supplementary Table S3). The sum of the scaffold length was approximately 443 Mb covering 75 percent of the estimated genome size (Supplementary Table S4).
To link the scaffolds into super-scaffolds, we utilized the synteny relationship betweenV. angularis and closely related legume gen-omes such asPhaseolus vulgaris7andV. radiatavar.radiata. This was based on the assumption that the gene order among closely-related warm season legume species is highly conserved. Identification of the synteny relationship and calculation of the Ks values for each orthologous or paralogous gene pair was performed using MCSCANX software11. We retrieved the synteny blocks from the most recent peak in the Ks frequency plot (Supplementary Fig. S2) and extracted conserved genomic blocks that showed multi-spe-cies collinearity among the three legume genomes to be used as bridges for super-scaffolding (Supplementary Fig. S3). The syn-teny-based scaffolding strategy improved the N50 length from 704 kb to 1.5 Mb and the maximum length of scaffolds from 4.4 Mb to 11.1 Mb (Supplementary Table S5).
To assemble the pseudo-molecules, we implemented the genotyp-ing by sequencgenotyp-ing (GBS) method12to construct a high-density gen-etic map of adzuki bean. The mapping population comprised of 133 F4lines generated by single-seed descent from a cross betweenV.
angularisvar.angularis(Gyeongwon) and the wild speciesV. naka-shimae (IT178530). GBS short reads were mapped to genomic regions flanked by ApeKI restriction sites using Bowtie2 software13. A total of 4,524 segregating SNP sites were identified. Possible co-segregating sites within 1 kb regions were merged reducing the total SNP number to 2,347. However, more than half of the SNPs showed segregation distortions that are probably due to interspecific crossing (Supplementary Table S6). Removal of the distorted SNPs resulted in
a high-density genetic map with 814 SNPs in 11 linkage groups (Supplementary Fig. S4 and Supplementary Table S7). In total, 158 scaffolds could be anchored to the genetic map to construct the 11 pseudo-chromosomes. The sum of the anchored scaffolds was 210 Mb and the length of N50 was 25 Mb (Supplementary Table S8). However, 78 scaffolds and super-scaffolds were anchored with-out orientation information, because only a single marker could be used to anchor them to the map (Supplementary Table S4). Total 45 super-scaffolds were anchored to genetic map and 43 super-scaffolds were consistent with our genetic map suggesting the reliability of the synteny-based scaffolding method (Supplementary Fig. S3 and Supplementary Table S9).
Prediction of genes and repetitive sequences in adzuki bean.After masking the identified repetitive sequences, we implemented the structural and homology-based gene prediction procedure according to the MAKER pipeline14,15. In order to obtain direct evidence of gene expression, we extracted mRNA from adzuki bean flower, pod, leaf, and root tissues (Supplementary Table S10). The mRNA samples were sequenced using the Illumina HiSeq 2000 for subsequentde novo assembly using Trinity software16. The assembled contigs were pooled and supplied to the MAKER pipeline as the evidence of transcription and 26,857 high-confident genes were predicted. Using CEGMA pipeline, more than 86 percent of 248 core eukaryotic genes (CEG) could be completely matched to our genome assembly, and the 99 percent of 248 CEGs matched to the predicted proteins using BLASTP algorithm withE-value 1e-10 (Supplementary Table S4)17. To test the reliability of the predicted V. angularis gene set, we compared the sequence length distributions of the genes, coding DNA sequences (CDS), and introns to the gene models of P. vulgaris,G. max, andV. radiata.The density plot showed consistent distributions of CDS and intron length among the three legume genomes. However, the proportion of short genes (,250 bp) was
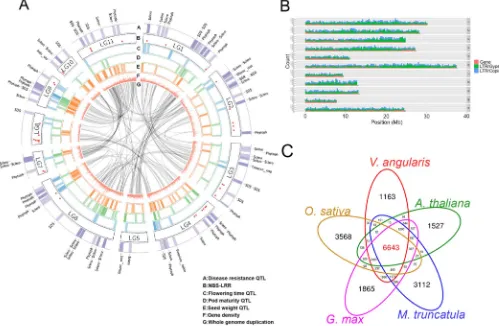
higher inV. angularis(Supplementary Fig. S5). Of the 26,857 high-confident genes, 15,976 were located on pseudo chromosomes (Fig. 1a, 1b and Supplementary Table S4). Clustering analysis was performed on the protein sets ofV. angularisvar.angularisand the protein sequences ofA. thaliana,M. truncatula,O. sativa,andG. max using OrthoMCL software18, and identified 6,643 gene clusters that are shared among all five species and 1,163 clusters that are specific toV. angularisvar.angularis(Fig. 1c, Supplementary Table S11). We could assign functional annotations to 21,532 genes using InterProScan and BLAST against Arabidopsis proteins (Supplementary Table S4).
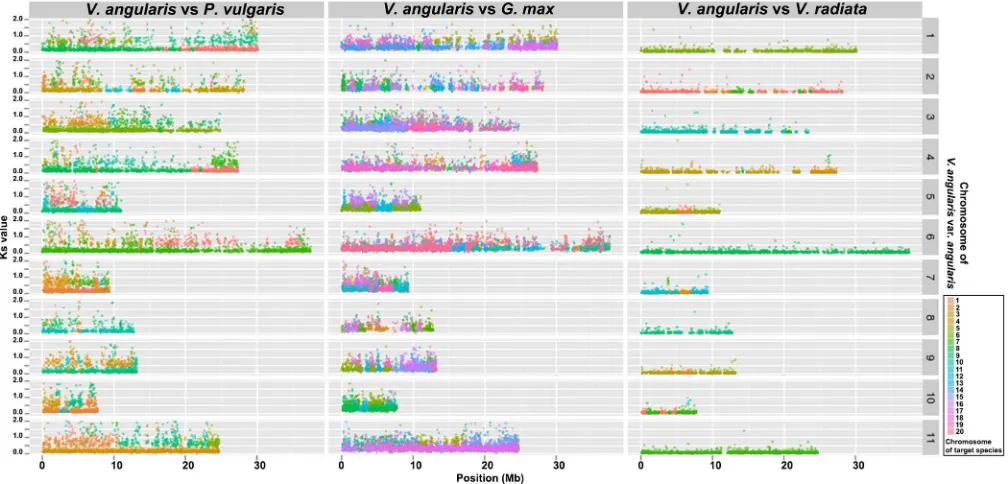
The predicted gene content ofV. angularisvar.angularisshowed extensive synteny relationship with closely-related warm season legumes includingG. max,P. vulgaris, andV. radiata(Fig. 2 and Supplementary Fig. S6). We examined the tissue specificity of gene expressions inV. angularisvar.angularisandV. radiatavar.radiata using RNA-Seq data from four different tissues (Supplementary Table S10 and Supplementary Fig. S7). There are 9,196 orthologs betweenV. angularisvar.angularisandV. radiatavar.radiatathat showed persistent tissue specificity, suggesting that gene functions were extensively retained even after speciation (Supplementary Table S12).
Using the Pfam annotations of each protein, we classified tran-scription factors according to the rules described in Lang et al.19. In total, 2,669 genes encoding transcription factors (TFs) were iden-tified in the adzuki bean genome. We compared the relative TF abundance with that of other plant genomes (Supplementary Table S13) and found the overall proportions of TF gene families to be similar in these plant genomes. However, bZIP2 consistently makes up less than 1% of the total TFs in legume genomes. This contrasts with non-legume genomes such asA. thaliana,Z. mays,O. sativa, andB. distachyonwhere bZIP2 represented more than 3% of all TFs, suggesting a possible gene loss event of this TF family in the common ancestor of legume plants (Supplementary Table S13).
We surveyed the repetitive sequences within the scaffold sequences to examine the abundance and distribution of transpos-able elements, which are known as major drivers of genome evolution20. Homology- and structure-based analysis revealed approximately 43.1% of sequenced adzuki bean genome as repetitive sequences (Supplementary Table S14). As in the other legumes and in that of the closely relatedV. radiata, the predominant repetitive sequences were annotated as long terminal repeat (LTR) retrotran-sposons5,6,21,22. Among the LTR retrotransposons, Gypsy and Copia constituted 19% and 10% of the adzuki bean genome sequences, respectively (Supplementary Table S14). DNA transposons, CACTA, Mutator, PIF-Harbinger, hAT, Helitron, MULE-MuDR, and Tc1-Mariner, were also detected, comprising approximately 2.7% of the adzuki bean genome sequences.
Domestication traces of adzuki bean.Human selection activities on crops have inflicted major effects on crop genomes, which ultimately result in domestication syndrome, which is marked by loss of seed shattering, minimization of seed dormancy, and an increase in both seed size and number23. To identify the domestication traces within the genome of V. angularis var. angularis, we sequenced wild relatives of adzuki bean, V. nepalensis (AusTRCF85148) and V. angularis var.nipponensis (IT241912) (Supplementary Table S2). Single paired-end libraries from each genotype were sequenced using Illumina HiSeq 2000 generating about 50 Gb of short reads
which represents more than 85-fold coverage of the adzuki bean genome. We also analyzed short read sequences of wild adzuki bean,Vigna nakashimae (IT178530), which was generated in our previous study24.
The 22-base k-mer frequency analysis of these short read sequences revealed a variation of genome size among wild adzuki beans (Supplementary Fig. S1). This is especially true forV. naka-shimae, which showed a much larger genome size thanV. angularis var.angularisand the rest of the wild adzuki beans.
We mapped the short read sequences onto our adzuki bean reference genome using Burrows-Wheeler Aligner software (Supplementary Table S15 and S16)25.V. angularisvar.nipponensis had 667,097 SNPs compared with the reference genome and the SNP frequency to total mapped regions (SNPs per kb) was 1.82. 75,476 of the identified SNPs are located within coding regions and 3,840 of those SNPs could potentially cause non-synonymous protein sequence changes in 1,421 gene products. We also identified 97, 932 insertions and deletions (INDELs) of which 14,033 were in cod-ing regions.
V. nepalensisshowed much higher polymorphism thanV. angu-larisvar.nipponensisas demonstrated by the presence of 3,511,378 SNPs (10.24 SNPs per kb). The number of SNPs in coding region was 433,210, and there were 18,034 non-synonymous SNPs that affected 6,464 genes. A total of 410,232 INDELs were identified and 71,337 were within coding regions.
V. nakashimaeshowed 3,342,795 SNPs and 624,856 intragenic SNPs. However, the ratio of aligned reads to total reads and the predicted number of INDELs were notably lower than those of other wild adzuki beans. This could be due to the difficulty of read mapping between the reference species (V. angularis) and the highly diverged species (V. nakashimae) showing notable genome size discrepancy (Supplementary Fig. S1).
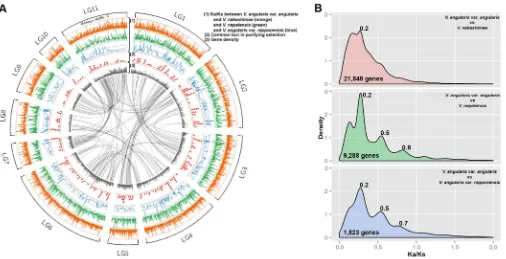
We compared orthologs between cultivated and wild adzuki bean to elucidate domestication-related loci. The orthologous coding sequences ofV. angularisvar.nipponensisandV. nepalensiswere reconstructed by substituting the coding sequences ofV. angularis var.angulariswith their respective SNP data. SinceV. nakashimae short reads were not efficiently mapped onto our reference genome, we performedde novoassembly of the short read sequences using ABySS software26and implemented gene prediction (Supplementary Table S4). From the ortholog comparison between cultivated and wild adzuki bean, we calculated the ratio of the number of nonsynon-ymous substitutions per non-synonnonsynon-ymous site (Ka) to the number of synonymous substitutions per synonymous site (Ks) to estimate the selective pressure on each gene (Fig. 3a).V. angularisvar.nipponensis showed the lowest number of polymorphic genes (1,823) in the Ka/ Ks calculation. We observed one consistent peak at Ka/Ks value of 0.2 suggesting purifying selection between cultivated and three wild adzuki beans (Ka/Ks,1)27(Fig. 3b). Notably, the Ka/Ks distribu-tions ofV. angularisvar.angularisxV.angularisvar.nipponensisand V. angularisvar.angularisxV. nepalensiswere highly similar con-sistently showing three peaks (0.2, 0.5, and 0.7,0.8). In both
com-parisons, a total of 307, 152, and 75 genes were commonly found within the three peaks, respectively (Supplementary Table S17). This suggests three different degrees of selection pressure on these loci between cultivated and wild adzuki bean. Even though a Ka/Ks of less than 1 has been interpreted as a signature of purifying selection27, a subset of the genes in each peak can be candidates for explaining the difference between wild and cultivated adzuki bean, such as spe-ciation and domestication (Supplementary Table S17). For example, the homologs to disease related genes in the second (0.4,0.6) and
third peak (0.6 , 0.9) such as Vang03g15160, Vang02g14420,
Vang0291s00070, Vang0229s00140, Vang02g14420 may possess
novel disease resistance alleles in wild adzuki beans which are distinct to those in cultivated adzuki bean (Supplementary Table S17).
Marker development and its utilization in breeding program.In order to produce genetic markers that are easily applicable for QTL mapping and marker assisted breeding programs, we identified simple sequence repeat (SSR) markers using MISA software28. A total of 143,113 SSRs were detected and the number of tri-repeat unit SSRs, the preferred type for genotyping, were 1,941 (Supplementary Table S18).
We predicted the associated QTLs to these SSR markers using translational genomics approach29.G. maxis a warm-season model legume crop closely related toV. angularisvar.angularisshowing co-linearity of most of the gene content (Fig. 2). Hence, the predicted QTLs from the comparison betweenG. maxandV. angulariswould be useful clue to determine genomic regions related to agriculturally important traits inV. angularisvar.angularisgenome30. We trans-lated the genomic positions of 2,010 QTL-associated SSR markers of G. maxto corresponding genomic positions ofV. angularisby 569 orthologous synteny blocks (Supplementary Table S19) and plotted the agriculturally important QTLs such as flowering time, maturity, seed size, yield, and disease resistance onto a circular map (Fig. 1a). The disease resistance QTLs were likely to be around the 87 genes that code for nucleotide-binding site (NBS) and leucine-rich repeat (LRR) domains, which are commonly associated with disease resist-ance (Fig. 1a and Supplementary Table S20)31. The flanking markers of these translated QTLs can be used for breeding programs (Supplementary Table S19). We also constructed a database contain-ing the gene information, genetic markers, and associated QTL data in Jbrowse environment, which can be accessed at http:// plantgenomics.snu.ac.kr/ (Supplementary Fig. S8).
Genome evolution of adzuki bean.Using 60 orthologs ofP. vulgaris, V. radiata,V. nakashimae,V. nepalensis,V. angularisvar.nipponensis, andV. angularisvar.angularis, we constructed a species tree (Fig. 4) (Supplementary Table S21). V. angularis var. angularis formed a distinct clade that included the wild adzuki beans in the species tree. As expected from genome size difference,V. angularisvar.nipponensis
Figure 2|Visualization of the synteny relationships among the closely related warm season legumes,V. angularis, V. radiata, P. vulgaris and G. max.
The x-axis indicates chromosomal locations of genes in synteny relationship, and the y-axis indicates Ks value of the corresponding gene pair, showing both conservation of gene order as well as chromosomal rearrangements of synteny blocks.
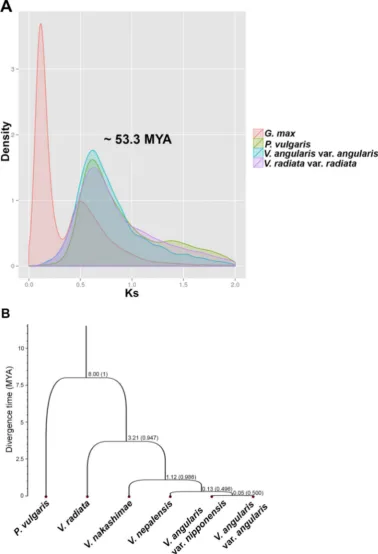
was closest toV. angularisvar.angularis, whereasV. nakashimaewas more diverged. We estimated the speciation times, which were calibrated using the divergence time, 8.0 million years ago (MYA), between Phaseolus and Vigna32. For our sampled accessions, the minimum speciation time between cultivated and wild adzuki bean was 0.05 MYA, which predated the archaeological evidence for adzuki bean cultivation (,5,000 years before present)4. The Ks density plot
calculated using synteny relationship within the legume genomes revealed the single ancient whole genome duplication at ,53.3
MYA based on the substitution rate, 6.1 3 1029 33, which is commonly shared among V. angularis,V. radiata, and P. vulgaris (Fig. 4). We identified 1,273 tandemly duplicated genes in the adzuki bean genome; these genes are highly enriched in the gene ontology categories of defense response, oxidation reduction, and phosphorylation, which is consistent with findings in other plant genomes (Supplementary Table S22 and Supplementary Fig. S9)34,35.
Discussion
Among AsianVigna, adzuki bean is an economically important grain legume due to its nutritional properties and popular use in dessert foods. A better understanding of adzuki bean genetics is important for more efficient breeding and in light of an increase in biotic and abiotic stresses on crops that may accompany climate change. The adzuki bean reference genome sequence and re-sequencing efforts of two different wild adzuki beans,V. angularisvar.angularisandV. nepalensis, presented in this manuscript, are a rich source of genetic markers, loci under degrees of selection pressure, and putative can-didate genes for several agriculturally important traits that were derived from translational genomics withG. max (Fig 1a, Fig 3a and Supplementary Table S19).
Plant genome complexity and the length of repeats that often exceed the insert size of present mate pair library technology can limit thede novoassembly of NGS reads to a certain saturation point. We largely improved the assembly by implementing the synteny-based scaffolding approach using gene order conservation between closely related legume species (V. angularisvar.angularis,V. radiata
var.radiata, andP. vulgaris). Thus, this method could be used as an alternative to the longer sequencing reads or mate pair library with larger insert size solving the assembly problem. In addition, we anchored super-scaffolds onto the genetic map constructed using the GBS-based genotypes of F4recombinant inbred lines ofV. angularis
var.angularisandV. nakashimae. Due to the segregation distortion, relatively small amounts of GBS-derived SNPs were used for construct-ing the genetic map. The possible cause of this segregation distortion in this population is the genome size difference of parental lines, which may result in ectopic recombination (Supplementary Fig. S1)36.
Even in our limited number of cultivated and wild adzuki bean samples, we could catch a glimpse of the speciation time betweenV. angularisvar. angularisand V. angularis var.nipponensis, which occurred at around 50,000 years ago. As the domestication time evidenced by archaeology was,5,000 before present4, we could
hypothesize that the domestication event by start of human cultiva-tion occurred after speciacultiva-tion between wild and cultivated adzuki bean. Additional population-level re-sequencing efforts of cultivated and wild adzuki beans would reveal the speciation time and also the domestication sites at higher confidence level, and also test the pre-vious hypothesis of multiple domestication sites ofV. angularis4.
Methods
Plant materials.The cultivated adzuki bean accession, Gyeongwon (V. angularisvar. angularis, IT213134), and wild adzuki bean accession (V. angularisvar.nipponenesis, IT241912) were provided by the Rural Development Administration (RDA) Genebank Information Center in Korea. The other wild adzuki bean (V. nepalensis, AusTRCF85148) was sourced from the Australian Collections of Plant Genetic Resources in Australia.
in MgSO4buffer mixed with DNA standards and stained with propidium iodide in a solution containing DNAase-free-RNAase. Fluorescence intensities of the stained nuclei are measured by FACScalibur flow cytometer (Becton-Dickinson, San Jose, CA). Values for nuclear DNA content are estimated by comparing fluorescence intensities of the nuclei of the testing sample with those of an appropriate internal DNA standard such as nuclei from Chicken Red blood cells (2.5 pg/2C),Glycine max (2.45 pg./2C),Oryza sativacv. Nipponbare (0.96 pg/2C), orArabidopaia thaliana
(0.36 pg/2C). For each measurement, the propidium iodide fluorescence area signals (FL2-A) from 1000 nuclei were collected and analyzed by CellQuest software (Becton-Dickinson, San Jose, CA).
For genome assembly of cultivated adzuki bean, we used the Illumina HiSeq 2000 using types of sequencing libraries such as two fragment libraries and two 5 kb and one 10 kb mate pair libraries. One additional single linear library was sequenced using the Roche GS-FLX1(Supplementary Table S2 and Supplementary Table S23). Figure 4|Analyses of the evolution of adzuki bean with comparison to closely related warm season legumes.(A) Estimation of WGD using the density plot of Ks values within each gene set ofV. angularis(blue),P. vulgaris(green),V. radiata(purple), andG. max(red). (B) Species tree of cultivated adzuki bean (V. angularisvar.angularis), wild adzuki beans (V. angularisvar.nipponensis,V. nepalensis, andV. nakashimae),V. radiata, andP. vulgaris. The divergence times of each nodes were estimated by a Bayesian MCMC method calibrated by the root divergence time (8 MYA) betweenPhaseolusand
Vigna. The posterior probability of each node is depicted in parentheses.
The assembles of Illumina HiSeq 2000 and GS-FLX1read sequences were imple-mented using ALLPATHS-LG9and Newbler, respectively. ALLPATH-LG was run with default parameter and Newbler was run with option -large and -trim for ‘‘runProject’’ command. The contigs generated by Newbler were chopped into pseudo fragment library reads and supplied to ALLPATHS-LG again. Software ABYSS was used for the assembly ofV. nakahsimaeusing the option k584 and q5
20 for ‘‘abyss-pe’’ command. The traces of repetitive sequences were searched using LTR-harvest38and TransposonPSI (http://transposonpsi.sourceforge.net/) with default parameters. The captured repetitive sequence blocks were annotated by LTR-digest39using a set of hmm signatures: PF03078.8, PF00385.17, PF01393.12, PF04094.7, PF07253.4, PF00552.14, PF05380.6, PF00077.13, PF08284.4, PF00078.20, PF07727.7, PF06815.6, PF06817.7, PF03732.10, PF00075.17, PF01021.12, PF04195.5, PF00692.12, PF00692.12, and PF00098. The hmm signature of AP_ty1copia and AP_ty3gypsy elements was built using their alignment information from GyDB40. We further utilized theG. maxTE classification based on sequence homology41. The predicted and annotated repetitive sequence blocks were supplied to RepeatMasker software as adzuki bean repetitive sequence library14.
Adzuki bean gene contents were predicted following MAKER pipeline15. RNA-Seq using Illumina HiSeq 2000 were implemented on mRNAs of the four different tissues (leaf, flower, root, and pod) of adzuki bean andde novoassembled using Trinity software with default parameter16. Contigs were pooled fromde novoassembly and redundant sequences were removed by the CD-HIT-EST algorithm in CD-HIT software42. The non-redundant transcriptome assemblies were supplied into the MAKER pipeline along withG. maxprotein sequences, and the complete protein sequences ofArabidopsisfrom Uniprot as evidence for the homology based gene prediction. Forab initiogene prediction, we used AUGUSTUS software43with mungbean (V. radiata) training set. The resulting protein sequences were annotated using InterProScan544.
Using the Pfam annotations from InterProScan result, transcription factors (TF) of adzuki bean proteins fromV. angularisvar.angularisandV. nakashimaewere classified based on the TF classification rules described in Lang et al19. For compar-ative analysis of TF contents, we further classified the TF from the protein sequences of 8 plant genomes (A. thaliana, G. max, M. truncatula, C. cajan, C. arietinum, B. distachyon, Z. mays, O. sativa).
Using Pfam45HMM profile of LRR domain (PF00560, PF07725, PF12799, PF13504, PF13516, PF13855 and PF14580) and NB-ARC domain (PF00931), we performed a genome-wide scan to find NBS and LRR domain containing proteins. The sequence blocks matched as LRR and NBS domain were re-aligned to construct
V. angularisvar.angularisspecific hmm profiles of LRR and NBS using the HMMER
software package with default parameter for ‘‘hmmbuild’’ command46. Using theV. angularis-specific hmm profiles, proteins with NBS and/or LRR domain were iden-tified using HMMER software package with default parameter for ‘‘hmmscan’’ command. The putative functions of NBS-LRR were annotated using the blast result against Uniprot database47.
We further linked the scaffolds based on the gene order conservation (synteny) of P. vulgaris,V. radiata, andV. angularis. The pairwise synteny relationships, and the Ks values of gene pairs were calculated using MCSCANX software11. The synteny blocks betweenV. radiataandP. vulgariswere used as links for scaffolding. We retrieved every link that could be deduced from synteny blocks and concatenated each other to build consensus links (Supplementary Fig. S3). The orientation of the scaffold was determined by the orientation of the gene orders of the synteny blocks used for links.
Genetic map construction.To construct a genetic map of adzuki bean, we genotyped 133 F4lines derived from the cross between Gyeongwon andV. nakashimae (IT178530) using genotyping by sequencing (GBS)12(Supplementary Table S23). The genomic DNA of each line was extracted and fragmented by the ApeKI restriction enzyme. Validated PCR fragments using the Agilent Technologies Bioanalyzer 2100 were constructed into GBS sequence library and were sequenced using the Illumina HiSeq 2000. We retrieved the sequences flanked with ApeKI restriction site fromde novoassembled scaffolds. The short reads were mapped onto the ApeKI flanking sequences using software Bowtie213. The genotypes of 133 RILs were collected from the genomic positions showing over 10 read depth, and we determined homo- and heterozygous genotypes following SAMtools genotyping statistics with default parameter48. If the arrays of paternal or maternal genotypes of 133 individuals within 1 Kb are consistent each other we regarded these sites as co-segregating block, and we used one representative site with lowest ‘N’ to construct genetic map. The genotypes of 133 F4lines were supplied to JoinMap 4, and we constructed 11 linkage groups using regression mapping algorithm with Kosambi mapping function.
Resequencing of three wild Vigna species.The sequence reads ofV. nakashimae,V. nepalensis, andV. angularisvar.nipponensiswere aligned to our reference genome of
V. angularisvar.angularisusing the BWA-MEM algorithm of BWA software with
default options25(Supplementary Table S23). The resulting read mapping files were supplied to AddOrReplaceReadGroups, MarkDuplicates, FixMateInformation, RealignerTargetCreator, IndelRealigner, BaseRecalibrator, PrintReads modules included in Picard (http://picard.sourceforge.net) and GenomeAnalysisTK (3.1–1 version) to optimize the sequence alignment49. As there is no comprehensive set of high-confidence known variant site for adzuki bean genome, we used the parameter – run_without_dbsnp_potentially_ruining_quality for BaseRecalibrator step. For variation calling process, the UnifiedGenotyper module of GenomeAnalysisTK was used. We set the off for the mapping quality as 30 and the sites lower than the
cut-off were ignored for further analyses. Moreover, we regarded the genomic positions showing the read depth over twice of the sequence coverage as duplicated region and discarded for accuracy of variation calling. Additionally, if more than four reads with zero mapping quality mapped on certain genomic position or the ratio of the read with zero mapping quality to total mapped reads exceed 10 percent, the genomic position was excluded.
Species tree construction.We constructed the species tree among the closely related diploid warm season legume species, such asP. vulgaris,V. radiata,V. angularisvar. angularis,V. angularisvar.nipponensis,V. nakashimae, andV. nepalensisbased on Bayesian Markov Chain Monte Carlo (MCMC) analysis using the 60 orthologous loci by*BEAST of the software package BEAST version 1.850. To find the high-confident ortholog, we used synteny relationship among four legume species such as,P. vulgaris, V. radiata,V. angularis, andM. truncatula. Even though we didn’t include theM. truncatulafor species tree construction, we used it to narrow down the confident orthologs. Among the retrieved orthologs, 60 highly conserved ones were chosen, that showed the low relative standard deviation (RSD,0.00001) of protein length to have clear speciation signal. To this confident ortholog set, we also added the
corresponding orthologs ofV. nepalensis,V. angularisvar.nipponensis, andV. nakashimae. The coding sequences of the orthologous loci were aligned using Prank software with –translation option51. The starting tree for the analysis was set to random, and we implemented four runs of MCMC with the length of chain 50 million and the parameters logged at every 5000 steps. The substitution model was determined using software ProtTest to choose JTT as best model52. The relaxed clock model with log normally distributed uncorrelated rates was used, and the divergence time for each node was calibrated using 8 MYA divergence ofVignaandPhaseolusof previous estimation32.
Accession codes.The adzuki bean genome information such as genome assembly, gene prediction and annotation, genetic markers, and other related files of this study can be searched and downloaded from http://plantgenomics.snu.ac.kr. This Whole Genome Shotgun project has been deposited at DDBJ/EMBL/GenBank under the accession JRFV00000000.
1. Parida, A., Raina, S. N. & Narayan, R. K. J. Quantitative DNA Variation between and within Chromosome Complements of Vigna Species (Fabaceae).Genetica82, 125–133 (1990).
2. Tomooka, N., Vaughan, D. & Moss, H.The Asian Vigna: genus Vigna subgenus Ceratotropis genetic resources.(Kluwer, Dordrecht, 2002).
3. Rubatzky, V. E., Yamaguchi, M., Rubatzky, V. & Yamaguchi, M.World vegetables: principles, production, and nutritive values.(Chapman & Hall New York, 1997). 4. Lee, G.-A. Archaeological perspectives on the origins of azuki (Vigna angularis).
Holocene23, 453–459 (2013).
5. Schmutz, J.et al. Genome sequence of the palaeopolyploid soybean.Nature463, 178–183 (2010).
6. Varshney, R. K.et al. Draft genome sequence of pigeonpea (Cajanus cajan), an orphan legume crop of resource-poor farmers.Nat Biotechnol30, 83–U128 (2012).
7. Schmutz, J.et al. A reference genome for common bean and genome-wide analysis of dual domestications.Nat Genet46, 707–713 (2014).
8. Kang, Y. J.et al. Genome sequence of mungbean and insights into evolution within Vigna species.Nat Commun5, 5443 (2014).
9. Gnerre, S.et al. High-quality draft assemblies of mammalian genomes from massively parallel sequence data.Proc Natl Acad Sci U S A108, 1513–1518 (2011). 10. Marcais, G. & Kingsford, C. A fast, lock-free approach for efficient parallel
counting of occurrences of k-mers.Bioinformatics27, 764–770 (2011). 11. Wang, Y. P.et al. MCScanX: a toolkit for detection and evolutionary analysis of
gene synteny and collinearity.Nucleic Acids Res40, e49 (2012).
12. Elshire, R. J.et al. A robust, simple genotyping-by-sequencing (GBS) approach for high diversity species.Plos One6, e19379 (2011).
13. Langmead, B. & Salzberg, S. L. Fast gapped-read alignment with Bowtie 2.Nat
Methods9, 357–359 (2012).
14. Tarailo-Graovac, M. & Chen, N. Using RepeatMasker to identify repetitive elements in genomic sequences.Curr Protoc Bioinformatics25, 4.10.1–4.10.14 (2009).
15. Cantarel, B. L.et al. MAKER: An easy-to-use annotation pipeline designed for emerging model organism genomes.Genome Res18, 188–196 (2008). 16. Grabherr, M. G.et al. Full-length transcriptome assembly from RNA-Seq data
without a reference genome.Nat Biotechnol29, 644–U130 (2011).
17. Parra, G., Bradnam, K. & Korf, I. CEGMA: a pipeline to accurately annotate core genes in eukaryotic genornes.Bioinformatics23, 1061–1067 (2007).
18. Li, L., Stoeckert, C. J. & Roos, D. S. OrthoMCL: Identification of ortholog groups for eukaryotic genomes.Genome Res13, 2178–2189 (2003).
19. Lang, D.et al. Genome-Wide Phylogenetic Comparative Analysis of Plant Transcriptional Regulation: A Timeline of Loss, Gain, Expansion, and Correlation with Complexity.Genome Biol Evol2, 488–503 (2010).
20. Lisch, D. How important are transposons for plant evolution?Nat Rev Genet14, 49–61 (2013).
22. Young, N. D.et al. The Medicago genome provides insight into the evolution of rhizobial symbioses.Nature480, 520–524 (2011).
23. Harris, D. R. Domestication of plants in the old world: The origin and spread of cultivated plants in west Asia, Europe and the Nile valley.Agr Hist Rev49, 226–227 (2001).
24. Lestari, P.et al. Genome-wide single nucleotide polymorphism discovery and validation in adzuki bean.Mol Breeding33, 497–501 (2014).
25. Li, H. & Durbin, R. Fast and accurate short read alignment with Burrows-Wheeler transform.Bioinformatics25, 1754–1760 (2009).
26. Simpson, J. T.et al. ABySS: a parallel assembler for short read sequence data.
Genome Res19, 1117–1123 (2009).
27. Kimura, M. Preponderance of Synonymous Changes as Evidence for Neutral Theory of Molecular Evolution.Nature267, 275–276 (1977).
28. Thiel, T., Michalek, W., Varshney, R. K. & Graner, A. Exploiting EST databases for the development and characterization of gene-derived SSR-markers in barley (Hordeum vulgare L.).Theor Appl Genet106, 411–422 (2003).
29. Cannon, S. B., May, G. D. & Jackson, S. A. Three Sequenced Legume Genomes and Many Crop Species: Rich Opportunities for Translational Genomics.Plant Physiol 151, 970–977 (2009).
30. Grant, D., Nelson, R. T., Cannon, S. B. & Shoemaker, R. C. SoyBase, the USDA-ARS soybean genetics and genomics database.Nucleic Acids Res38, 843–846 (2010).
31. Meyers, B. C., Kozik, A., Griego, A., Kuang, H. H. & Michelmore, R. W. Genome-wide analysis of NBS-LRR-encoding genes in Arabidopsis.Plant Cell15, 1683–1683 (2003).
32. Lavin, M., Herendeen, P. & Wojciechowski, M. Evolutionary Rates Analysis of Leguminosae Implicates a Rapid Diversification of Lineages during the Tertiary. Syst Biol54, 575–594 (2005).
33. Lynch, M. & Conery, J. S. The evolutionary fate and consequences of duplicate genes.Science290, 1151–1155 (2000).
34. Rizzon, C., Ponger, L. & Gaut, B. S. Striking similarities in the genomic distribution of tandemly arrayed genes in Arabidopsis and rice.Plos Comput Biol 2, 989–1000 (2006).
35. Hanada, K., Zou, C., Lehti-Shiu, M. D., Shinozaki, K. & Shiu, S. H. Importance of lineage-specific expansion of plant tandem duplicates in the adaptive response to environmental stimuli.Plant Physiol148, 993–1003 (2008).
36. Jenczewski, E.et al. Insight on segregation distortions in two intraspecific crosses between annual species of Medicago (Leguminosae).Theor Appl Genet94, 682–691 (1997).
37. Arumuganathan, K. & Earle, E. Estimation of nuclear DNA content of plants by flow cytometry.Plant Mol Biol Rep9, 229–241 (1991).
38. Ellinghaus, D., Kurtz, S. & Willhoeft, U. LTRharvest, an efficient and flexible software for de novo detection of LTR retrotransposons.BMC Bioinformatics9, 18 (2008).
39. Steinbiss, S., Willhoeft, U., Gremme, G. & Kurtz, S. Fine-grained annotation and classification of de novo predicted LTR retrotransposons.Nucleic Acids Res37, 7002–7013 (2009).
40. Llorens, C.et al. The Gypsy Database (GyDB) of mobile genetic elements: release 2.0.Nucleic Acids Res39, D70–D74 (2011).
41. Du, J. C.et al. SoyTEdb: a comprehensive database of transposable elements in the soybean genome.BMC Genomics11, 113 (2010).
42. Li, W. Z. & Godzik, A. Cd-hit: a fast program for clustering and comparing large sets of protein or nucleotide sequences.Bioinformatics22, 1658–1659 (2006).
43. Stanke, M., Tzvetkova, A. & Morgenstern, B. AUGUSTUS at EGASP: using EST, protein and genomic alignments for improved gene prediction in the human genome.Genome Biol7(Suppl. 1). S11.1–S11.8 (2006).
44. Quevillon, E.et al. InterProScan: protein domains identifier.Nucleic Acids Res33, W116–W120 (2005).
45. Finn, R. D.et al. Pfam: the protein families database.Nucleic Acids Res42, D222–230 (2014).
46. Finn, R. D., Clements, J. & Eddy, S. R. HMMER web server: interactive sequence similarity searching.Nucleic Acids Res39, W29–37 (2011).
47. Consortium, U. Reorganizing the protein space at the Universal Protein Resource (UniProt).Nucleic Acids Res40, D71–D75 (2012).
48. Li, H.et al. The Sequence Alignment/Map format and SAMtools.Bioinformatics 25, 2078–2079 (2009).
49. McKenna, A.et al. The Genome Analysis Toolkit: a MapReduce framework for analyzing next-generation DNA sequencing data.Genome Res20, 1297–1303 (2010).
50. Drummond, A. J. & Rambaut, A. BEAST: Bayesian evolutionary analysis by sampling trees.BMC Evol Biol7, 214 (2007).
51. Loytynoja, A. & Goldman, N. An algorithm for progressive multiple alignment of sequences with insertions.Proc Natl Acad Sci U S A102, 10557–10562 (2005). 52. Abascal, F., Zardoya, R. & Posada, D. ProtTest: selection of best-fit models of
protein evolution.Bioinformatics21, 2104–2105 (2005).
Acknowledgments
The research was supported by a grant from the Next Generation BioGreen 21 Program (Code No. PJ00811701), Rural Development Administration, Republic of Korea.
Author contributions
Y.K. designed the experiments and pipelines of bioinformatics. D.S. designed and performed the experiments and bioinformatics. S.S. performed the single nucleotide polymorphism (SNP) detection. T.L. annotated the genomes. J.L. performed the comparative genome analyses. W.H., S.K.K., P.L., K.L. conducted the transcriptome analyses. K.K., J.H., M.K., J.-K.M., J.-M.K., Y.L. created the mapping populations. A.C., R.K.V., B.-S.P. performed the genotyping-by-sequencing (GBS) experiments. J.-G.G. provided the experimental materials. S.-H.L. initiated and coordinated the project.
Additional information
Supplementary informationaccompanies this paper at http://www.nature.com/ scientificreports
Competing financial interests:The authors declare no competing financial interests.
How to cite this article:Kang, Y.J.et al. Draft genome sequence of adzuki bean,Vigna angularis.Sci. Rep.5, 8069; DOI:10.1038/srep08069 (2015).
This work is licensed under a Creative Commons Attribution 4.0 International License. The images or other third party material in this article are included in the article’s Creative Commons license, unless indicated otherwise in the credit line; if the material is not included under the Creative Commons license, users will need to obtain permission from the license holder in order to reproduce the material. To view a copy of this license, visit http://creativecommons.org/licenses/by/4.0/