India-China Bilateral
Trade Relationship
Final Version: 21.07.14
India-China Bilateral Trade Relationship
Study Prepared for Reserve Bank of India
By
Prof. S. K. Mohanty
Research and Information System for Developing Countries (RIS) New Delhi
http://www.ris.org.in
Table of Contents
1. Introduction 9
2. Macro-economic Development and the Outlook 12
2.1 Sustaining High Growth 12
2.2 Sources of Domestic Growth 16
2.3 Outlook for Macroeconomic Situation 27
2.4 Some Areas of Concern 28
3. Developments in Chinese Trade Policy: Its relevance for India 31
3.1 Economic Environment 31
3.2 Trade and Trade Policies in Key Sectors of Interest to India 41
4. India-China Bilateral Trade and Economic Relations 47
4.1 Trends in Chinese Trade with the World 47
4.2 Changing Trends of Bilateral Trade Engagement 48
4.3 Changing Composition of Trade 50
4.4 India’s Bilateral Trade Imbalance with China: Sustainability Issue 55
4.5 Regional Disparity in Trade in China 63
4.6 Constraints to India’s Exports to China 65
5. Changing Pattern of Tariff Liberalisation 67
5.1 Overall Liberalisation in the Tariff Regime 67 5.2 Impact of Trade liberalisation on Agricultural and Manufacturing
Sectors in India: A Simulation Analysis Using Computable General Equilibrium 72
5.3 India’s Export Potential in China 76
6. Sectoral Distribution of India’s Export Potential 79 6.1 Estimates of India’s Trade Potential in China 79 6.2 Export Potential of Currently and Potentially Traded Products 81
7. Engagement of China and India in Global Value Chain 84
7.1 Methodological Issues 86
7.2 Trade Dependence of China on GVC Sector 86
7.3 China’s trade linkages with the European Union and the United States 87 7.4 India’s Parts and Components Trade with China 88 7.5 India’s Sectoral Export potential in China and Competition
with ASEAN countries 89
8. Implication of Yuan Appreciation on Export Prospects of India
in the Third Country Markets 92
8.1 Emerging Issues 92
8.2 Literature Review 93
8.3 Empirical Model 94
8.4 Empirical Results 98
9. Approach towards Regional Trading Arrangements 105 9.1 Regional Interest of China and India in EAS: In a CGE Framework 106 9.2 ASEAN+3, ASEAN+4 or EAS: Results of Regional Welfare Gains 108
10. Conclusions 112
List of Tables
Table 2.1: Selected Economic and Social Indicators 15
Table 2.2: Contribution of Demand Components to GDP in China (%) 22 Table 2.3: Contribution of Demand Components to GDP in India (%) 26
Table 3.1: Structure of MFN Tariff in China, 2001-11 33
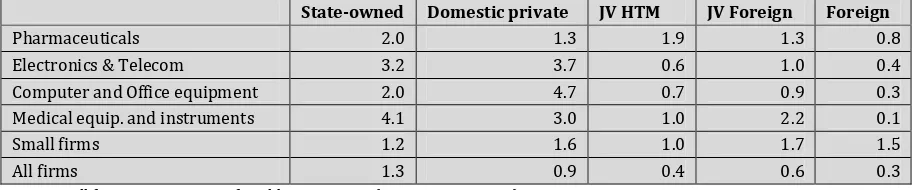
Table 3.2: R&D Intensity by ownership & size in selected sectors
(Per Cent of sales, 2004) 37
Table 4.1: China's Trade with the World Economy 47
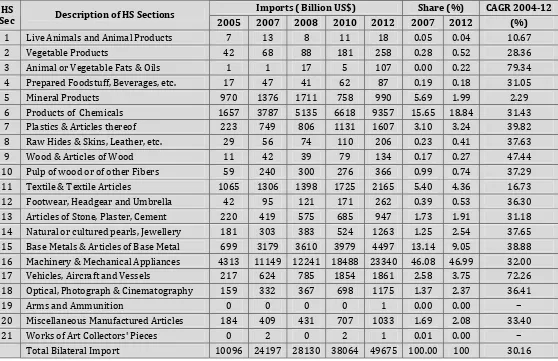
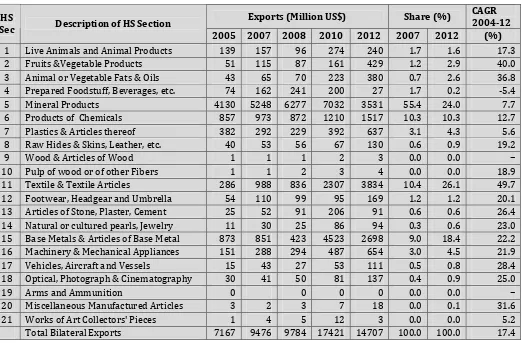
Table 4.2: India's Bilateral Trade Engagement with China 49 Table 4.3: Structure of India’s Bilateral Import from China: 2004-12 51 Table 4.4: Structure of India’s Bilateral Export to China: 2004-12 53
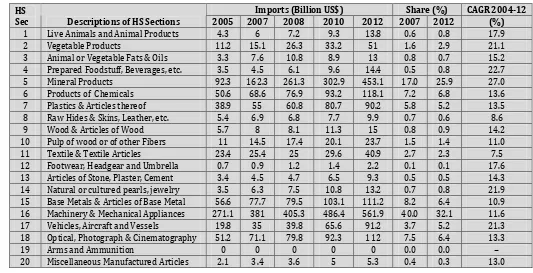
Table 4.5: China's Imports from World in 2004-12 54
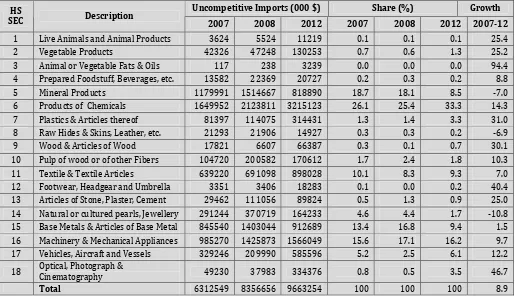
Table 4.6: India’s Uncompetitive Import from China: 2007-12 58 Table 4.7: Share of Uncompetitive intermediate imports in total intermediate
imports from China 62
Table 4.8: Regional Distribution of Trade in China 2003-12 63 Table 4.9: Distribution of Trade Activities in China Regions Close
to India: 2003-12 64
Table 5.1: Structure of Tariff in Both Countries 68
Table 5.2: Distribution of Average Import-Weighted Tariffs by HS Section 69 Table 5.3: Distribution of Simple Average Tariffs by HS Section 70 Table 6.1: Trade Potential of India in China during 2004-12 79
Table 6.2: Export Potential of India in China in 2012 82
Table 7.1: China’s Parts and Component Trade with the United States and the
European Union 88
Table 7.2: India’s sectoral export potential in China: Parts and Components 90 Table 7.3: India’s export more competitive than ASEAN in China:
Parts and component in 2012 90
Table 8.1: Panel Unit Root Test Results 99
Table 8.2: Kao (1999) Residual Cointegration Test 101
Table 8.3: Dynamic OLS Estimates of Cointegrating Regressions 103 Table 9.1: Alternative scenarios for East Asian Summit: simulation analysis 108 Table 9.2: Absolute Change in Welfare Gains from the East Asian Economic
Integration 109
Table 9.3: Welfare Gains from the East Asian Integration:
Boxes
Box 3.1 : R&D and Innovation in China 37
Box 4.1 : Classification of Technology Intensity of Tradable Products 56
List of Figures
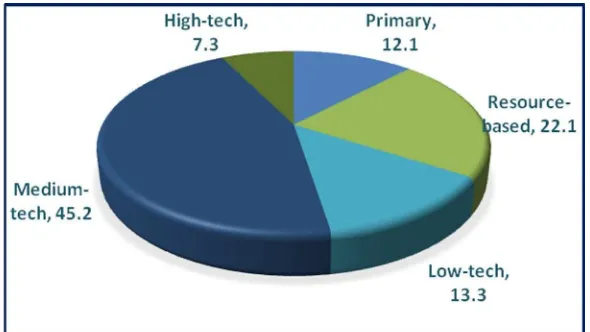
Figure 4.1 : India’s Uncompetitive Imports from China in 2012 60
Figure 5.1 : Chinese Response to Global Recession 71
Figure 5.2 : Agricultural Trade Deficit by Sector 74
Figure 5.3 : Impact of Manufacturing Sector Liberalisation on
Sectoral Trade Balance 76
List of Appendix
Appendix IA : Sectoral Aggregations for Agricultural and
manufacturing trade liberalisation in India: CGE 130 Appendix IB : Regional Aggregations for Agricultural and
manufacturing trade liberalisation in India 130 Appendix II : Export Competitiveness and Revealed Comparative
Advantage 131
Appendix III : Measuring Competitiveness and Export Potentials:
Viner’s Trade Creation & Trade Diversion 134 Appendix IV : Major Exporting Destinations Common to Both
India and China 136
Appendix V : Computable General Equilibrium Model for EAS 137 Appendix VI : Technology-Intensity of International Trade
India-China Bilateral Trade Relationship
S K Mohanty1
1. Introduction
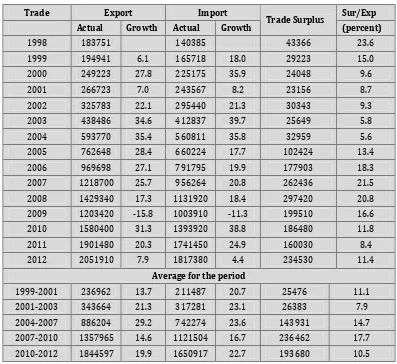
China has emerged as India’s largest trading partner after it replaced the United States in March 2008 (GoI, 2008). When India initiated its comprehensive reforms in 1991, the level of bilateral trade between the two countries was insignificant as the trade basket was restricted to a limited number of products. However within a short period, China has become India’s single most important trading partner even though India’s bilateral trade deficit with China reached an unsustainable level of US$ 39.1 billion in 2012 (IMF, 2013b). Policy makers will have to find ways to manage this huge deficit given that India can neither afford to limit its economic engagement with China nor continue with such a huge bilateral trade asymmetry for a long period of time.
China has been on a high growth trajectory for more than three decades, and even maintained a sustainable rate of growth at more than 9 per cent per annum during the period 2002-10. The rate of domestic expansion has been robust since its accession to the WTO in 2001. As is evident from statistics, the main drivers of China’s economic growth have been its export and a subsequent expansion of the domestic sector, accompanied by its import surge. During the above reference period, China’s export share in the world economy increased from 3.4 per cent to 10.4 per cent, while its imports rose from 4.4 per cent to 9.1 per cent, respectively. The global economy started recovering from recession in 2010, but with the deepening of the financial situation in Europe once again entered the danger zone and remained there until the third quarter of 2012. The global situation continued to remain fragile in 2013, and its adverse impact was felt in most of the emerging countries that included China and India. Although it suffered from global downturn, China has been strategising to take advantage from the expected recovery of the global economy.
In this context, it is significant that China’s external sector growth is mostly propelled by manufacturing exports. Technology is an important factor for both
1
production and exports as technology-embodied FDI and the domestic innovation system have contributed to the growth of product development for exports, often with the import of related services (Fu and Balasubramayam, 2005). With the changing industrial structure of the country, a large portion of Chinese exports istending towards high-tech exports. This trend coupled with mass production will sustain its high growth momentum for long (Mohanty and Chaturvedi, 2006). Further, with the Most Favoured Nation (MFN) and ‘market economy’ status, China is likely to dominate the global market with its aggressive promotion of exports.
However, sustained economic growth over a period of time has led to a rise in labour productivity and the domestic wage rates. With qualitative improvement in the labour force, the domestic sector is gradually shifting towards more knowledge-intensive industries. In the process, China has started losing its cost advantage in several sectors that span the primary, resource-intensive as well as labour-intensive industries (WTO, 2012). There are possibilities that some of these industries are likely to be shifted out of China and re-located in other countries including India but it remains to be seen whether India is gearing up for such a role! The implications of the Chinese trade strategy needs to be examined in the context of India’s trade options.
As China emerges as the largest trading partner of India, there are many bilateral issues that require close scrutiny. India’s bilateral trade gap is increasing along with its overall trade gap with the rest of the world. It is important to examine to what extent is this bilateral trade imbalance contributing to the overall trade imbalance of India. An important challenge for policy is the need to sustain the present level of trade between the two countries while narrowing the existing bilateral trade gap.
Equally important is a comparative analysis of the tariff policies of both countries because of their increased engagement with the world economy through their participation in various Regional Trading Agreements (RTAs) in Asia and in other parts of the world. Furthermore, reform processes in tariff policies in both countries are again, linked to their external sector performances. Relative external sector performance in both countries requires further investigation in the light of ongoing trade policy reforms.
There is presently global debate on the revaluation of the Chinese renminbi and the growing global imbalances. The implication of a revaluation of the renminbi on the export prospects of India is crucial for its trade with the rest of the world. Moreover, India’s trade is increasingly becoming ‘Asia Centric’, while its association with various RTAs has expanded during the last two and half decades. In this process, ties with SAARC and ASEAN have gained prominence for India in South and East Asia. Strategies by Indian policy makers can link the increasing profile of India with the countries that are part of the East Asia Summit (EAS) Process. These are pressing issues that need special consideration.
2. Macro-economic Developments and the Outlook
As India and China are the two fastest growing countries of the world, the possibility of an economic rapprochement among them to seize the synergies2 of their development is an interesting issue for discussion. Both the countries have witnessed transitions in their economic policies during the last two to three decades, and the irreversible nature of economic liberalisation has enabled each nation to integrate with the world economy. While analysing the existing patterns of their trade and the sectoral complementarities for further economic engagement, the comparative macroeconomic performance of both economies may be examined in recent years. The robustness of these economies may be seen from their macroeconomic performances.
2.1 Sustaining High Growth
China has increasingly attracted the attention of the global economic community during the last three decades due to its excellent track record in maintaining a high growth rate unparallel in the annals of the world economy3. Since 1980, it has been maintaining an average GDP growth of about 9 per cent per annum and has taken major strides in elevating large sections of its population above the poverty line. During the period of global buoyancy which spanned fom2003 to 2007, its GDP growth rate accelerated to more than 11.6 per cent per year, while its highest growth rate in recent time was recorded in 20074(see Table 2.1). The reoccurrence of the Global Financial Crisis in 2008 tapered global economic activities substantially. However, Chinese high growth profile was adversely affected with the persistence of a global economic downturn. Real GDP growth rate weakened sharply from 9.6 per cent in 2008 to 7.7 per cent in 2012, casting aspersions about the growth prospects of the country in future. In the Post-Asian Financial Crisis period, the external sector has emerged as the key source of China’s growth, and its exports and imports grew at the rate of 28.1 per cent and 25.4 per cent, respectively during 2003-08 and declined significantly during 2009-10. According to the Ministry of Commerce of China (MoCC, 2011), trade in services, which grew at a modest rate earlier, has registered a high growth in the recent years.5 Foreign direct investment added up to $378 billion cumulatively with about $108 billion in 2008. Rising current account surpluses combined with strong capital flows brought the net international reserves to about $1.55 trillion in 2007, surpassing those of Japan in the present decade. However, external sector performance was adversely affected during the period of recession.
2
The varied patterns of growth are examined during the period of reforms in both counties. For details, see Felipe, Lavina and Fan (2008). For a comparative analysis of India and China, see Kochak (2005).
3
For a brief discussion on China’s sustained growth, see Zheng, Bigste and Hu (2009). 4
China achieved a growth rate of 14.2 per cent in 2007 before it declined to 9.6 per cent in 2008 due to the global financial crisis towards the last quarter of the year. (IMF, 2012b).
5
The resilient Chinese economy dealt with intermittent occurrences of external shocks in recent years. It has effectively coped with shocks for example like the Asian Financial Crisis; the SARs epidemic; several major natural disasters including floods and earthquake, and the current episode of global recession, among others.
During the financial crisis of 1997-98 and 2008-12, the Chinese authorities evaded adjusting the exchange rate regime to reduce the pressure of crisis and instead launched a major Keynesian programme of reflation (estimated to have injected stimulus packages of about $1 trillion during ‘Asian Crisis’ and $0.6 billion6 during the present crisis to boost domestic demand) to keep up the growth momentum of the economy. Succumbing to international pressure, China has agreed to make appropriate corrections in the exchange rate.7 The prudent management of Chinese economic policies and other factors has led to a resurgence of the growth rate in 2010 butthe growth momentum was subdued until 2012. The IMF projection of Chinese growth rate has expressed pessimism in the medium term.
Among others, the demographic dividend remains one of the most important factors, determining the growth prospects of China in the next two decades. Growth prospects areaffected by the population structure because the dependency ratio, which is represented by relative size of the labour force to the total population, is the major yardstick of level of output. A rising share of workers in the population in China indicates that participation rate is properly accounted for in the production process. With declining fertility rate, there will be reduction in both population growth and dependency rate, leading to rise in the working age ratio. In case of India and China, increasing working age ratio would contribute to higher per capita income growth, or demographic dividend.
Various studies have indicated that China has passed through a phase of demographic restructuring, and demographic dividend has a major contribution to the recent growth profile of the country. The demographic dividend will continue for some time before it turns out to be adverse in the form of ‘demographic tax’. Chinese peak population will be 1.5 billion in 2032 before declining (Wolf, et al, 2011). The empirical analysis of Cai and Wang (2005) concluded that demographic dividend of China would cease to exist by 2015. ADB (2011) projected that China is expected to receive benefit of demographic dividend until 2020, and will incur ‘demographic tax’ in the 2020s. The prediction about erosion of Chinese demographic dividend in the next decade, particularly before reaching the status of a developed country, could be due to several reasons including rapidly aging population, rising dependency ratios, rising health costs for the elderly, sharp
6
The Chinese government announced an economic stimulus package of Yuan 4 trillion in November 2008 to boost domestic demand and to minimise the adverse effects of the global financial crisis on the domestic economy.
7
gender imbalances, etc (Wolf, et al, 2011). On the contrary, India is likely to gain from the demographic dividend. According to Aiyar and Mody (2011), India started receiving demographic dividend since 1980s, and it would contribute at about 2 percentage points per annum to India’s per capita GDP growth over the next two decades. It would not only address the issue of income convergence among Indian states but also focus on balanced growth of the regions. The working age population in China is expected to decline in the next decade where it is likely to rise in India. With the existing demographic character, India’s growth profile could outpace China’s for a considerable time (Economist, 2010). The level of demographic dividends in India and China are dependent upon the successful implementation of a range of policy choices during the period of transformation (Golley and Tyers, 2012).
Growth momentum of the Indian economy8 has been susceptive to the global business cycles (see Table 2.1). During the periods 2001-02 and 2008-12, India’s growth performance was limping as compared to the years of buoyancy in the global economy. Average GDP growth declined to 6.5 per cent during 2008-12from 9.5 per cent during 2005-07. The speed of recovery in India was slow in comparison to China, though both countries revived from the global recession in 2010. With a rebounding of the economy, India could post a robust GDP growth of 10.1 per cent in 2010, allowing per capita income to rise from $1159 in 2009 to $1432 in 2010. The per capita income, however, has stagnated at $ 1501 in 2012. During the last decade, India’s share in World Gross Product has increased from 4.0 per cent in 2003 to 5.7 per cent in 2011, but remained stagnant in 2012. Simultaneously, performances of exports and imports are yet to pick up in recent years.
However, the surge in the external sector performance of India is considerable below its potential. Strong inflationary pressure grappled the Indian economy during 2008-12, leading to a surfacing of numerous macro-economic imbalances in the domestic economy. Until 2005, India’s rate of inflation was under the permissible macro-economic ceiling of 5 per cent. With the onslaught of recession in 2008,the current account imbalance as a percentage of GDP went up to -4.8 per cent in 2012 from -1.0 per cent in 2006. In value terms, current imbalance grew from $15.7 billion in 2007 to $88.2 billion 2012, registering an unsustainable rise of CAD during the period 2007-12. Therefore, India’s recovery in 2010 was transitory in nature and the economy was not resilient enough to withstand the second episode of the global ‘double-dip’ recession.
8
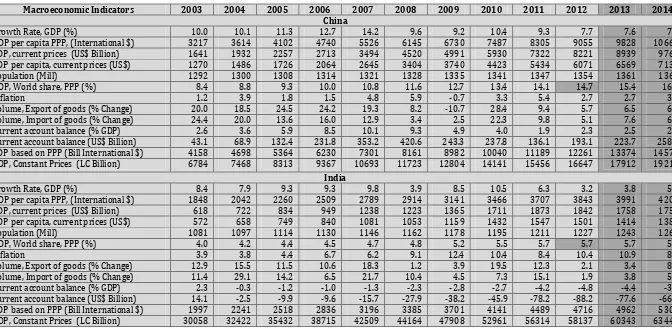
Table 2.1: Selected Economic and Social Indicators
Macroeconomic Indicators 2003 2004 2005 2006 2007 2008 2009 2010 2011 2012 2013 2014
China
Growth Rate, GDP (%) 10.0 10.1 11.3 12.7 14.2 9.6 9.2 10.4 9.3 7.7 7.6 7.3
GDP per capita PPP, (International $) 3217 3614 4102 4740 5526 6145 6730 7487 8305 9055 9828 10661
GDP, current prices (US$ Billion) 1641 1932 2257 2713 3494 4520 4991 5930 7322 8221 8939 9761
GDP per capita, current prices (US$) 1270 1486 1726 2064 2645 3404 3740 4423 5434 6071 6569 7138
Population (Mill) 1292 1300 1308 1314 1321 1328 1335 1341 1347 1354 1361 1368
GDP, World share, PPP (%) 8.4 8.8 9.3 10.0 10.8 11.6 12.7 13.4 14.1 14.7 15.4 16.0
Inflation 1.2 3.9 1.8 1.5 4.8 5.9 -0.7 3.3 5.4 2.7 2.7 3.0
Volume, Export of goods (% Change) 20.0 18.5 24.5 24.2 19.3 8.2 -10.7 28.4 9.4 5.7 6.5 6.8
Volume, Import of goods (% Change) 24.4 20.0 13.6 16.0 12.9 3.4 2.5 22.3 9.8 5.1 7.6 6.8
Current account balance (% GDP) 2.6 3.6 5.9 8.5 10.1 9.3 4.9 4.0 1.9 2.3 2.5 2.7
Current account balance (US$ Billion) 43.1 68.9 132.4 231.8 353.2 420.6 243.3 237.8 136.1 193.1 223.7 258.9 GDP based on PPP (Bill International $) 4158 4698 5364 6230 7301 8161 8982 10040 11189 12261 13374 14579 GDP, Constant Prices (LC Billion) 6784 7468 8313 9367 10693 11723 12804 14141 15456 16647 17912 19211
India
Growth Rate, GDP (%) 8.4 7.9 9.3 9.3 9.8 3.9 8.5 10.5 6.3 3.2 3.8 5.1
GDP per capita PPP, (International $) 1848 2042 2260 2509 2789 2914 3141 3466 3707 3843 3991 4209
GDP, current prices (US$ Billion) 618 722 834 949 1238 1223 1365 1711 1873 1842 1758 1750
GDP per capita, current prices (US$) 572 658 749 840 1081 1053 1159 1432 1547 1501 1414 1389
Population (Mill) 1081 1097 1114 1130 1146 1162 1178 1195 1211 1227 1243 1260
GDP, World share, PPP (%) 4.0 4.2 4.4 4.5 4.7 4.8 5.2 5.5 5.7 5.7 5.7 5.8
Inflation 3.9 3.8 4.4 6.7 6.2 9.1 12.4 10.4 8.4 10.4 10.9 8.9
Volume, Export of goods (% Change) 12.9 15.5 11.5 10.6 18.3 1.2 3.9 19.5 12.3 2.1 3.4 8.4
Volume, Import of goods (% Change) 11.4 29.1 14.2 6.5 21.7 10.4 4.5 7.3 15.1 1.9 3.8 5.0
Current account balance (% GDP) 2.3 -0.3 -1.2 -1.0 -1.3 -2.3 -2.8 -2.7 -4.2 -4.8 -4.4 -3.8
Current account balance (US$ Billion) 14.1 -2.5 -9.9 -9.6 -15.7 -27.9 -38.2 -45.9 -78.2 -88.2 -77.6 -66.1
GDP based on PPP (Bill International $) 1997 2241 2518 2836 3196 3385 3701 4141 4489 4716 4962 5302
GDP, Constant Prices (LC Billion) 30058 32422 35432 38715 42509 44164 47908 52961 56314 58137 60343 63449
Source: RIS based onWorld Economic Outlook, October 2013, World Bank.
2.2 Sources of Domestic Growth
The global debate on the choice of an appropriate development strategy has been changing radically during the last few decades. In the mid-seventies, there was a policy switch towards an export-led growth (ELG) strategy in several countries including in Asia. Constraints relating to the ELG strategy surfaced predominantly during the Asian crisis, and there was strong motivation to move to a Domestic Demand-Led Growth (DDLG) strategy in order to maintain high growth while keeping the economy resilient to the intermittent occurrences of external shocks9. Considering the advantages and disadvantages of both the approaches, India and China have been pursuing these strategies simultaneously to optimise their growth potentials from the constantly changing global and domestic situations. With global buoyancy, the ELG strategy receives priority, while the DDLG strategy dominates in the domestic policy during global recession.
The ELG strategy is focused on re-orienting the structure of domestic production to promote exports. Based on the neoclassical principles of ‘efficient allocation of resources’ between sectors, it is envisaged that exports would act as the engine of growth. In the changed policy environment, with exports firmly in the saddle, domestic demand was stimulated, and this process, in turn, encouraged savings and capital formation to expand with exports and economic growth. In the framework of the ELG strategy which is consistent with the principles of the ‘Washington Consensus’, exports gradually emerged as the growth simulator for the economy. The growing demand from the export sector, paved the way for introducing new and efficient technologies in exporting firms to meet the required quality and standards of various products. The spill over effects of technological up-gradation in select export sectors were felt in the rest of the economy. With a strong undercurrent of exports in the domestic economy and continuous investment in the exporting sectors, the supply potential of the economy in the tradable sectors increased over time. This, in turn, strengthened the import capabilities of the countries to support their increased need of the export sector.
During the post-war period, within the developing world some of the currently more advanced countries known as the ‘Asian Tiger’ were almost at a similar level of development as that of India. The rapid growth of these economies over a period of more than two decades brought another dimension to the ELG strategy as a development paradigm. Asia witnessed a ‘growth miracle’ in these countries during the period from 1970 to mid-1990s. However, the development gap between these and the rest of the developing countries widened. A key factor for the phenomenal growth of these fast growing economies has been the ‘export boom’ following adoption of the Export Led Growth strategy, which has effectively integrated these economies into the global economy. This strategy allowed development to transmit through the external sector channel, and export took the lead in shaping the growth process through a restructuring of the domestic production structure. Experiencing
9
the positive effects of the ELG, many countries from Latin America have also adopted a similar strategy (Herzer, 2006).
However, as an aftermath of the ‘Asian Financial Crisis’, the ‘High Growth Profile’ of the ELG regime as a credible strategy for enhancing growth and economic welfare was called into question, and its efficacy came under the scanner. Inconsistent performances of some of the sectors during the period of crisis raised doubts about the relevance of export-led growth as a growth stimulating strategy for the developing countries (Felipe, 2003). This called for a new development paradigm, which would insulate developing countries from the possibility of economic crises because of external shocks. In the post-crisis period, a gradual switching of policies towards Domestic Demand-Led Growth strategy yielded positive results and placed the developing economy back on the path of sustained high growth10.
Under the Domestic Demand-Driven Growth hypothesis, expansion in the components of domestic demand would lead to an increase in economic growth. Some of the factors contributing to domestic demand are private investment, government expenditure, consumption, etc. This hypothesis emphasises that GDP growth can be made sustainable with deep internal market demand. Therefore, growth in output can be triggered by growth of aggregate demand. The central focus of the approach would be to enhance the production capacity to comply with effective demand.
There are merits in both approaches to steering an economy to maintain steady growth over a long period. It is often discussed in the literature that these approaches are not either/or and competitive in nature. In many cases, they are rather complementary, even though they appear to be competitive. It is frequently seen in the literature that empirical evidences do not support the dominance of any of these approaches in a country/region because they contribute differently in diverse situations. It is the prerogative of a country to choose its future development paradigm to guide its growth process, particularly, one that will take it to a high growth trajectory.
The current literature provides sufficient evidence to show that the export-led growth strategy is not likely to sustain growth (Palley, 2011) because of the changing global situation. Now protectionism in the global trading arena has returned with a vengeance and the space of export activities has somewhat narrowed. The situation will be more complex for those countries, which are middle-income countries, aspiring to a high-income country level status. For accommodating the national priority of sustained growth within the framework of global norms (i.e., commitments to climate change, global standards, global governance, etc.), the new development paradigm suggests maximising domestic effective demand with Domestic Demand-Led Growth.
10
A critical examination of the development strategies of India and China indicates that these consist of a combination of both ELG and DDLG in recent years, particularly after the ‘Asian Financial Crisis’ (Mohanty and Chaturvedi, 2006; Li and Zhang, 2008; Mohanty and Arockiasamy, 2010). During the period of global recession, development policies are more inclined towards DDLG to maintain high GDP growth rate. During the phase of global recovery, export is pushed as a major driver of growth with an emphasis on Globally Dynamic Products (Mohanty, 2009).
Review of Literature
The Export-Led growth hypothesis has been dominating the development literature for the last four decades. Several studies examined the relationship between exports and growth in the 1970s and 1980s. Many of these studies (see for example, Michaely, 1977; Heller & Porter, 1978; Tyler, 1981; Feder, 1983; Kavoussi, 1984; Ram, 1987, Mohanty and Chaturvedi, 2006; Wah, 2004; Wong, 2007 and 2008) have supported the assertion that export growth has a strong association with growth of real output. Moreover, causation between the two variables is not established with certainty among different cross-section of countries and at different points of time. During the last several decades, such relationships were examined in the framework of time-series and in a cross-section of countries.
Several studies have (see for example, Jung and Marshall, 1985; Hsiao, 1987; Bahmani-Oskooee, et al., 1991; Dodaro, 1993 and Love, 1994; Love and Chandra 2005) used different time-series approaches to lend support to the export-led hypothesis. Their results are not conclusive in supporting the hypothesis, but rather mixed in nature. Taking a large set of 87 countries, Dodaro (1993) examined the causality between export growth and causality. Results of the study found weak support for the hypothesis that export growth promotes GDP growth. Using the Granger causality, Jung and Marshall (1985) found that the export-led growth hypothesis is supported by 10 percent of the sample in the cross-country analysis. The results of the study by Bahmani-Oskooee et al. (1991), combining Granger causality with Akaike’s Final Prediction Error (FPE) were to some agreement with the export-led-growth hypothesis, although the evidence is inconclusive. Using a similar methodology, with Johansen’s multivariate approach to cointegration, Love and Chandra (2005) examined the hypothesis of an export-led growth hypothesis for Bangladesh. The findings suggest that the direction of both long- and short-term causality is from income to export and therefore country inward trade strategy of development discriminated against export.
examine efficacy of export-led growth in China. They proposed a new methodology to estimate the direct and indirect contribution of exports to GDP growth. Their results indicate that a 10 percent increase in export growth would lead to 1 percent growth in GDP in the 1990s.
In a recent paper, Mohanty (2012a) examined the possibility of maintaining a sustained high growth performance in India while simultaneously pursuing both ELG and DDLG strategies. Since India falls in the Low Middle Income Country Group, it has a large number of products with export competitiveness globally. Time Series analysis with the VECM model reveals that both strategies have a significant long-term relationship with income. If India’s medium-long-term growth performance were sustainable, India’s trade integration with ASEAN would be strengthened with either ELG or by a combination of both strategies. India’s interest could be to pursue both strategies alternatively to maintain sustained high growth until its export competitiveness is fully realised.
In the case of China, a study by Tang and Selvanathan (2008) suggested that FDI had not only compensated a shortage of capital but also induced high economic growth through domestic investment. Therefore, FDI encouraged the relevance of the DDLG strategy in China.
Wah (2004) tried to examine the specific paradigm of development that contributed to the high growth phase of the Malaysian economy during the period 1961-2000. During the high growth period, export remained an important factor in the economic transformation of the economy. However, various studies examining the export-led hypothesis in Malaysia found weak support for this hypothesis in the long run, and this could be because of exclusion of various factors relating to domestic demand in the models. Results support the domestic demand hypothesis in the long run, but the export-led hypothesis was not supported by the empirical findings. In another study, Wong (2008) examined the relevance of development stance of some of the South East Asian countries, particularly ASEAN-5, during and after the ‘Asian Economic Crisis’. The regional overview indicated that there was bilateral Granger causality between exports and economic growth, and private consumption and economic growth. The empirical findings could not suggest that the crisis in the region was due to export-led growth. The broad conclusion of the study is that sustained economic growth requires steady growth in the exports and domestic demand. A similar hypothesis was examined by Wong (2007) for some Middle East countries including Bahrain, Iran, Oman, Qatar, Saudi Arabia, Syria and Jordan, and found that sustainability of economic growth went hand in hand with growth of both exports and domestic demand. However, the results were less conclusive to support any development strategy responsible for sustained economic growth in the Middle East region.
growth prospects of a country are empirical issues, which can be examined in case of India and China.
Growth Accounting Approach
From the above discussion it is relevant that both India and China are maintaining high growth over a long period despite turbulences at the level of both the domestic and global economy. The resilience of these economies has been the outcome of the policy priorities associated with alternative development strategies, which vary from time to time in order to catch up with different economic situations. An exercise is to examine the contribution of domestic demand and the external sector to aggregate growth in both countries follows. It may be interesting to note that the relative contribution of both the components (i.e., domestic demand and external sector) vary with the changing global situations. The computations of growth decomposition are based on the procedures developed by Felipe and Lim (2005).
GDP growth in the year t is explained by the following macroeconomic identity:
gdpt = [ct*(Ct-1/GDPt-1) + gt*(Gt-1/GDPt-1) + it*(It-1/GDPt-1) + xt*(Xt-1/GDPt-1) - mt*(Mt-1/GDPt-1)] ……….(1)
or gdpt= C+ G+I +X -M……….….……… (1a)
where GDP = gross domestic product; C = private consumption; G = government consumption; I = investment; X = exports; M = imports; gdp = GDP growth; c = consumption growth, g = govt. consumption growth; x = export growth and m = import growth
C= growth rate of consumption weighted by its share in GDP I = growth rate of investment weighted by its share in GDP
G= growth rate of government consumption weighted by its share in GDP
X = growth rate of exports weighted by its share in GDP M = growth rate of imports weighted by its share in GDP
Equation (1) gives the relative contribution of different components of aggregate demand to GDP growth in a particular year. From this formulation, the percentage contribution of each demand component can be derived by the following method:
Consumption = *100 ÷÷ø ö ççè æ
gdp C
……….. (2)
It is hypothesised that contribution of domestic demand, such as consumption, investment and government expenditure is expected to be significant during global recession whereas the external sector contribution should be robust during the period of global buoyancy. As the global economy passed through different phases of the business cycle, both countries continued to maintain high growth performances during the last two decades due to a suitable interplay of both ELG and DDLG strategies.
Analysis for Growth Decomposition: China and India
China has simultaneously pursued export-led and domestic demand-led growth policies to place the economy on a high growth trajectory in a sustainable manner. The investment-led domestic demand and the export sector have been the drivers of growth for the Chinese economy. The experiences of developing countries suggest that both export-led growth and domestic demand-driven growth have positive as well as negative effects on economic growth; and neither of these appears to be appropriate to be pursued in isolation. In recent years, the contributions of both the strategies to overall GDP growth in China follow the behaviour pattern of the global business cycle, thus, it insulated the high growth momentum in these countries from the adverse effects of exogenous shocks. Simultaneous pursuance of both these strategies of domestic demand and export-led growth can ensure consistently high growth irrespective of the nature of the global business cycle.
During the last few years, exports have been expanding rapidly in real terms and the impact of exports on employment has been profound (Mohanty and Chaturvedi, 2006), thus contributing towards the alleviation of poverty. Exports have generated substantial employment opportunities due to sustained demand for industrial products in the global market.
The impact of the global business cycle on domestic economic growth has been different for various elements in the income identity during different phases of the cycle. A growth decomposition analysis for the Chinese economy indicates that contributions of domestic demand and exports to overall growth have been different across various phases of the global business cycle, but their combined contribution to growth has been significant and consistent during the last decade. During the period 2001-03, the global economy grew at an average rate of 2.9 per cent during the economic downturn and increased to 4.9 per cent on an average annually during the global buoyancy of 2004-07. The world economy was struck by recession in a major way twice recently in the form of ‘Asian Economic Crisis’ during 1997-98 and then since 2008, with a marginal improvement in 2010 before relapsing into crisis.
economic boom. A reversed trend is apparent for the export sector in its contribution to growth. Decline in the contribution of a growth factor is compensated by another growth-inducing factor in one episode of the business cycle, leading to restoration of the overall growth rate of Chinese economy maintained at a high level.
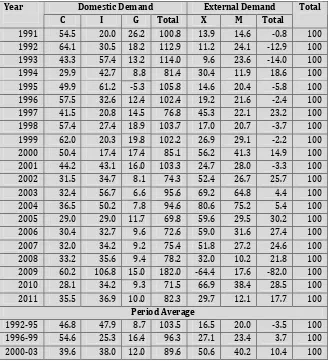
Growth decomposition for China is estimated for the period 1991-2011 using equation (1) and (2). For examining the contribution of different sectors to growth in different phases of the global business cycle, we have referred to different time periods in the analysis as presented in Table 2.2. The empirical results indicate that during the phase of recession (i.e., 1996-99), the contribution of the external sector to overall GDP growth was 3.7 per cent per annum on an average and went up to 21.9 per cent per annum to the GDP growth during buoyancy (i.e., 2004-07). It is observed that the contribution of exports to GDP growth during recession declined from 24.6 per cent in 2007 to -82.0 per cent in 2009, and the loss of external demand was adequately compensated by domestic demand, mostly by consumption and investment.
Table 2.2: Contribution of Demand Components to GDP in China (in %)
Domestic Demand External Demand
Year
C I G Total X M Total
Total
1991 54.5 20.0 26.2 100.8 13.9 14.6 -0.8 100
1992 64.1 30.5 18.2 112.9 11.2 24.1 -12.9 100
1993 43.3 57.4 13.2 114.0 9.6 23.6 -14.0 100
1994 29.9 42.7 8.8 81.4 30.4 11.9 18.6 100
1995 49.9 61.2 -5.3 105.8 14.6 20.4 -5.8 100
1996 57.5 32.6 12.4 102.4 19.2 21.6 -2.4 100
1997 41.5 20.8 14.5 76.8 45.3 22.1 23.2 100
1998 57.4 27.4 18.9 103.7 17.0 20.7 -3.7 100
1999 62.0 20.3 19.8 102.2 26.9 29.1 -2.2 100
2000 50.4 17.4 17.4 85.1 56.2 41.3 14.9 100
2001 44.2 43.1 16.0 103.3 24.7 28.0 -3.3 100
2002 31.5 34.7 8.1 74.3 52.4 26.7 25.7 100
2003 32.4 56.7 6.6 95.6 69.2 64.8 4.4 100
2004 36.5 50.2 7.8 94.6 80.6 75.2 5.4 100
2005 29.0 29.0 11.7 69.8 59.6 29.5 30.2 100
2006 30.4 32.7 9.6 72.6 59.0 31.6 27.4 100
2007 32.0 34.2 9.2 75.4 51.8 27.2 24.6 100
2008 33.2 35.6 9.4 78.2 32.0 10.2 21.8 100
2009 60.2 106.8 15.0 182.0 -64.4 17.6 -82.0 100
2010 28.1 34.2 9.3 71.5 66.9 38.4 28.5 100
2011 35.5 36.9 10.0 82.3 29.7 12.1 17.7 100
Period Average
1992-95 46.8 47.9 8.7 103.5 16.5 20.0 -3.5 100
1996-99 54.6 25.3 16.4 96.3 27.1 23.4 3.7 100
2004-07 32.0 36.5 9.6 78.1 62.7 40.8 21.9 100 2008-11 39.2 53.4 10.9 103.5 16.1 19.6 -3.5 100
Source: Computation based on data from World Development Indicators Online [Accessed on October 25, 2013)
Among the drivers of domestic demand, the most important source of growth was investment which grew at a double digit rate during the present decade. The decomposition results show that 36.5 per cent of GDP growth came from investment as against 21.9 per cent from net exports during 2004-07. Buoyancy returned to the world economy during 2004-07, and global demand picked up. With the changing phase of the global business cycle, exports of China surged and so also its contribution to growth. The share of exports to GDP growth jumped to nearly 62.7 per cent per annum and contribution of investment reduced to 36.5 per cent on an average during 2004-07. On account of strong complementarities between the export-led growth and domestic demand-led growth, mostly led by the investment factor, Chinese overall growth performance was unhindered substantially during the decade. The Chinese economy grew at an average rate of 9.4 per cent during the global downturn and maintained an average growth rate of 12.1 per cent during the global boom (2004-07).
The high investment rate in the country was more than fully supported by an increase in domestic savings, which increased from 35.5 per cent of GDP in 2001 to 53 per cent in 2007 and led to a substantial current account surplus. Such high rates of domestic savings obtain from a number of peculiar characteristics of the Chinese economy and also from the high savings of state-owned enterprises which are not required to pay dividends to the government. While foreign direct investment has assisted growth, more than 50 per cent of investment consisted of self-financing by enterprises including that made by state-owned enterprises. Foreign direct investment was none the less substantial and the bulk of it was directed to manufacturing as a platform for export: foreign invested enterprises (FIEs) based in China conducted a substantial part of China’s foreign trade, undertaking more than half of manufactured exports. FDI served as a platform, enabling China to manufacture products that met world-market specifications with regards to quality, design, and technological content.
Government-to-government relations thus remain crucial for China’s trading partners including India.
China is dependent on the external sector, but the contribution of this to GDP has started declining. This is evident from the falling share of domestic demand in GDP. Although the contribution of net exports to GDP has gone up substantially during 2002-04, the Chinese economy is largely characterised by the dominance of domestic economic activities. Similar trends exist for India.
The external sector in China constituted more than 20 per cent of its GDP growth during global buoyancy (2004-07). During 2002-08, export contribution remained significantly higher than imports and other components of demand. However, contribution of exports remained negative (-64.4 per cent in 2009), leading to net negative contribution to growth during global crisis (2008-09). This shows a declining relevance of ELG in case of China.
China is passing through a phase of rapid structural change, leading to growing imbalances in its current account position. As reported by the IMF (2012c), country’s international reserves increased from $615 billion in 2004 to $3.2 trillion at the end of 2012. Surging of Chinese international reserves over a period has been construed as the key reason for the continuation of the recent episode of global imbalance. China has been experiencing current account surplus (CAS) since the early 1990s, even during the period of ‘Asian financial crisis in the mid-1990s. The nature of current account surplus has undergone radical change over the years. As a percentage of GDP, CAS reached its peak of 10% in 2007, and started declining (Cline, 2012) in the following years. Various reasons are provided in the literature to explain secular failing of Chinese CAS ratio including robust import demand against declining terms of trade (IMF, 2012c), widening resource gap (EAF, 2012), and real appreciation of exchange rate (Cline, 2012; Cline and William, 2011), etc among others.
While Chinese consumption as a share of GDP has been growing steadily, savings ratio graph is moving towards a phase of plateau and then falling off significantly from its present level of 50 per cent of GDP. There are some tendencies towards surge in the consumption behaviour in the country. China’s private consumption has been growing within the range of 8-9 per cent per annum during the last two decades, and this has been fuelled by growing demand for consumer durables. Falling savings ratio, rising consumption and pressure on investment have a combine effect on widening of domestic resource gap, which will put pressure on China’s current account balance (EAF, 2012). China is likely to witness robust import growth because of surging private consumption and investment demand in the medium term. Indications of secular worsening of the country’s terms of trade would have a lasting impact on its adverse export performance. Divergence between imports and exports may have long-term implications for its current account balance (IMF, 2012c). Recent empirical studies11 (Cline, 2012; Cline and William,
11
2011) suggest that a key reason for decline in the share of CAS in GDP is substantial real appreciation of the exchange rate. Other factors contributing to this process include world oil prices, slower world growth and an erosion in the capital services accounts but these are secondary factors as compared to appreciation of Yuan.
The present trend indicates that there will be a lasting decline in the Chinese current account surplus in the medium term. IMF (2012a) projects that CAS as a share of GDP will be 2.3 percent in 2012 and 2.5 per cent in 2013. Cline (2012) observes that CAS ratio would be in the range of 2-4 per cent of GDP over next six years. There are several counterfactual results showing expected CAS ratio in 2017. Results of Cline and William (2011) suggest that it would be 5.4 percent whereas IMF (2012a) predicted at 4.3% in 2017. Cline (2012) has predicted CAS ratio in a range of ±2 per cent of GDP in 2007, depending upon exchange rate policy of the government. However, through various channels, the current account surplus is going to dip in the medium term.
Table 2.3: Contribution of Demand Components to GDP in India (%)
Source: Computation based on data from World Development Indicators Online accessed on October 25, 2013.
Note: We dropped 1991, because it happened to be an abnormal year for India
India’s growth records during its two decades of reforms are presented in Table 2.3. Domestic demand during the ‘Asian Financial Crisis’ was significant. In comparison with China, consumption and government expenditure remained major driver of domestic demand during the global recession (1996-99). During global buoyancy (2004-07), GDP growth in India was fuelled equally by consumption and investment. The contribution of consumption to overall growth in India was much stronger than it was for China during the same period. Investment as an instrument to support the growth momentum in India has been fragile during the period of global boom. Over the years, in India, export sector contribution to growth has been improving starting with the ‘Asian Economic Crisis’. During the recent episode of global recession, domestic demand-led growth had been the major policy to maintain high growth, and consumption was the single largest contributor to growth during 2008-09 (181.5 per cent). Government expenditure also played an important role during recession to maintain an overall growth performance.
Domestic Demand External Demand
Year
C I G Total X M Total
Total
1992 46.8 71.2 9.1 127.1 7.8 34.8 -27.1 100
1993 179.0 -80.2 35.4 134.2 50.4 84.6 -34.2 100
1994 57.5 60.5 2.9 120.9 17.7 38.6 -20.9 100
1995 51.3 45.4 9.5 106.3 28.0 34.3 -6.3 100
1996 115.6 -47.5 11.2 79.4 13.6 -7.0 20.6 100
1997 48.8 60.7 19.4 128.9 -3.6 25.3 -28.9 100
1998 81.9 18.6 21.4 121.9 19.5 41.4 -21.9 100
1999 41.3 41.2 11.5 94.1 14.2 8.3 5.9 100
2000 117.6 -93.9 9.1 32.8 102.6 35.4 67.2 100
2001 56.3 38.1 4.2 98.6 7.7 6.4 1.4 100
2002 52.9 22.2 -0.7 74.4 79.4 53.8 25.6 100
2003 61.5 46.3 5.1 112.9 21.6 34.5 -12.9 100
2004 28.2 66.2 3.5 97.9 31.8 29.7 2.1 100
2005 57.2 49.8 9.1 116.1 43.0 59.2 -16.1 100
2006 53.0 51.9 4.0 108.9 40.5 49.4 -8.9 100
2007 52.1 50.6 8.0 110.8 10.7 21.4 -10.8 100
2008 181.5 -22.1 36.9 196.4 108.3 204.7 -96.4 100
2009 51.0 39.9 13.0 103.9 -9.5 -5.6 -3.9 100
2010 46.7 50.1 5.5 102.4 33.3 35.7 -2.4 100
2011 129.4 13.6 21.9 164.9 80.1 145.0 -64.9 100
2012 75.9 53.9 12.0 141.7 19.8 61.5 -41.7 100
Period Average
1992-95 83.7 24.3 14.2 122.1 26.0 48.1 -22.1 100
1996-99 71.9 18.3 15.9 106.1 10.9 17.0 -6.1 100
2000-03 72.1 3.2 4.4 79.7 52.8 32.5 20.3 100
2004-07 47.6 54.6 6.2 108.4 31.5 39.9 -8.4 100
However, the export sector has been consolidating its contribution to growth despite enlargement of the current account deficit in recent years.
Despite broad similarities in the overall economic structure, there exist stark differences in the composition of domestic demand in the two economies. While GDP growth in both economies remained consumption-led in the 1990s, the role of investment in domestic demand improved for China in 2000-09. On the other hand, India continued to maintain a high level of dependence on private consumption marking a 7.4 per cent rise from 54.8 per cent in 1991-2000 to 62.2 per cent in 2000-09.
Compared to China, the share of investment in GDP was lower for India during the period 2000-03. In subsequent years, the share of investment of both the countries was more or less comparable varying around 35 per cent. For instance, the average contribution of investment to GDP was found to be 48 per cent during 2002-07 whereas it hovered around 40 per cent in China.
The relative share of government consumption declined in both the countries during the last decade. It dropped from 13 per cent to 12 per cent in China and from 11 per cent to 10 per cent in India over the period of two decades between 1991-2000 and 1991-2000-12.
To sum up, it can be concluded that the present level of external exposure for India and China is quite consistent with the medium-term growth potential of the two economies. Alternatively, it suggests that the downside risk of double-dip recession was strong for India whereas it could be lesser for China due to strong economic fundamentals. In view of weak external demand, both the countries have some leeway in pursuing domestic demand-based economic policies during the crisis period.
2.3 Outlook for Macroeconomic Situation
According to the IMF (2012a), recovery in China has been stronger than it was predicted earlier on account of the picking up of business activities and financial market in 2010. Resumption of the economy with a high growth rate was expected as an outcome of the macro-economic policies along with high capital inflows. GDP growth rate increased to a double digit figure in 2010 and declined significantly to 7.7 per cent in 2012. It is projected to decline further to 7.3 in 2014. Other reports including the ADB (2012) and ESCAP (2012) have predicted similar trends in real GDP growth rate12 in the medium term. The Chinese Ministry of Commerce (2011) has reported robust domestic growth in 2010 on account of the cascading effects of policy stimulus made earlier. However the recent forecasts indicate about marginal weakening in the growth prospects of China between 2013 and 2017 (IMF, 2013a).
12
As expected, the Chinese external sector picked up fast in 2010 and 2011 according to the ADB (2012). With the modest recovery of the world economy, Chinese exports grew at a rate of 13 per cent and imports by 13.5 per cent in 2010 due to a robust domestic demand, higher global prices for oil and rising prices of primary commodities. Though world output growth declined from 5.1 per cent in 2010 to 3.8 per cent in 2011 (IMF, 2012b). Chinese exports and imports growth rates were robust during the corresponding period. The Chinese Ministry of Commerce (2011) forecasted a robust growth of the Chinese external sector on account of an expected boom in the domestic economy as well as due to recovery of the developing countries. In 2010, exports grew at the rate of 31.4 per cent and imports by 39.1 per cent amidst persistence of multiple international problems including continuation of the global financial crisis; increasing sovereign debt risks in some countries; persistence of protectionist measures; and domestic concerns like rising inflationary pressure, occurrences of intermittent natural disasters, fast rising of housing prices in urban cities, latent risks in fiscal and financial sectors, etc. Although the pace of Chinese overall exports and imports growth rates slowed down in 2012 in comparison with the previous year, the levels of growth rates were robust. The Chinese government took a strong commitment that the macro policies were effectively managed to ‘enhance quality and efficiency of economic growth, strengthening and targeting flexibility of macroeconomic policies and strive for a steady and faster economic development.’ There is now a growing consensus that China may become the largest economy in the world, pushing the US economy to the second position by 202013.
2.4 Some Areas of Concern
While the performance of China has been exceptional, for bilateral trade there are, of course, many areas of concern, some of which have special significance for India. First, China is experiencing large and increasing inequalities within the economy. Several regions close to India (especially in South West China) are among the laggards in development. There are several government initiated special programmes to help the under-developed regions, which include public investment as well as preferential treatment for FDI in these areas14. These regions border on India, so they may be of special interest to India in terms of trade as well as investment policy.
Second, as noted above, growth in investment has been very high, perhaps excessive from a prudential point of view. There are major risks pertaining to the poor quality and viability of investments. There are various government efforts to rein in investment and to stimulate consumption. So far success in these efforts has been modest. In case investment slows down, it may have implications for India’s exports of iron ore and other raw materials.
13
For more discussion on the issue, see Wilson and Purushothaman (2003); Holz (2008) and OECD (2012). 14
The third issue is that raised by the exchange rate policy of China. The country has followed a policy of pegging the renminbi or yuan to the US dollar for more than a decade. Between 2000 and 2005, the renminbi was allowed to trade against the dollar within a narrow range of 8.276-8.280 and has not been allowed to appreciate in synchronisation with the gradual accumulation of foreign exchange reserves and a growing trade surplus. The Chinese trade surplus to the world increased significantly. The trade surplus with the US has been even larger. As the US dollar has tended to depreciate in the recent years with respect to the world’s major currencies, a pegged exchange rate has led to depreciation of the Chinese currency. An artificially depreciated exchange rate can provide broad-based protection from imports and can be of special help to exports. With the large and continuing trade surplus of China with the US, there are pressures from the latter on China to appreciate its exchange rate to actual level. China accordingly, relaxed the exchange rate regime in August 2005 when government suspended the policy of gradual appreciation in late 2008 through early 2009, the renewed tie of the renminbi to the dollar resulted in appreciation of real effective exchange rate. However, Chinese authorities removed fixed tie to dollar in mid 2010 and allowed to appreciate gradually.15
During the last few years, India’s competitiveness has suffered from a sharp appreciation of Indian rupee vis-à-vis the dollar. So far China has been resisting a major appreciation of the renminbi or the floating of the currency. However, if China does revalue the renminbi in relation to the US$ in a major way or agrees to float the currency leading to significant appreciation of the same, it should result in a relative strengthening of competitiveness of India’s goodsvis-à-vis China. The expectation is that China will allow the renminbi to appreciate in a very gradual manner rather than revaluing it suddenly.
Fourth, there are concerns relating to a weak financial sector in China which is reeling under the heavy burden of non-performing assets (NPA) estimated to be upto 50 per cent. The government keeps bailing out the banks and financial sector (Wang, 2007; Lu, Feng and Yao, 2009). NPAs have accumulated over the years in the form of subsidised credits extended generously to the state-owned enterprises (SOEs) that form the backbone of the economy. The SOEs are also not required to pay dividend to the government. It is because of such policies and due to other forms of subsidisation of labour costs of enterprises by local governments and municipalities that many countries are not willing to offer a market economy status to China. China, as the target of the largest number of anti-dumping cases, seeks market economy status in bilateral negotiations with different countries and is slowly moving towards financial sector reforms and prudential regulation of capital markets due to growing international pressure. The grant of market economy status to China by India could be considered once the transparent and prudential norms for capital markets have been established and financial sector reforms have been completed.
15
Finally, an interesting development is the increasing outward orientation of Chinese investment especially in resource-rich areas like Africa. The increasing outward orientation is the result of huge reserves accumulated over the years from its trade surpluses since the mid-1990s. This trend is set to rise further in the coming years as China’s mega investment plans in Africa materialise. Further, China is pursuing its ‘going global’ strategy effectively as can be seen from the formalising of regulations to help investors to invest abroad. In 2006, the State Administration of Foreign Exchange abolished quotas on the purchase of foreign exchange for overseas investment. However, most of these investments abroad are ‘resource-seeking’ in orientation. Some Chinese companies are now actively considering plans to set up an integrated steel plant in India. In 2007, China decided to set up an agency to manage more aggressively a considerable portion of its foreign exchange reserves for offshore investments following the Singapore model.
3. Developments in Chinese Trade Policy: Its relevance for India
3.1 Economic Environment
The macro-economic reforms undertaken by China, including its trade reforms, industrial policy changes, investment liberalisation, and other macroeconomic restructuring have contributed to a positive overall performance of its economy. Some of these initiatives are discussed in this section.
3.1.1 WTO Accession and Trade Policy Changes
After 15 years of negotiations for entry into the WTO, China’s accession to the same in 2001 was a major development in its trade policy16. Many analysts in China and abroad believe that the terms of agreement were quite tough on China in many areas17, such as the financial sector where China agreed to liberalise more than what it obtained from some developed countries. China’s post-WTO accession tariff rates are ‘bound’, meaning that China cannot raise them above the bound rates without ‘compensating’ WTO trading partners. All these reduced drastically China’s ‘policy space’ for active development policy. Despite these concessions, China was not given the status of a market economy until 2016, which means that until that date importing countries would bring in anti-dumping actions without having to prove that the export prices were lower than the domestic market prices in exporting countries. Instead costs in a third country can be used to measure the so-called ‘normal value’ for anti-dumping action. The process is thus open to somewhat arbitrary action and it is no wonder that China has become the target of the largest number of anti-dumping cases for several years in a row. Obtaining market economy status features prominently in China’s bilateral trade agreements. A perception of an unfair agreement under WTO accession prevails in many trade policy quarters in China.
China has also reluctantly accepted some discriminatory provisions in its accession protocol which can be used to limit access of its exports to overseas markets. The first is the transitional product-specific safeguard mechanism which targets Chinese products. It can be invoked if there is market disruption or the threat of market disruption caused by Chinese imports, instead of a more stringent injury test under the WTO Agreement on Safeguards. This safeguard mechanism will last for 12 years after China’s accession to the WTO. The second is the special safeguard mechanism that was applicable to China’s textile and clothing exports until the end of 2008. It provides for a 6.0-7.5 per cent annual increase in the growth of Chinese exports and it can be invoked immediately upon request by the importing country for consultation with China. An implication of the latter is that China has been restrained from taking full advantage of the MFA phase-out under the Agreement on Textiles and Clothing until the end of 2008.
16
In the pre-accession period, the Chinese economy was passing through a phase of rapid economic transition. For details, see Cook, Yao and Zhuang (2000); Demurger (2000) and Nolan (2001).
17
It is also worth noting that trade liberalisation came after nearly two decades of rapid growth and productivity increase in the manufacturing sector. According to studies conducted by the World Bank and others by the mid-1990s, there was a lot of ‘water’ in the tariffs in China: for many of the products, the domestic price was lower than the international price. The principle of ‘infant industry’ protection was fully used by China and serious liberalisation started only after most of the protected industries had healthy growth. The Chinese policies on trade and investment remain in practice mindful of the needs of industrial capacity development in key sectors.
There are several WTO panels investigating China’s violations of WTO agreements. From 1 January 1995 to 31 December 2008, 677 anti-dumping cases have been initiated against China and in 479 cases, measures were taken against. In the year 2008 alone, 73 anti-dumping cases were initiated against China but measures were taken in 52 of these cases. India18 has initiated 120 anti-dumping against China and taken measures in 90 of these cases during the period 1995-2008. More than 23 per cent of the total cases in which India has taken anti-dumping measures are against China. It may be noted that India has so far taken up the maximum number of anti-dumping measures and anti-dumping initiatives against China as compared to other WTO members.
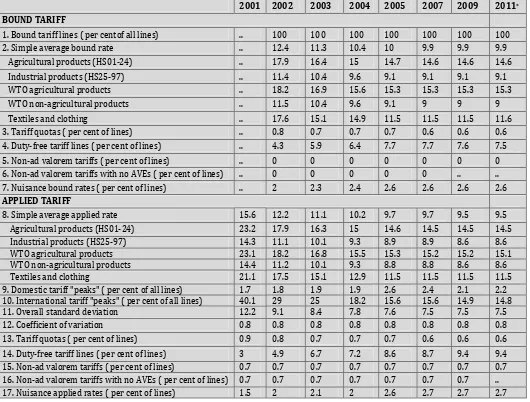
The tariff liberalisation initiated in China during the last few years is summarised in Table 3.1. The average bound rate was unchanged during 2007-11. In 2011,the average bound ratewas 9.9 per cent, 14.6 per cent for agriculture and 9.1 per cent for industrial products. China has made significant reductions in tariffs on a range of sectors including motor vehicles and motor vehicle parts, office machinery, large appliances, furniture and chemicals. In one of its more significant tariff initiatives, in 1 January 2005, tariffs on Information Technology Agreement (ITA) products dropped to zero from a pre-WTO accession average of 13.3 per cent. However, China still maintains high duties on some products that compete with sensitive domestic industries.
As a part of its WTO accession commitments, China was to establish large and increasing Tariff Rate Quotas (TRQs) for imports of wheat, corn, rice, cotton, wool, sugar, vegetable oils, and fertiliser with most in-quota duties ranging from 1 to 9 per cent. By 2004, TRQ commitment was largely implemented, although transparency continues to be problematic for some of the commodities subject to TRQs. The number of product lines under TRQs was seen to be declining during the past decade. The number of lines as a proportion of total tariff lines at 8 digit HS declined from 0.9 per cent in 2001 to 0.6 per cent in 2009.
Significant progress has been achieved in standardising the procedures but there are some tendencies to usestandards and regulationsas a means of protecting domestic industry as tariff rates fall. Redundant testing requirements continue to
18
trouble exporters, particularly in cosmetics, new chemicals, pharmaceuticals19, medical equipment, cellular phones and other telecommunication products, consumer electronic products and automobiles. Exporters also cite problems caused by lack of transparency in the certification process, lack of coordination among standard setting bodies, burdensome requirements and the long processing time taken for licenses. WTO (2010) reported that quantitative restrictions were eliminated on 1 January 2005.
Table 3.1: Structure of MFN Tariff in China, 2001-11
(Percent)
2001 2002 2003 2004 2005 2007 2009 2011*
BOUND TARIFF
1. Bound tariff lines ( per centof all lines) .. 100 100 100 100 100 100 100
2. Simple average bound rate .. 12.4 11.3 10.4 10 9.9 9.9 9.9
Agricultural products (HS01-24) .. 17.9 16.4 15 14.7 14.6 14.6 14.6
Industrial products (HS25-97) .. 11.4 10.4 9.6 9.1 9.1 9.1 9.1
WTO agricultural products .. 18.2 16.9 15.6 15.3 15.3 15.3 15.3
WTO non-agricultural products .. 11.5 10.4 9.6 9.1 9 9 9
8. Simple average applied rate 15.6 12.2 11.1 10.2 9.7 9.7 9.5 9.5
Agricultural products (HS01-24) 23.2 17.9 16.3 15 14.6 14.5 14.5 14.5
Industrial products (HS25-97) 14.3 11.1 10.1 9.3 8.9 8.9 8.6 8.6
WTO agricultural products 23.1 18.2 16.8 15.5 15.3 15.2 15.2 15.1
WTO non-agricultural products 14.4 11.2 10.1 9.3 8.8 8.8 8.6 8.6
Textiles and clothing 21.1 17.5 15.1 12.9 11.5 11.5 11.5 11.5
9. Domestic tariff "peaks" ( per cent of all lines) 1.7 1.8 1.9 1.9 2.6 2.4 2.1 2.2 10. International tariff "peaks" ( per cent of all lines) 40.1 29 25 18.2 15.6 15.6 14.9 14.8
11. Overall standard deviation 12.2 9.1 8.4 7.8 7.6 7.5 7.5 7.5
12. Coefficient of variation 0.8 0.8 0.8 0.8 0.8 0.8 0.8 0.8
13. Tariff quotas ( per cent of lines) 0.9 0.8 0.7 0.7 0.7 0.6 0.6 0.6
14. Duty-free tariff lines ( per cent of lines) 3 4.9 6.7 7.2 8.6 8.7 9.4 9.4 15. Non-ad valorem tariffs ( per cent of lines) 0.7 0.7 0.7 0.7 0.7 0.7 0.7 0.7 16. Non-ad valorem tariffs with no AVEs ( per cent of lines) 0.7 0.7 0.7 0.7 0.7 0.7 0.7 .. 17. Nuisance applied rates ( per cent of lines) 1.5 2 2.1 2 2.6 2.7 2.7 2.7
Source:Trade Policy Review, PRC 2007, 2010 and 2012, WTO, Geneva.
Note: * Figures are taken from trade policy review (WTO Secretariat) 2012, pp. 28-29.
China agreed to eliminate all subsidies prohibited under Article 3 of WTO Agreement on Subsidies and Countervailing measures, including all forms of export subsidies on industrials and agricultural goods upon its accession to the WTO in
19
December 2001. However, the lack of transparency makes it difficult to identify and quantify the possible export subsidies provided by the Chinese government. China’s subsidy programmes are a result of internal administrative measures and are not often publicised. Sometimes these take the form of income tax reductions, or exemptions that are de facto contingent on export performance. China’s subsidy programmes can also take a variety of other forms, including mechanisms such as credit allocations, low interest loans, debt forgiveness and reduction of freight charges. Importing countries have expressed concerns about the involvement of local governments in the use of subsidy to promote exporters.
China has made substantial efforts to overhaul the domestic legal regime to ensure the protection of intellectual property rights in accordance with its commitment to the WTO Agreement of Trade- Related Aspects of Intellectual Property Rights (TRIPS Agreement). These efforts have fallen short in some respects, particularly with regard to the criminal liability of copyright piracy and trademark counterfeiting. In other areas, China has done a relatively good job of revising legal regimes. However, China has been less successful in enforcing its laws and regulations in ensuring effective IPR enforcement. According to the United States Trade Representative (USTR), counterfeiting and piracy in China remain at epidemic levels. In 2007, the US complained to WTO about piracy and blocked access to US films, among others.
A registration system was put in place for implementing China’s WTO commitments on liberalisation oftrading rights,both for Chinese enterprises and for Chinese-foreign-joint ventures, wholly foreign-owned enterprises and foreign individuals, including sole proprietorships. Consistent with the terms of China’s WTO Accession Agreement, the importation of some goods, such as petroleum and sugar, is still reserved for state trading enterprises. In addition, for goods still subject to tariff-rate quotas such as grains, cotton, vegetable oils and fertilisers, China reserves a portion of the in-quota imports for state trading enterprises, while it is committed to make the remaining portion available for importation through non-state traders. Among the areas where trading right commitments have not been implemented are importation of books, newspapers and magazines and pharmaceuticals where China still requires foreign pharmaceutical companies to hire Chinese importers to bring their finished products into the country. This has been a major Non-Tariff Barrier (NTB) for Indian pharmaceutical exports.