EQUITY ASSET
VALUATION
WORKBOOK
John D. Stowe, CFA
Thomas R. Robinson, CFA
Jerald E. Pinto, CFA
Dennis W. McLeavey, CFA
administered the renowned Chartered Financial Analyst® Program. With a rich history of leading the investment profession, CFA Institute has set the highest standards in ethics, education, and professional excellence within the global investment community, and is the foremost authority on investment profession conduct and practice.
EQUITY ASSET
VALUATION
WORKBOOK
John D. Stowe, CFA
Thomas R. Robinson, CFA
Jerald E. Pinto, CFA
Dennis W. McLeavey, CFA
Published by John Wiley & Sons, Inc., Hoboken, New Jersey. Published simultaneously in Canada.
No part of this publication may be reproduced, stored in a retrieval system, or transmitted in any form or by any means, electronic, mechanical, photocopying, recording, scanning, or otherwise, except as permitted under Section 107 or 108 of the 1976 United States Copyright Act, without either the prior written permission of the Publisher, or authorization through payment of the appropriate per-copy fee to the Copyright Clearance Center, Inc., 222 Rosewood Drive, Danvers, MA 01923, (978) 750-8400, fax (978) 646-8600, or on the web at www.copyright.com. Requests to the Publisher for permission should be addressed to the Permissions Department, John Wiley & Sons, Inc., 111 River Street, Hoboken, NJ 07030, (201) 748-6011, fax (201) 748-6008, or online at http://www.wiley.com/go/permissions.
Limit of Liability/Disclaimer of Warranty: While the publisher and authors have used their best efforts in preparing this book, they make no representations or warranties with respect to the accuracy or completeness of the contents of this book and specifi cally disclaim any implied warranties of merchantability or fi tness for a particular purpose. No warranty may be created or extended by sales representatives or written sales materials. The advice and strategies contained herein may not be suitable for your situation. You should consult with a professional where appropriate. Neither the publisher nor author shall be liable for any loss of profi t or any other commercial damages, including but not limited to special, incidental, consequential, or other damages.
For general information on our other products and services or for technical support, please contact our Customer Care Department within the United States at (800) 762-2974, outside the United States at (317) 572-3993 or fax (317) 572-4002.
Wiley also publishes its books in a variety of electronic formats. Some content that appears in print may not be available in electronic books. For more information about Wiley products, visit our web site at www.wiley.com.
ISBN 978-0-470-28765-1
Printed in the United States of America.
v
CONTENTS
PART I
Learning Outcomes, Summary Overview, and Problems
CHAPTER 1
The Equity Valuation Process 3
Learning Outcomes 3
Summary Overview 4
Problems 5
CHAPTER 2
Discounted Dividend Valuation 9
Learning Outcomes 9
Summary Overview 10
Problems 13
CHAPTER 3
Free Cash Flow Valuation 22
Learning Outcomes 22
Summary Overview 23
Problems 24
CHAPTER 4
Market-Based Valuation: Price Multiples 35
Learning Outcomes 35
Summary Overview 36
Problems 38
CHAPTER 5
Residual Income Valuation 45
Learning Outcomes 45
Summary Overview 46
PART II Solutions
CHAPTER 1
The Equity Valuation Process 55
Solutions 55
CHAPTER 2
Discounted Dividend Valuation 58
Solutions 58
CHAPTER 3
Free Cash Flow Valuation 67
Solutions 67
CHAPTER 4
Market-Based Valuation: Price Multiples 78
Solutions 78
CHAPTER 5
Residual Income Valuation 85
Solutions 85
PART
I
LEARNING OUTCOMES,
SUMMARY OVERVIEW,
3
After completing this chapter, you will be able to do the following:
Defi ne valuation.
Discuss the uses of valuation models.
Discuss the importance of expectations in the use of valuation models. Explain the role of valuation in portfolio management.
Discuss the steps in the valuation process, and the objectives and tasks within each step. Discuss the elements of a competitive analysis for a company.
Contrast top-down and bottom-up approaches to economic forecasting. Contrast quantitative and qualitative factors in valuation.
Discuss the importance of quality of earnings analysis in fi nancial forecasting and identify the sources of information for such analysis.
Describe quality of earnings indicators and risk factors. Defi ne intrinsic value.
Defi ne and calculate alpha.
Explain the relationship between alpha and perceived mispricing.
Discuss the use of valuation models within the context of traditional and modern concepts of market effi ciency.
Contrast the going-concern concept of value to the concept of liquidation value. Defi ne fair value.
Contrast absolute and relative valuation models, and describe examples of each type of model.
Explain the broad criteria for choosing an appropriate approach for valuing a particular company.
Discuss the role of ownership perspective in valuation. Explain the role of analysts in capital markets.
Discuss the contents and format of an effective research report.
SUMMARY OVERVIEW
In this chapter, we have discussed the scope of equity valuation, outlined the valuation pro-cess, introduced valuation concepts and models, discussed the analyst ’ s role and responsibilities in conducting valuation, and described the elements of an effective research report in which analysts communicate their valuation analysis.
Valuation is the estimation of an asset ’ s value based on variables perceived to be related to future investment returns, or based on comparisons with closely similar assets.
Valuation is used for
communication among management, shareholders, and analysts, and appraisal of private businesses.
The three steps in the portfolio management process are planning, execution, and feedback. Valuation is most closely associated with the planning and execution steps.
For active investment managers, plans concerning valuation models and criteria are part of the elaboration of an investment strategy.
Skill in valuation plays a key role in the execution step (in selecting a portfolio, in particular). The valuation process has fi ve steps:
The tasks within “ understanding the business ” include evaluating industry prospects, com-petitive position, and corporate strategies. Because similar economic and technological factors typically affect all companies in an industry, and because companies compete with each other for sales, both industry knowledge and competitive analysis help analysts understand a com-pany ’ s economics and its environment. The analyst can then make more accurate forecasts. Two approaches to economic forecasting are top-down forecasting and bottom-up fore-casting. In top-down forecasting, analysts use macroeconomic forecasts to develop industry forecasts and then make individual company and asset forecasts consistent with the indus-try forecasts. In bottom-up forecasting, individual company forecasts are aggregated to industry forecasts, which in turn may be aggregated to macroeconomic forecasts.
Careful scrutiny and interpretation of fi nancial statements, footnotes to fi nancial state-ments, and other accounting disclosures are essential to a quality of earnings analysis. Quality of earnings analysis concerns the scrutiny of possible earnings management and balance sheet management.
The intrinsic value of an asset is its value given a hypothetically complete understanding of the asset ’ s investment characteristics.
Alpha is an asset ’ s excess risk-adjusted return. Ex ante alpha is expected holding-period return minus required return given risk. Historical alpha is actual holding-period return minus the contemporaneous required return.
Active investing is consistent with rational effi cient markets and the existence of trading costs and assets whose intrinsic value is diffi cult to determine.
The going-concern assumption is the assumption that a company will continue operating for the foreseeable future. A company ’ s concern value is its value under the going-concern assumption and is the general objective of most valuation models. In contrast, liquidation value is the company ’ s value if it were dissolved and its assets sold individually. Fair value is the price at which an asset would change hands if neither buyer nor seller were under compulsion to buy/sell.
Absolute valuation models specify an asset ’ s intrinsic value, supplying a point estimate of value that can be compared with market price. Present value models of common stock (also called discounted cash fl ow models) are the most important type of absolute valuation model. Relative valuation models specify an asset ’ s value relative to the value of another asset. As applied to equity valuation, relative valuation is known as the method of comparables: In applying the method of comparables, analysts compare a stock ’ s price multiple to the price multiple of a similar stock or the average or median price multiple of some group of stocks. Relative equity valuation models do not address intrinsic value without the further assump-tion that the price of the comparison value accurately refl ects its intrinsic value.
The broad criteria for selecting a valuation approach are that the valuation approach be consistent with the characteristics of the company being valued;
appropriate given the availability and quality of the data; and consistent with the analyst ’ s valuation purpose and perspective.
Valuation may be affected by control premiums (premiums for a controlling interest in the company), marketability discounts (discounts refl ecting the lack of a public market for the company ’ s shares), and liquidity discounts (discounts refl ecting the lack of a liquid market for the company ’ s shares).
Investment analysts play a critical role in collecting, organizing, analyzing, and communicat-ing corporate information, as well as in recommendcommunicat-ing appropriate investment actions based on their analysis. In fulfi lling this role, they help clients achieve their investment objectives and contribute to the effi cient functioning of capital markets. Analysts can contribute to the welfare of shareholders through monitoring the actions of management.
In performing valuations, analysts need to hold themselves accountable to both standards of competence and standards of conduct.
An effective research report contains timely information; is written in clear, incisive language; is unbiased, objective, and well researched;
contains analysis, forecasts, valuation, and a recommendation that are internally consistent; presents suffi cient information that the reader can critique the valuation;
states the risk factors for an investment in the company; and discloses any potential confl icts of interests faced by the analyst.
Analysts have an obligation to provide substantive and meaningful content. CFA Institute members have an additional overriding responsibility to adhere to the CFA Institute Code of Ethics and relevant specifi c Standards of Professional Conduct.
PROBLEMS
1. A. State four uses or purposes of valuation models.
2. In Example 1-1 based on Cornell ’ s (2001) study of Intel Corporation, in which Cornell valued Intel using a present value model of stock value, we wrote:
“ What future revenue growth rates were consistent with Intel ’ s stock price of $ 61.50 just prior to the release, and $ 43.31 only fi ve days later? Using a conservatively low discount rate, Cornell estimated that the price of $ 61.50 was consistent with a growth rate of 20 percent a year for the subsequent 10 years (and then 6 percent per year thereafter). ” A. If Cornell had assumed a higher discount rate, would the resulting revenue growth rate
estimate consistent with a price of $ 61.50 be higher or lower than 20 percent a year? B. Explain your answer to Part A.
3. A. Explain the role of valuation in the planning step of the portfolio management process.
B. Explain the role of valuation in the execution step of the portfolio management process.
4. Explain why valuation models are important to active investors but not to investors trying to replicate a stock market index.
5. An analyst has been following Kerr-McGee Corporation (NYSE: KMG) for several years. He has consistently felt that the stock is undervalued and has always recommended a strong buy. Another analyst who has been following Nucor Corporation (NYSE: NUE) has been similarly bullish. The tables below summarize the prices, dividends, total returns, and estimates of the contemporaneous required returns for KMG and NUE from 1998 to 2001.
Data for KMG
Year
Price at
Year-End Dividends
Total Annual Return
Contemporaneous Required Return
1997 $ 54.22
1998 33.97 $ 1.80 ⫺ 34.0% 26.6%
1999 54.38 1.80 65.4 19.6
2000 63.96 1.80 20.9 ⫺ 8.5
2001 53.93 1.80 ⫺ 12.9 ⫺ 11.0
Data for NUE
Year
Price at
Year-End Dividends
Total Annual Return
Contemporaneous Required Return
1997 $ 45.66
1998 41.31 $ 0.48 ⫺ 8.5% 29.2%
1999 52.93 0.52 29.4 21.5
2000 38.96 0.60 ⫺ 25.3 ⫺ 9.3
The total return is the price appreciation and dividends for the year divided by the price at the end of the previous year. The contemporaneous required return is the average actual return for the year realized by stocks that were of the same risk as KMG or NUE, respectively.
A. Without reference to any numerical data, what can be said about each analyst ’ s ex ante alpha for KMG and NUE, respectively?
B. Calculate the ex post alphas for each year 1998 through 2001 for KMG and for NUE.
6. On the last trading day of 2000 (29 December 2000), an analyst is reviewing his valuation of Wal-Mart Stores (NYSE: WMT). The analyst has the following information and assumptions:
The current price is $ 53.12.
The analyst ’ s estimate of WMT ’ s intrinsic value is $ 56.00.
In addition to the full correction of the difference between WMT ’ s current price and its intrinsic value, the analyst forecasts additional price appreciation of $ 4.87 and a cash dividend of $ 0.28 over the next year.
The required rate of return for Wal-Mart is 9.2 percent.
A. What is the analyst ’ s expected holding-period return on WMT? B. What is WMT ’ s ex ante alpha?
C. Calculate ex post alpha, given the following additional information:
Over the next year, 29 December 2000 through 31 December 2001, Wal-Mart ’ s actual rate of return was 8.9 percent.
In 2001, the realized rate of return for stocks of similar risk was ⫺ 10.4 percent.
7. The table below gives information on the expected and required rates of return based on
the CAPM for three securities an analyst is valuing: Analyst, related in part to securities and in part to people. ”
A. Explain the analyst ’ s function related to people.
B. How does the analyst ’ s work contribute to the functioning of capital markets?
9. In a research note on the ordinary shares of the Mariella Burani Fashion Group (Milan Stock Exchange: MBFG.MI) dated early July 2001 when a recent price was € 7.73 and projected annual dividends were € 0.05, an analyst stated a target price of € 9.20. The research note did not discuss how the target price was obtained or •
The total return is the price appreciation and dividends for the year divided by the price at the end of the previous year. The contemporaneous required return is the average actual return for the year realized by stocks that were of the same risk as KMG or NUE, respectively.
A. Without reference to any numerical data, what can be said about each analyst ’ s ex ante alpha for KMG and NUE, respectively?
B. Calculate the ex post alphas for each year 1998 through 2001 for KMG and for NUE.
6. On the last trading day of 2000 (29 December 2000), an analyst is reviewing his valuation of Wal-Mart Stores (NYSE: WMT). The analyst has the following information and assumptions:
The current price is $ 53.12.
The analyst ’ s estimate of WMT ’ s intrinsic value is $ 56.00.
In addition to the full correction of the difference between WMT ’ s current price and its intrinsic value, the analyst forecasts additional price appreciation of $ 4.87 and a cash dividend of $ 0.28 over the next year.
The required rate of return for Wal-Mart is 9.2 percent.
A. What is the analyst ’ s expected holding-period return on WMT? B. What is WMT ’ s ex ante alpha?
C. Calculate ex post alpha, given the following additional information:
Over the next year, 29 December 2000 through 31 December 2001, Wal-Mart ’ s actual rate of return was 8.9 percent.
In 2001, the realized rate of return for stocks of similar risk was ⫺ 10.4 percent.
7. The table below gives information on the expected and required rates of return based on
the CAPM for three securities an analyst is valuing: Analyst, related in part to securities and in part to people. ”
A. Explain the analyst ’ s function related to people.
B. How does the analyst ’ s work contribute to the functioning of capital markets?
how it should be interpreted. Assume the target price represents the expected price of MBFG.MI. What further specifi c pieces of information would you need to form an opinion on whether MBFG.MI was fairly valued, overvalued, or undervalued?
10. You are researching XMI Corporation (XMI). XMI has shown steady earnings per share growth (18 percent a year during the last seven years) and trades at a very high multiple to earnings (its P/E ratio is currently 40 percent above the average P/E ratio for a group of the most comparable stocks). XMI has generally grown through acquisition, by using XMI stock to purchase other companies. These companies usually trade at lower P/E ratios than XMI.
In investigating the fi nancial disclosures of these acquired companies and in talking to industry contacts, you conclude that XMI has been forcing the companies it acquires to accelerate the payment of expenses before the acquisition deals are closed. Such accel-eration drives down the acquired companies ’ last reported cash fl ow and earnings per share numbers. As one example, XMI asks acquired companies to immediately pay all pending accounts payable, whether or not they are due. Subsequent to the acquisition, XMI reinstitutes normal expense payment patterns. After it acquires a company, XMI appears to have a pattern of speeding up revenue recognition as well. For example, one overseas telecommunications subsidiary changed its accounting to recognize up front the expected revenue from sales of network capacity that spanned decades. The above policies and accounting facts do not appear to have been adequately disclosed in XMI ’ s shareholder communications.
A. Characterize the effect of the XMI expensing policies with respect to acquisitions on XMI ’ s post-acquisition earnings per share growth rate.
B. Characterize the quality of XMI earnings based on its expensing and revenue-recognition policies with respect to acquisitions.
C. In discussing the current price of XMI, the question states that XMI ’ s “ P/E ratio is currently 40 percent above the average P/E ratio for a group of the most comparable stocks. ” Characterize the type of valuation model implicit in such a statement. D. State two risk factors in investing in XMI, in the sense in which that term was used in
9
After completing this chapter, you will be able to do the following:
Explain the economic rationale for discounted cash fl ow (DCF) valuation.
Give three defi nitions of expected cash fl ow that can be used in discounted cash fl ow valua-tion, discuss the advantages and disadvantages of each, and identify the investment situations in which each is suitable.
Determine whether a dividend discount model (DDM) is appropriate for valuing a stock. Explain the components of the required rate of return on equity used to discount expected future cash fl ows.
Discuss the capital asset pricing model (CAPM), arbitrage pricing theory (APT), and bond yield plus risk premium approaches to determining the required rate of return for an equity investment.
Calculate the required rate of return for an equity investment using each major approach. Calculate the Gordon growth model (GGM) equity risk premium estimate.
State three limitations to the CAPM and APT approaches to determining the required return on equity.
Describe and give an example of the build-up approach to determining the required return on equity.
Calculate the expected holding-period return on a stock given its current price, expected next-period price, and expected next-period dividend.
Contrast the expected holding-period return with the required rate of return.
Discuss the effect on expected return of the convergence of price to value, given that price does not equal value.
Calculate the value of a common stock using the DDM for one-, two-, and multiple-period holding multiple-periods.
State the equation and explain the general form of the DDM.
Discuss the two major approaches to the dividend-forecasting problem. Explain the assumptions of the Gordon growth model.
Calculate the value of a common stock using the Gordon growth model.
Calculate the expected rate of return or implied dividend growth rate in the Gordon growth model, given the market price.
Explain and calculate the justifi ed leading and trailing price to earnings ratios (P/Es) based on fundamentals, using the Gordon growth model.
Calculate the value of fi xed-rate perpetual preferred stock given the stock ’ s annual dividend and the discount rate.
Explain and calculate the present value of growth opportunities (PVGO) given current earnings per share, the required rate of return, and the market price of the stock (or value of the stock).
Explain the strengths and limitations of the Gordon growth model.
Justify the selection of the Gordon growth model to value a company, given the character-istics of the company being valued.
Explain the assumptions and justify the selection of the two-stage DDM, the H-model, the three-stage DDM, and spreadsheet modeling.
Explain the concepts of the growth phase, transitional phase, and maturity phase of a business. Explain the concept of terminal value and discuss alternative approaches to determining the terminal value in a discounted dividend model.
Calculate the value of common stock using the two-stage DDM, the H-model, and the three-stage DDM.
Justify the selection of a particular multistage dividend discount model given the character-istics of the company being valued.
Explain how to estimate the implied expected rate of return for any DDM, including the two-stage DDM, the H-model, the three-stage DDM, and the spreadsheet model.
Calculate the implied expected rate of return for the H-model and a general two-stage model. Explain the strengths and limitations of the two-stage DDM, the H-model, the three-stage DDM, and the spreadsheet model.
Defi ne the concept of sustainable growth rate and explain the underlying assumptions. Calculate the sustainable growth rate for a company.
Explain how the DuPont model can be used to forecast the return on equity for use in esti-mating the sustainable growth rate.
Discuss how dividend discount models are used as a discipline for portfolio selection, and explain two risk control methodologies.
SUMMARY OVERVIEW
This chapter provided an overview of DCF models of valuation, discussed the estimation of a stock ’ s required rate of return, and presented in detail the dividend discount model.
In DCF models, the value of any asset is the present value of its (expected) future cash fl ows
suitable for dividend-paying stocks, where the company has a discernible dividend policy that has an understandable relationship to the company ’ s profi tability, and the investor has a non-control (minority ownership) perspective.
The free cash fl ow approach (FCFF or FCFE) might be appropriate when the company does not pay dividends, dividends differ substantially from FCFE, free cash fl ows align with profi tability, or the investor takes a control (majority ownership) perspective.
The residual income approach can be useful when the company does not pay dividends (as an alternative to an FCF approach), or free cash fl ow is negative.
The required rate of return is the minimum rate of return that an investor would antici-pate receiving in order to invest in an asset. The two major approaches to determining the cost of equity are an equilibrium method (CAPM or APT) and the bond yield plus risk premium method.
The equity risk premium for use in the CAPM approach can be based on historical return data or based explicitly on expectational data.
The DDM with a single holding period gives stock value as
V0 ⫽
Expected holding-period returns differ from required rates of return when price does not exactly refl ect value. When price does not equal value, there will generally be an additional component to the expected holding-period return refl ecting the convergence of price to value.
The expression for the DDM for any given fi nite holding period n and the general expres-sion for the DDM are, respectively,
There are two main approaches to the problem of forecasting dividends: First, we can assign the entire stream of expected future dividends to one of several stylized growth pat-terns. Second, we can forecast a fi nite number of dividends individually up to a terminal point, valuing the remaining dividends by assigning them to a stylized growth pattern, or forecasting share price as of the terminal point of our dividend forecasts. The fi rst forecast-ing approach leads to the Gordon growth model and multistage dividend discount models; the second forecasting approach lends itself to spreadsheet modeling.
The Gordon growth model assumes that dividends grow at a constant rate g forever, so that
Assuming that price equals value, the Gordon growth model estimate of a stock ’ s expected
Given an estimate of the next-period dividend and the stock ’ s required rate of return, we can use the Gordon growth model to estimate the dividend growth rate implied by the current market price (making a constant growth rate assumption).
The present value of growth opportunities (PVGO) is the part of a stock ’ s total value, V 0 , that comes from profi table future growth opportunities in contrast to the value associated with assets already in place. The relationship is V 0 ⫽ E兾r ⫹ PVGO, where E兾r is defi ned
The above expressions give a stock ’ s justifi ed price – earnings ratio based on forecasts of fundamentals (given that the Gordon growth model is appropriate).
The Gordon growth model may be useful for valuing broad-based equity indexes and the stock of businesses with earnings that we expect to grow at a stable rate comparable to or lower than the nominal growth rate of the economy.
Gordon growth model values are very sensitive to the assumed growth rate and required rate of return.
For many companies, growth falls into phases. In the growth phase, a company enjoys an abnormally high growth rate in earnings per share, called supernormal growth. In the tran-sition phase, earnings growth slows. In the mature phase, the company reaches an equilib-rium in which factors such as earnings growth and the return on equity stabilize at levels that can be sustained long term. Analysts often apply multistage DCF models to value the stock of a fi rm with multistage growth prospects.
The two-stage dividend discount model assumes different growth rates in Stage 1 and Stage 2
other method, such as applying a P/E multiplier to forecasted EPS as of the terminal date. The H-model assumes that the dividend growth rate declines linearly from a high super-normal rate to the super-normal growth rate during Stage 1, and then grows at a constant super-normal growth rate thereafter:
There are two basic three-stage models. In one version, the growth rate is constant in each of the three stages. In the second version, the growth rate is constant in Stage 1, declines linearly in Stage 2, and becomes constant and normal in Stage 3.
Spreadsheet models are very fl exible, providing the analyst with the ability to value any pattern of expected dividends.
In addition to valuing equities, DDMs are used to fi nd expected rates of return. For sim-pler models (like the one-period model, the Gordon growth model, and the H-model), well-known formulas may be used to calculate these rates of return. For many dividend streams, however, the rate of return must be found by trial and error, producing a discount rate that equates the present value of the forecasted dividend stream to the current market price. Adjustments to the expected return estimates may be needed to refl ect the conver-gence of price to value.
Multistage DDM models can accommodate a wide variety of patterns of expected divi-dends. Even though such models may use stylized assumptions about growth, they can provide useful approximations.
Values from multistage DDMs are generally sensitive to assumptions. The usefulness of such values refl ects the quality of the inputs.
Dividend growth rates can be obtained from analyst forecasts, from statistical forecasting models, or from company fundamentals. The sustainable growth rate depends on the ROE and the earnings retention rate, b : g ⫽ b ⫻ ROE. This expression can be expanded further, using the DuPont formula, as
g ⫽ Net income ____________________Net income ⫺ Dividends ⫻ Net income __________Sales
⫻ Sales _____Assets ⫻ ________________ Shareholders ’ equity Assets
Dividend discount models can be used as a discipline for portfolio construction. Potential investments can be screened or selected based on their estimated rates of return, along with other portfolio requirements. Often, the discipline involves three steps: sorting stocks into groups according to a risk-control methodology, ranking stocks by expected return within each group, and selecting a portfolio from the highest expected return stocks consistent with the risk-control methodology.
PROBLEMS
1. The estimated betas for AOL Time Warner (NYSE: AOL), J.P. Morgan Chase & Company (NYSE: JPM), and The Boeing Company (NYSE: BA) are 2.50, 1.50, and 0.80, respectively. The risk-free rate of return is 4.35 percent, and the market risk premium is 8.04 percent. Calculate the required rates of return for these three stocks using the CAPM.
2. The estimated factor sensitivities of Terra Energy to the fi ve macroeconomic factors in the Burmeister, Roll, and Ross (1994) article are given in the table below. The table also gives the market risk premiums to each of these same factors.
Factor Sensitivity Risk Premium (%)
Confi dence risk 0.25 2.59
Time horizon risk 0.30 ⫺ 0.66
Infl ation risk ⫺ 0.45 ⫺ 4.32
Business-cycle risk 1.60 1.49
Market-timing risk 0.80 3.61
•
•
•
•
•
Use the 5-factor BIRR APT model to calculate the required rate of return for Terra Energy using these estimates. The Treasury bill rate is 4.1 percent.
3. Newmont Mining (NYSE: NEM) has an estimated beta of ⫺ 0.2. The risk-free rate of return is 4.5 percent, and the equity risk premium is estimated to be 7.5 percent. Using the CAPM, calculate the required rate of return for investors in NEM.
4. The expression for the value of a stock given a single-period investment horizon has four variables: V 0 , D 1 , P 1 , and r . Solve for the value of the missing variable for each of the four stocks in the table below.
Stock
Estimated Value ( V 0 )
Expected Dividend ( D 1 )
Expected Price ( P 1 )
Required Rate of Return ( r )
1 $ 0.30 $ 21.00 10.0%
2 $ 30.00 32.00 10.0
3 92.00 2.70 12.0
4 16.00 0.30 17.90
5. General Motors (NYSE: GM) sells for $ 66.00 per share. The expected dividend for next year is $ 2.40. Use the single-period DDM to predict GM ’ s stock price one year from today. The risk-free rate of return is 5.3 percent, the market risk premium is 6.0 percent, and GM ’ s beta is 0.90.
6. BP PLC (NYSE: BP) has a current stock price of $ 50 and current dividend of $ 1.50. The dividend is expected to grow at 5 percent annually. BP ’ s beta is 0.85. The risk-free interest rate is 4.5 percent, and the market risk premium is 6.0 percent.
A. What is next year ’ s projected dividend?
B. What is BP ’ s required rate of return based on the CAPM? C. Using the Gordon growth model, what is the value of BP?
D. Assuming the Gordon growth model is valid, what dividend growth rate would result in a model value of BP equal to its market price?
7. The current market prices of three stocks are given below. The current dividends, dividend growth rates, and required rates of return are also given. The dividend growth rates are perpetual.
Stock Current Price
Current Dividend ( t ⫽ 0)
Dividend Growth Rate
Required Rate of Return
Que Corp. $ 25.00 $ 0.50 7.0% 10.0%
SHS Company $ 40.00 $ 1.20 6.5 10.5
True Corp. $ 20.00 $ 0.88 5.0 10.0
A. Find the value of each stock with the Gordon growth model.
8. For fi ve utility stocks, the table below provides the expected dividend for next year, the current market price, the expected dividend growth rate, and the beta. The risk-free rate is currently 5.3 percent, and the market risk premium is 6.0 percent.
Stock
Dividend ( D 1 )
Price ( P 0 )
Dividend Growth
Rate ( g ) Beta (  )
American Electric (NYSE: AEP) 2.40 46.17 5.0% 0.60
Consolidated Edison (NYSE: ED) 2.20 39.80 5.0 0.60
Exelon Corp. (NYSE: EXC) 1.69 64.12 7.0 0.80
Southern Co. (NYSE: SO) 1.34 23.25 5.5 0.65
Dominion Resources (NYSE: D) 2.58 60.13 5.5 0.65
A. Calculate the expected rate of return for each stock using the Gordon growth model. B. Calculate the required rate of return for each stock using the CAPM.
9. Vicente Garcia is a buy-side analyst for a large pension fund. He frequently uses dividend discount models such as the Gordon growth model for the consumer noncyclical stocks that he covers. The current dividend for Procter & Gamble Co. (NYSE: PG) is $ 1.46, and the dividend eight years ago was $ 0.585. The current stock price is $ 80.00.
A. What is the historical dividend growth rate for Procter & Gamble?
B. Garcia assumes that the future dividend growth rate will be exactly half of the his-torical rate. What is Procter & Gamble ’ s expected rate of return using the Gordon growth model?
C. Garcia uses a beta of 0.53 (computed versus the S & P 500 index) for Procter & Gamble. The risk-free rate of return is 5.56 percent, and the equity risk premium is 3.71 percent. If Garcia continues to assume that the future dividend growth rate will be exactly half of the historical rate, what is the value of the stock with the Gordon growth model?
10. NiSource Preferred B (NYSE: NI-B) is a fi xed-rate perpetual preferred stock paying a $ 3.88 annual dividend. If the required rate of return is 7.88 percent, what is the value of one share? If the price of this preferred stock were $ 46.00, what would be the yield?
11. R.A. Nixon put out a “ strong buy ” on DuPoTex (DPT). This company has a current stock price of $ 88.00 per share. The company has sales of $ 210 million, net income of $ 3 million, and 300 million outstanding shares. DPT is not paying a dividend. Dorothy Josephson has argued with Nixon that DPT ’ s valuation is excessive relative to its sales, profi ts, and any reasonable assumptions about future possible dividends. Josephson also asserts that DPT has a market value equal to that of many large blue-chip companies, which it does not deserve. Nixon feels that Josephson ’ s concerns refl ect an archaic attitude about equity valuation and a lack of understanding about DPT ’ s industry.
A. What is the total market value of DPT ’ s outstanding shares? What are the price-to-earnings and price-to-sales ratios?
C. Nixon and Josephson explore another scenario for future earnings and dividends for DPT. They assume that sales will grow at 7 percent in Year 5 and thereafter. Earnings will be 10 percent of sales, and dividends will be 40 percent of earnings. Dividends will be initiated in Year 5, and dividends should be discounted at 12 percent. What level of sales is required in Year 4 to achieve a discounted dividend valuation equal to the current stock price?
12. Dole Food (NYSE: DOL) has a current dividend of $ 0.40, which is expected to grow at 7 percent forever. Felipe Rodriguez has estimated the required rate of return for Dole using three methods. The methods and the estimates are as follows:
Bond yield plus risk premium method r ⫽ 9.6% CAPM method r ⫽ 11.2% APT method r ⫽ 10.4%
Using the assumed dividend pattern, what is the value of Dole Food using each of the three estimated required rates of return?
13. The CFO of B-to-C Inc., a retailer of miscellaneous consumer products, recently announced the objective of paying its fi rst (annual) cash dividend of $ 0.50 in four years. Thereafter, the dividend is expected to increase by 7 percent per year for the foreseeable future. The company ’ s required rate of return is 15 percent.
A. Assuming that you have confi dence in the CFO ’ s dividend target, what is the value of the stock of B-to-C today?
B. Suppose that you think that the CFO ’ s outlook is too optimistic. Instead, you believe that the fi rst dividend of $ 0.50 will not be received until six years from now. What is the value of the stock?
14. FPR is expected to pay a $ 0.60 dividend next year. The dividend is expected to grow at a 50 percent annual rate for Years 2 and 3, at 20 percent annually for Years 4 and 5, and at 5 percent annually for Year 6 and thereafter. If the required rate of return is 12 percent, what is the value per share?
15. EB Systems is selling for $ 11.40 and is expected to pay a $ 0.40 dividend next year. The dividend is expected to grow at 15 percent for the following four years, and then at 7 percent annually after Year 5. If purchased at its current price, what is the expected rate of return on EB Systems? Assume price equals value.
16. Hanson PLC (LSE: HNS) is selling for GBP 472. Hansen has a beta of 0.83 against the FTSE 100 index, and the current dividend is GBP 13.80. The risk-free rate of return is 4.66 percent, and the equity risk premium is 4.92 percent. An analyst covering this stock expects the Hanson dividend to grow initially at 14 percent but to decline linearly to 5 percent over a 10-year period. After that, the analyst expects the dividend to grow at 5 percent.
A. Compute the value of the Hanson dividend stream using the H-model. According to the H-model valuation, is Hanson overpriced or underpriced?
B. Assume that Hanson ’ s dividends follow the H-model pattern the analyst predicts. If an investor pays the current GBP 472 price for the stock, what will be the rate of return?
Chemical Corp. (LCC) and Aminochem Company (AOC). AOC and LCC have June 30 fi scal year ends. You have compiled the data in Table 2-1 for this purpose. Use a one-year time horizon and assume the following:
Real gross domestic product is expected to rise 5 percent; S & P 500 expected total return of 20 percent;
U.S. Treasury bills yield 5 percent; and 30-year U.S. Treasury bonds yield 8 percent. •
• • •
TABLE 2-1 Selected Data for Litchfi eld and Aminochem
Litchfi eld
Chemical (LCC)
Aminochem (AOC)
Current stock price $ 50 $ 30
Shares outstanding (millions) 10 20
Projected earnings per share (FY 1996) $ 4.00 $ 3.20
Projected dividend per share (FY 1996) $ 0.90 $ 1.60
Projected dividend growth rate 8% 7%
Stock beta 1.2 1.4
Investors ’ required rate of return 10% 11%
Balance sheet data (millions)
Long-term debt $ 100 $ 130
Stockholders ’ equity $ 300 $ 320
A. Calculate the value of the common stock of LCC and AOC using the constant-growth DDM. Show your work.
B. Calculate the expected return over the next year of the common stock of LCC and AOC using the CAPM. Show your work.
C. Calculate the internal (implied, normalized, or sustainable) growth rate of LCC and AOC. Show your work.
D. Recommend LCC or AOC for investment. Justify your choice using your answers to A, B, and C and the information in Table 2-1 .
18. (Adapted from 1999 CFA Level II exam) Scott Kelly is reviewing MasterToy ’ s fi nancial statements in order to estimate its sustainable growth rate. Using the information presented in Table 2-2 ,
A. i. Identify the three components of the DuPont formula.
ii. Calculate the ROE for 1999 using the three components of the DuPont formula. iii. Calculate the sustainable growth rate for 1999.
Kelly has calculated actual and sustainable growth for each of the past four years and fi nds in each year that its calculated sustainable growth rate substantially exceeds its actual growth rate.
19. (Adapted from 2000 CFA Level II exam) The management of Telluride, an international diversifi ed conglomerate based in the United States, believes that the recent strong performance of its wholly owned medical supply subsidiary, Sundanci, has gone unnoticed. In order to realize Sundanci ’ s full value, Telluride has announced that it will divest Sundanci in a tax-free spin-off.
Sue Carroll, CFA, is Director of Research at Kesson and Associates. In developing an investment recommendation for Sundanci, Carroll has directed four of her analysts to determine a valuation of Sundanci using various valuation disciplines. To assist her analysts, Carroll has gathered the information shown in Tables 2-3 and 2-4 .
Prior to determining Sundanci ’ s valuation, Carroll analyzes Sundanci ’ s return on equity (ROE) and sustainable growth.
TABLE 2-2 MasterToy Inc. Actual 1998 and Estimated 1999 Financial Statements for FY Ending December 31 ( $ millions, except per-share data)
1998 1999e Change (%)
Income Statement
Revenue $ 4,750 $ 5,140 8.2
Cost of goods sold $ 2,400 $ 2,540
Selling, general, and administrative 1,400 1,550
Depreciation 180 210
Goodwill amortization 10 10
Operating income $ 760 $ 830 9.2
Interest expense 20 25
Income before taxes $ 740 $ 805
Income taxes 265 295
Net income $ 475 $ 510
Earnings per share $ 1.79 $ 1.96 9.5
Average shares outstanding (millions) 265 260
Balance Sheet
Cash $ 400 $ 400
Accounts receivable 680 700
Inventories 570 600
Net property, plant, and equipment 800 870
Intangibles 500 530
Total assets $ 2,950 $ 3,100
Current liabilities $ 550 $ 600
Long-term debt 300 300
Total liabilities $ 850 $ 900
Stockholders ’ equity 2,100 2,200
Total liabilities and equity $ 2,950 $ 3,100
Book value per share $ 7.92 $ 8.46
A. i. Calculate the three components of ROE in the DuPont formula for the year 2000.
ii. Calculate ROE for the year 2000.
iii. Calculate the sustainable rate of growth. Show your work.
Carroll learns that Sundanci ’ s Board of Directors is considering the following policy changes that will affect Sundanci ’ s sustainable growth rate:
Director A proposes an increase in the quarterly dividend by $ 0.15 per share.
Director B proposes a bond issue of $ 25 million, the proceeds of which will be used to increase production capacity.
Director C proposes a 2-for-1 stock split. •
•
•
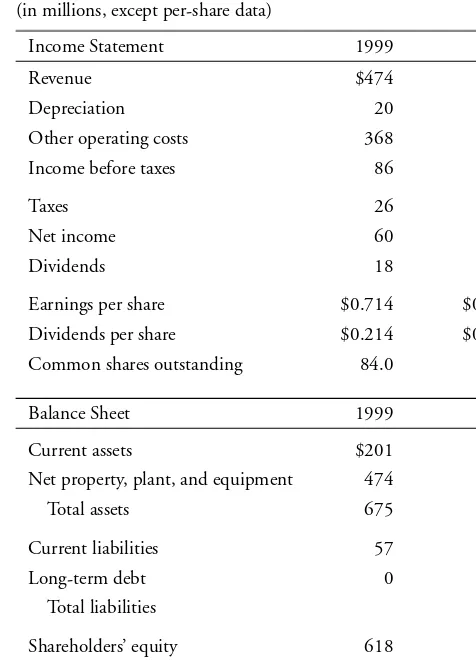
TABLE 2-3 Sundanci Actual 1999 and 2000 Financial Statements for FY Ending May 31 ( $ millions, except per-share data)
Income Statement 1999 2000
Revenue $ 474 $ 598
Depreciation 20 23
Other operating costs 368 460
Income before taxes 86 115
Taxes 26 35
Net income 60 80
Dividends 18 24
Earnings per share $ 0.714 $ 0.952
Dividends per share $ 0.214 $ 0.286
Common shares outstanding 84.0 84.0
Balance Sheet 1999 2000
Current assets $ 201 $ 326
Net property, plant, and equipment 474 489
Total assets 675 815
Current liabilities 57 141
Long-term debt 0 0
Total liabilities 57 141
Shareholders ’ equity 618 674
Total liabilities and equity 675 815
Capital expenditures 34 38
TABLE 2-4 Selected Financial Information
Required rate of return on equity 14%
Growth rate of industry 13%
B. Indicate the effect of each of these proposals on Sundanci ’ s sustainable rate of growth, given that the other factors remain unchanged. Identify which components of the sustainable growth model, if any, are directly affected by each proposal.
Helen Morgan, CFA, has been asked by Carroll to determine the potential valuation for Sundanci using the DDM. Morgan anticipates that Sundanci ’ s earnings and dividends will grow at 32 percent for two years and 13 percent thereafter.
C. Calculate the current value of a share of Sundanci stock using a two-stage dividend discount model and the data from Tables 2-3 and 2-4 . Show your work.
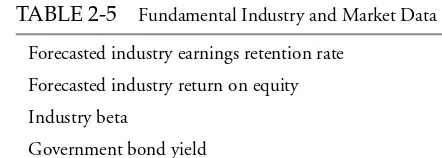
20. (Adapted from 2001 CFA Level II exam) Peninsular Research is initiating coverage of a mature manufacturing industry. John Jones, CFA, head of the research department, gathers the information given in Table 2-5 to help in his analysis.
TABLE 2-6 Economic and Market Data
Fundamental Factors Country A Country B
Forecasted growth in real
gross domestic product 5% 2%
Government bond yield 10% 6%
Equity risk premium 5% 4%
TABLE 2-5 Fundamental Industry and Market Data
Forecasted industry earnings retention rate 40%
Forecasted industry return on equity 25%
Industry beta 1.2
Government bond yield 6%
Equity risk premium 5%
A. Compute the price-to-earnings (P 0 /E 1 ) ratio for the industry based on the funda-mental data in Table 2-5 . Show your work.
Jones wants to analyze how fundamental P/Es might differ among countries. He gathers the data given in Table 2-6 .
B. Determine whether each of the fundamental factors in Table 2-6 would cause P/Es to be generally higher for Country A or higher for Country B. Justify each of your conclusions with one reason. Note: Consider each fundamental factor in isolation, with all else remaining equal.
21. (Adapted from 1998 CFA Level II exam) Janet Ludlow ’ s company requires all its analysts to use a two-stage DDM and the CAPM to value stocks. Using these models, Ludlow has valued QuickBrush Company at $ 63 per share. She now must value SmileWhite Corporation.
Ludlow estimates the following EPS and dividend growth rates for SmileWhite:
First three years: 12% per year Years thereafter: 9% per year
The 1997 dividend per share is $ 1.72.
B. Estimate the intrinsic value of SmileWhite using the data above and the two-stage DDM. Show your work.
C. Recommend QuickBrush or SmileWhite stock for purchase by comparing each com-pany ’ s intrinsic value with its current market price. Show your work.
D. Describe one strength of the two-stage DDM in comparison with the constant-growth DDM. Describe one weakness inherent in all DDMs.
TABLE 2-7 Valuation Information: December 1997
QuickBrush SmileWhite
Beta 1.35 1.15
Market price $ 45.00 $ 30.00
Intrinsic value $ 63.00 ?
Notes:
Risk-free rate 4.50%
22
After completing this chapter, you will be able to do the following:
Discuss the choice of a free cash fl ow valuation approach.
Defi ne and interpret free cash fl ow to the fi rm (FCFF) and free cash fl ow to equity (FCFE). Describe the FCFF and FCFE approaches to valuation.
Explain the strengths and limitations of the FCFE model.
Contrast the ownership perspective implicit in the FCFE approach to the ownership per-spective implicit in the dividend discount approach.
Contrast the appropriate discount rates for the FCFE and FCFF models.
Discuss the appropriate adjustments to net income, earnings before interest and taxes (EBIT), earnings before interest, taxes, depreciation, and amortization (EBITDA), and cash fl ow from operations (CFO) to arrive at FCFF and FCFE.
Calculate FCFF and FCFE given a company ’ s fi nancial statements, prepared according to U.S. Generally Accepted Accounting Principles (GAAP) or International Accounting Standards (IAS). Discuss approaches for forecasting FCFF and FCFE.
Contrast the recognition of value in the FCFE model with the recognition of value in divi-dend discount models.
Explain how dividends, share repurchases, share issues, and changes in leverage may affect FCFF and FCFE.
Contrast FCFF with EBITDA.
Critique the use of net income and EBITDA as proxies for cash fl ow in valuation. Describe the stable-growth, two-stage, and three-stage FCFF and FCFE models.
List and discuss the assumptions of the stable-growth, two-stage, and three-stage FCFF and FCFE models.
Justify the selection of a stable-growth, two-stage, or three-stage FCFF or FCFE model given characteristics of the company being valued.
Calculate the value of a company using the stable-growth, two-stage, and three-stage FCFF and FCFE models.
Explain how sensitivity analysis can be used in FCFF and FCFE valuations.
SUMMARY OVERVIEW
Discounted cash fl ow models are used widely by analysts to value companies.
Free cash fl ow to the fi rm (FCFF) and free cash fl ow to equity (FCFE) are the cash fl ows available to all of the investors in the company and to common stockholders, respectively. Analysts like to use free cash fl ow as return (either FCFF or FCFF)
if the company is not dividend paying,
if the company is dividend paying but dividends differ signifi cantly from the company ’ s capacity to pay dividends,
if free cash fl ows align with profi tability within a reasonable forecast period with which the analyst is comfortable, or
if the investor takes a control perspective.
The FCFF valuation approach estimates the value of the fi rm as the present value of future FCFF discounted at the weighted average cost of capital (WACC):
Firm value ⫽
兺
Dividing the total value of equity by the number of outstanding shares gives the value per share. The WACC formula is
WACC ⫽ _____________________MV(Debt) MV(Debt)⫹ MV(Equity) rd (1 ⫺ Tax rate) ⫹ _____________________MV(Debt) MV(Equity)⫹ MV(Equity) r The value of the fi rm if FCFF is growing at a constant rate is
Firm value ⫽ __________WACC ⫺ FCFF 1 g ⫽ ____________ FCFF WACC ⫺ 0 (1 ⫹gg )
With the FCFE valuation approach, the value of equity can be found by discounting FCFE at the required rate of return on equity ( r ):
Equity value ⫽
兺
t ⫽1 ⬁
_______ (1 FCFE ⫹r) tt
Dividing the total value of equity by the number of outstanding shares gives the value per share.
The value of equity if FCFE is growing at a constant rate is
Equity value ⫽ ______ FCFE 1
r ⫺ g ⫽
FCFE 0 (1 ⫹ g) ____________
r ⫺ g
FCFF and FCFE are frequently calculated starting with net income:
FCFF ⫽ NI ⫹ NCC ⫹ Int(1 ⫺ Tax rate) ⫺ FCInv ⫺ WCInv FCFE ⫽ NI ⫹ NCC ⫺ FCInv ⫺ WCInv ⫹ Net borrowing
FCFF and FCFE are related to each other as follows:
FCFF and FCFE can be calculated starting from cash fl ow from operations:
FCFF ⫽ CFO ⫹ Int ( 1 ⫺ Tax rate ) ⫺ FCInv FCFE ⫽ CFO ⫺ FCInv ⫹ Net borrowing
FCFF can also be calculated from EBIT or EBITDA:
FCFF ⫽ EBIT ( 1 ⫺ Tax rate ) ⫹ Dep ⫺ FCInv ⫺ WCInv
FCFF ⫽ EBITDA ( 1 ⫺ Tax rate ) ⫹ Dep ( Tax rate ) ⫺ FCInv ⫺ WCInv
FCFE can then be found by using FCFE ⫽ FCFF ⫺ Int(1 ⫺ Tax rate) ⫹ Net borrowing. Finding CFO, FCFF, and FCFE can require careful interpretation of corporate fi nancial statements. In some cases, the needed information may not be transparent.
Earnings components such as net income, EBIT, EBITDA, and CFO should not be used as cash fl ow measures to value a fi rm. These earnings components either double-count or ignore parts of the cash fl ow stream.
More-complicated capital structures, such as those with preferred stock, are easily adapted to fi nd FCFF or FCFE.
A general expression for the two-stage FCFF valuation model is
Firm value ⫽
兺
A general expression for the two-stage FCFE valuation model isEquity value ⫽
兺
One common two-stage model assumes a constant growth rate in each stage, and a second common model assumes declining growth in Stage 1 followed by a long-run sustainable growth rate in Stage 2.
To forecast FCFF and FCFE, analysts build a variety of models of varying complexity. A common approach is to forecast sales, with profi tability, investments, and fi nancing derived from changes in sales.
Three-stage models are often considered to be good approximations for cash fl ow streams that, in reality, fl uctuate from year to year.
E. EBIT
F. Accounts receivable G. Accounts payable
H. Property, plant, and equipment I. Notes payable
J. Cash dividends paid
K. Proceeds from issuing new common shares L. Common stock share repurchases
2. LaForge Systems, Inc., has net income of $ 285 million for the year 2003. Using information from the company ’ s fi nancial statements below, show the adjustments to net income that would be required to fi nd
A. FCFF, and B. FCFE.
C. In addition, show the adjustments to FCFF that would result in FCFE.
LaForge Systems, Inc. Balance Sheet
In millions December 31, 2002 2003
Assets Current assets
Cash and equivalents $210 $248
Accounts receivable 474 513
Inventory 520 564
Total current assets 1,204 1,325
Gross fi xed assets 2,501 2,850
Accumulated depreciation (604) (784)
Net fi xed assets 1,897 2,066
Total assets $3,101 $3,391
Liabilities and shareholders’ equity Current liabilities
Accounts payable $295 $317
Notes payable 300 310
Accrued taxes and expenses 76 99
Total current liabilities 671 726
Long-term debt 1,010 1,050
Common stock 50 50
Additional paid-in capital 300 300
Retained earnings 1,070 1,265
Total shareholders’ equity 1,420 1,615
Statement of Income
In millions, except per share data December 31, 2003
Total revenues $2,215
Operating costs and expenses 1,430
EBITDA 785
Depreciation 180
EBIT 605
Interest expense 130
Income before tax 475
Taxes (at 40 percent) 190
Net income 285
Dividends 90
Addition to retained earnings 195
Statement of Cash Flows
In millions December 31, 2003
Operating activities
Net income $285
Adjustments
Depreciation 180
Changes in working capital
Accounts receivable (39)
Inventories (44)
Accounts payable 22
Accrued taxes and expenses 23
Cash provided by operating activities $427
Investing activities
Purchases of fi xed assets 349
Cash used for investing activities $349
Financing activities
Notes payable (10)
Long-term fi nancing issuances (40)
Common stock dividends 90
Cash used for fi nancing activities $40
Cash and equivalents increase (decrease) 38
Cash and equivalents at beginning of year 210
Cash and equivalents at end of year $248
Supplemental cash fl ow disclosures
Interest paid $130
3. For LaForge Systems, whose fi nancial statements are given in Problem 2, show the adjustments from the current levels of CFO (which is 427), EBIT (605), and EBITDA (785) to fi nd
A. FCFF, and B. FCFE.
4. The term “ free cash fl ow ” is frequently applied to cash fl ows that differ from the defi nition for FCFF that should be used to value a fi rm. Two such defi nitions of “ free cash fl ow ” are given below. Compare the defi nitions given for FCF to FCFF.
A. FCF ⫽ Net income ⫹ Depreciation and amortization ⫺ Cash dividends ⫺ Capital expenditures
B. FCF ⫽ Cash fl ow from operations (from the statement of cash fl ows) ⫺ Capital expenditures
5. Proust Company has FCFF of $ 1.7 billion and FCFE of $ 1.3 billion. Proust ’ s WACC is 11 percent and its required rate of return for equity is 13 percent. FCFF is expected to grow forever at 7 percent and FCFE is expected to grow forever at 7.5 percent. Proust has debt outstanding of $ 15 billion.
A. What is the total value of Proust ’ s equity using the FCFF valuation approach? B. What is the total value of Proust ’ s equity using the FCFE valuation approach?
6. Quinton Johnston is evaluating Taiwan Semiconductor Manufacturing Co., Ltd., (NYSE: TSM) headquartered in Hsinchu, Taiwan. In 2001, when Johnston is performing his analysis, the company — and indeed, the whole industry — is unprofi table. Furthermore, TSM pays no dividends on its common shares. Johnston decides to value TSM using his forecasts of FCFE and makes the following assumptions:
The company has 17.0 billion outstanding shares.
Sales will be $ 5.5 billion in 2002, increasing at 28 percent annually for the next four years (through 2006).
Net income will be 32 percent of sales.
Investment in fi xed assets will be 35 percent of sales, investment in working capital will be 6 percent of sales, and depreciation will be 9 percent of sales.
20 percent of the investment in assets will be fi nanced with debt. Interest expenses will be only 2 percent of sales.
The tax rate will be 10 percent.
TSM ’ s beta is 2.1, the risk-free government bond rate is 6.4 percent, and the equity risk premium is 5.0 percent.
At the end of 2006, Johnston projects TSM will sell for 18 times earnings.
What is the value of one ordinary share of Taiwan Semiconductor Manufacturing Co., Ltd.?
7. Do Pham is evaluating Phaneuf Accelerateur using the FCFF and FCFE valuation approaches. Pham has collected the following information (currency in euro):
Phaneuf has net income of 250 million, depreciation of 90 million, capital expendi-tures of 170 million, and an increase in working capital of 40 million.
FCFF is expected to grow at 6.0 percent indefi nitely, and FCFE is expected to grow at 7.0 percent.
The tax rate is 30 percent.
Phaneuf is fi nanced with 40 percent debt and 60 percent equity. The before-tax cost of debt is 9 percent and the before-tax cost of equity is 13 percent.
Phaneuf has 10 million outstanding shares.
A. Using the FCFF valuation approach, estimate the total value of the fi rm, the total market value of equity, and the value per share.
B. Using the FCFE valuation approach, estimate the total market value of equity and the value per share.
8. PHB Company currently sells for $ 32.50 per share. In an attempt to determine if PHB is fairly priced, an analyst has assembled the following information:
The before-tax required rates of return on PHB debt, preferred stock, and common stock are 7.0 percent, 6.8 percent, and 11.0 percent, respectively.
The company ’ s target capital structure is 30 percent debt, 15 percent preferred stock, and 55 percent common stock.
The market value of the company ’ s debt is $ 145 million, and its preferred stock is valued at $ 65 million.
PHB ’ s FCFF for the year just ended is $ 28 million. FCFF is expected to grow at a constant rate of 4 percent for the foreseeable future.
The tax rate is 35 percent.
PHB has 8 million outstanding common shares.
What is PHB ’ s estimated value per share? Is PHB ’ s stock underpriced?
9. Watson Dunn is planning to value BHP Billiton Ltd. (NYSE: BHP) using a single-stage FCFF approach. BHP Billiton, headquartered in Melbourne, Australia, provides a variety of industrial metals and minerals. The fi nancial information Dunn has assembled for his valuation is as follows:
The company has 1,852 million shares outstanding. Market value of debt is $ 3.192 billion.
FCFF is currently $ 1.1559 billion.
Equity beta is 0.90, the equity risk premium is 5.5 percent, and the risk-free rate is 5.5 percent.
The before-tax cost of debt is 7.0 percent. The tax rate is 40 percent.
To calculate WACC, assume the company is fi nanced 25 percent with debt. FCFF growth rate is 4 percent.
Using Dunn ’ s information, calculate the following: A. WACC
B. Value of the fi rm
C. Total market value of equity D. Value per share
Variable Base Case Value Low Estimate High Estimate
Normalized FCFE0 $0.88 $0.70 $1.14
Risk-free rate 5.08% 5.00% 5.20%
Equity risk premium 5.50% 4.50% 6.50%
Beta 0.70 0.60 0.80
FCFE growth rate 6.40% 4.00% 7.00%
A. Use the base case values to estimate the current value of McDonald ’ s Corporation. B. Calculate the range of stock prices that would occur if the base case value for FCFE 0
were replaced by the low and high estimates for FCFE 0 . Similarly, using the base case values for all other variables, calculate the range of stock prices caused by using the low and high values for beta, the risk-free rate, the equity risk premium, and the growth rate. Rank the sensitivity of the stock price to each of the fi ve variables based on these ranges.
11. An aggressive fi nancial planner who claims to have a superior method for picking undervalued stocks is courting one of your clients. The planner claims that the best way to fi nd the value of a stock is to divide EBITDA by the risk-free bond rate. The planner is urging your client to invest in Alcan, Inc. (NYSE: AL). Alcan is the parent of a group of companies engaged in all aspects of the aluminum business. The planner says that Alcan ’ s EBITDA of $ 1,580 million divided by the long-term government bond rate of 7 percent gives a total value of $ 22,571 million. With 318 million outstanding shares, Alcan ’ s value per share using this method is $ 70.98. Shares of Alcan currently trade for $ 36.50, and the planner wants your client to make a large investment in Alcan through him.
A. Provide your client with an alternative valuation of Alcan based on a two-stage FCFE valuation approach. Use the following assumptions:
Net income is currently $ 600 million. Net income will grow by 20 percent annu-ally for the next three years.
The net investment in operating assets (capital expenditures less depreciation plus investment in working capital) will be $ 1,150 million next year and grow at 15 per-cent for the following two years.
Forty percent of the net investment in operating assets will be fi nanced with net new debt fi nancing.
Alcan ’ s beta is 1.3, the risk-free bond rate is 7 percent, and the equity risk pre-mium is 4 percent.
After three years, the growth rate of net income will be 8 percent and the net invest-ment in operating assets (capital expenditures minus depreciation plus increase in working capital) each year will drop to 30 percent of net income.
Debt is, and will continue to be, 40 percent of total assets. Alcan has 318 million outstanding shares.
Find the value per share of Alcan.
B. Criticize the valuation approach that the aggressive fi nancial planner used.
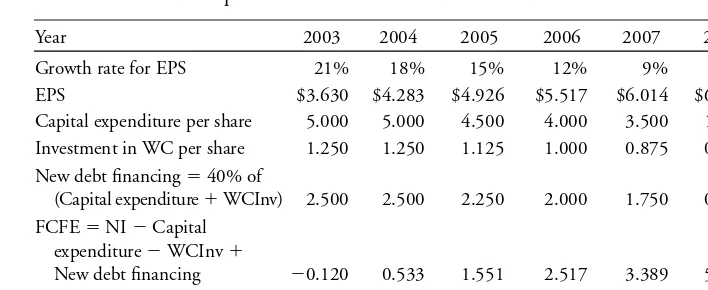
12. Bron has earnings per share of $ 3.00 in 2002 and expects earnings per share to increase by 21 percent in 2003. Earnings per share are expected to grow at a decreasing rate for the following fi ve years, as shown in the following table. In 2008, the growth rate will be
•
•
•
•
•