991
M
ALAYSIAN
J
OURNAL OF
A
NALYTICAL
S
CIENCES
Published by The Malaysian Analytical Sciences Society
FLOOD RISK INDEX ASSESSMENT IN JOHOR RIVER BASIN
(Penilaian Indeks Risiko Banjir di Lembangan Sungai Johor)
Ahmad Shakir Mohd Saudi1,2, Hafizan Juahir1*, Azman Azid1, Fazureen Azaman1
1
East Coast Environmental Research Institute (ESERI),
Universiti Sultan Zainal Abidin, Gong Badak Campus,21300 Kuala Terengganu, Terengganu, Malaysia
2
Faculty of Science and Technology,
Open University Malaysia, 40100 Shah Alam, Selangor Darul Ehsan, Malaysia
*Corresponding author: [email protected]
Received: 14 April 2015; Accepted: 9 July 2015
Abstract
This study is focusing on constructing the flood risk index in the Johor river basin. The application of statistical methods such as factor analysis (FA), statistical process control (SPC) and artificial neural network (ANN) had revealed the most efficient flood risk index. The result in FA was water level has correlation coefficient of 0.738 and the most practicable variable to be used for the warning alert system. The upper control limits (UCL) for the water level in the river basin Johor is 4.423m and the risk index for the water level has been set by this method consisting of 0-100.The accuracy of prediction has been evaluated by using ANN and the accuracy of the test result was R2 = 0.96408 with RMSE= 2.5736. The future prediction for UCL in Johor river basin has been predicted and the value was 3.75m. This model can shows the current and future prediction for flood risk index in the Johor river basin and can help local authorities for flood control and prevention of the state of Johor.
Keywords: Flood Risk Index, Johor River Basin, factor analysis, upper control limit, future prediction
Abstrak
Kajian ini memberi tumpuan kepada pembinaan indeks risiko banjir di lembangan sungai Johor. Penggunaan kaedah statistik seperti analisis faktor (FA), kawalan proses statistik (SPC) dan rangkaian neural buatan (ANN) telah mendedahkan indeks risiko banjir yang paling berkesan. Hasil dalam FA menunjukkan bahawa paras air mempunyai pekali korelasi 0.738 dan pembolehubah yang paling praktikal untuk digunakan sebagai satu sistem amaran. Had kawalan atas (UCL) bagi paras air di lembangan sungai Johor adalah 4.423m dan juga indeks risiko untuk paras air telah dibentuk melalui kaedah ini yang terdiri daripada 0-100. Ketepatan ramalan telah dinilai dengan menggunakan ANN dan ketepatan keputusan ujian adalah R2 = 0.96408 dengan RMSE = 2.5736. Ramalan masa depan untuk UCL di lembangan sungai Johor telah diramalkan dan nilai tersebut adalah 3.75m. Model ini dapat menunjukkan ramalan semasa dan masa depan untuk indeks risiko banjir di lembangan sungai Johor dengan cekap dan dapat membantu Pihak Berkuasa Tempatan untuk kawalan banjir dan pencegahan negeri Johor.
Kata kunci: Indeks Risiko Banjir, Lembangan Sungai Johor, analisis faktor, kawalan had tinggi, ramalan masa depan
Introduction
Flood is a major concern as it is one of the most common natural disasters that is faced by many places around the world. The impact of flood will cause the destruction towards the physical environment, economic and also towards the well - being of a social structure [1,2]. The magnitude and frequency of flood at various locations around the world increase as time goes by.
The severity of flood conditions in this last century could repeat itself in the future. The increasing density of the human settlement along the river basin is boosting rapid development and growth in the river basin area. The flood condition is also exacerbated by the climate change, which affects the rise of sea level [3]. The changes of sea level will definitely cause changes to the condition of flooding in the future compared to the present condition of flood. Areas with moderate probability of flooding will turn to high risk as an effect of the climate change that causes the rising of sea level. In this research, the flood risk classification of the high potential condition for flood occurrence, the factors of the flood, and limitation control were being carried out using case study in Malaysia particularly in the Johor river basin.
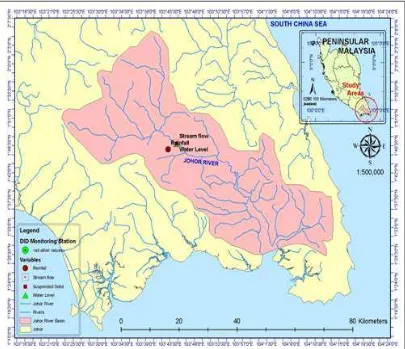
The Johor river basin is located in the south of Peninsular Malaysia and the condition of the river basin is flat on the ground on the surface of the state of Johor except for the upstream of the river basin with the elevations of up to 1010m. There are several tributaries consisted in the Johor river basin and those tributaries are Linggiu, Sayong, Penggeli, Semangar, Lebak, Telor, Panti, Temboyah, and Permadi.
The government of Malaysia had developed two dams in the river basin which are Linggiu dam and Lebam dam. This river basin has high humidity condition and uniform high temperature for the whole year. The climate in the study area varies according to the impact of the monsoon season when heavy rain in the area affects the North-East monsoon, which occurs from November to March every year [4].
The rate of rainfall is normally higher in the higher elevated area with 2500mm of rainfall per year and most of the rainfall occurs during the North-East monsoon season. The Johor river basin faces the repetition of flooding due to the effect of the short period of rainfall, but with very high intensity or from the long period of rainfall with lower intensity for a few weeks. In addition, the backwater effect of the tidal intrusion will cause the flooding from the long period of rainfall worsen itself in the mainstream area.
There are series of flooding events occurred in the study area within this 100 years’ time and thus flooding occurred in 1948, 1969, 1979,1982, 1983, 1987, 1989, 1991, 2004, 2006, and 2007. Most of the flooding events in the study area occurred during North-East monsoon season where within this period, heavier rainfall will cause large amounts of sediment as resulted from the runoff along the river bank.
Based on Gasim et al. [5], he explained that in December 2006/2007, the most disastrous flood to ever occur in Johor of which have caused the total loss of 1.5 billion. This tragedy was the most costly of flooding occurrence in Malaysia. This happened due to the heavy rainfall within a long period of time, which occurred in the low area and the condition of the shallow river and high tide level triggered the biggest flooding event. This tragedy caused 110, 000 people evacuated to a safe zone, which was fully supported by the government. However, 18 people were reported dead in this tragedy.
The flooding event that occurred from the heavy rainfall and the impact of large amount of surface runoff leads to the large amount of suspended solid flow onto the river bed. This suspended solid becomes sedimentation on the river bed which leads to the changes of water level depth and turns the river shallow causing the river easily overflown and causes flooding.
The research in the Johor river basin being continued in this study by focusing on the flood risk pattern recognition by using integrated statistical analysis. The analysis of flood pattern being carried out in this area for 30 years started from 1982 to 2012. The purposed of this study is to determine the factor of flood occurrence, to set up the control limit for flood, to evaluate the accuracy of flood risk prediction and to predict the future control limit for flood in Johor river basin.
Materials and Methods Study Area
993
1o 27’N to 1o 51’N latitude and from 103°42' E to 104°01' E longitude. It is being covered mostly by rubber
plantation, oil palm plantation and virgin forest. Four monitoring stations were selected along the river basin as shown in Figure 1 and Table 1 respectively. The variables being used in this study were Rainfall, Suspended Solid, Stream flow and Water Level. The data has been received from the Department of Drainage and Irrigation from 1982 until 2012. All data being analysed by using XLSTAT and JMP 10 software for integrated chemometric method, statistical process control (SPC) and artificial neural network (ANN).
Figure 1. Location of monitoring stations in Johor river basin
Table 1. Location of monitoring stations in Johor river basin
Station No. Latitude Longitude Name of Station Variables
Site 1737001 1o45’50 N 103° 43"10'E SMK Bukit Besar, Kota Tinggi, Johor Rainfall
Statistical Analysis / Pre-processed Data: Chemometric Techniques
The chemometric technique is an application of the principal component analysis (PCA) to identify the reduction of variables into a set of factors for further analysis. According to [6], this method compares sets of data and identifies the variables that affect the most towards the change of the hydrological modelling in the study area with lower cost and less time compared to other techniques [7].
Factor Analysis (FA)
PCA is applied in this study to define a large number of variables into smaller sets. Factor analysis variables and latent construct that are measured will establish the dimension between these two elements and construct validity evidence of self-reporting scales [8]. It also reduces the number of variables, examines the structure or relationship between variables, and detects and assesses unidimensionality of the theoretical construct [9]. This method also addresses multicollinearity (two or more variables that are correlated), which was carried out in this study as well. The equation for this method was shown in equation 1 below:
Zij = ai1xj1 + ai2xj2 + ai3xj3 + aimx (1)
where Z is component score, a is component loading, x is measured of variable, i is component number and m is total variables
Statistical Process Control
Time series analysis is very important in predicting the water level in the study area. With this method, we were able to evaluate the process from the performance of the analysed data efficiently. It produced three important results, which were important in predicting the hydrological modelling in the future, and those results were upper control limit (UCL), average value (AVG) and lower control limit (LCL). The Sigma in the control chart is represented within the value range of a set of data. The control chart has the ability to uncover some trends and patterns, showing actual data deviations from the historical baseline and dynamic threshold, being able to capture unusual resource usage, and becoming the best base lining to show how the actual data deviate from the historical baseline [10]. The equation (2) that is used in this analysis was shown below:
Moving Range = Plot: MRt for t= 2, 3, ..., m. (2)
where MR= average moving range, t is time and m is individual values. An average value was calculating using equation 3:
x̃ =
∑mi=1xim (3)
where �̅ is moving range, m is individual values and �� is difference between data point
Artificial Neural Network
The concept of the human brain has been utilized in Artificial Intelligent and this is also applied as a method in analysing data and it is called artificial neural network (ANN). This concept was created by McCulloch and Pitts in 1943 make as far as the process is concerned, the weighted sum of the inputs is transferred to the hidden neurons, where it is transformed using an activation function. Learning process also has back propagation which applies error distribution, whereby this application can reduce errors up to a minimum level. This technique is used to minimize error functions and the iteration is terminated when the error function value reaches a pre-defined goal, thus completing the process. The function is expressed in equation 4 below:
f(x)=1/(1+e-x) (4)
995 role in capturing the connectivity of the data when the degree of freedom was functioned to capture the connection, and the size of the network must be sufficient with the degree of freedom or the process will fail. In Addition, a study conducted by [11] discovered the effectiveness of ANN for rainfall, runoff modelling, and flood forecasting. The research also highlighted the ability of ANN in predicting river flow and the quality of water downstream, which were focused on this study as well.
Flood Risk Index Model
The flood risk model has been created from the flood risk index based on a combination of several types of chemometric techniques, statistical process control (SPC) and ANN method. The formation of this model is to develop a precise guideline in determining the risk of flooding in the research area. This model is important and it is a new breakthrough in the study of the risk of flooding in Malaysia and shows the ability sustained in studies done in the flood of research.
The process of creating the risk index in this research must go through a few processes of statistical analysis. First, the selection of the best variable to be used in this model was being carried out by applying PCA. The variables with the highest correlation coefficient will be selected to be used for the next process in the analysis.
After the selection of variable has been made, the determination for control limit value was being progressed by implementing Statistical Process Control. From this method, the formation of Upper Control Limit value and Lower Control Limit will able to give a guideline in determining the ratio of the flood risk index in this research. The Upper Control Limit value is considered an intolerable value for a variable and treated as a high risk condition for flood. For the formation of flood risk index, the Upper Control Limit value was taken and risk index was calculated using the formula equation 5 below:
UCLV/X x 100= 70 (Value of High Risk Index) (5)
where UCLV is Upper Control Limit Value of variable, X is the highest value of the data, 100 is the range of risk index, which is from 1-100 and 70 is significant value of the index for High Risk.
Based on the above equation, the formation of formulas for the risk index is designed to obtain the best risk model for flood. The flood risk index in this study was ranging from 0-100 where the range of 70-100 was being categorized as a high risk index for flood. The flood risk index from 35-69 was considered as moderate risk index, and 0-34 as a low risk index for flood. The selection of range 70-100 was based on the relative strength index (RSI) where 70 and above is considered as upper bound and an intolerable condition [12].
Results and Discussion The factors that contribute to flood occurrences
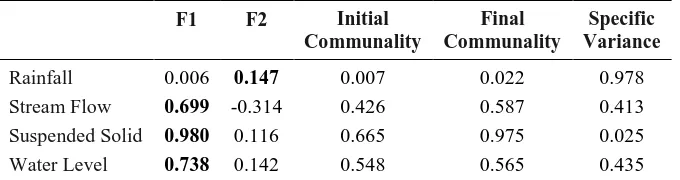
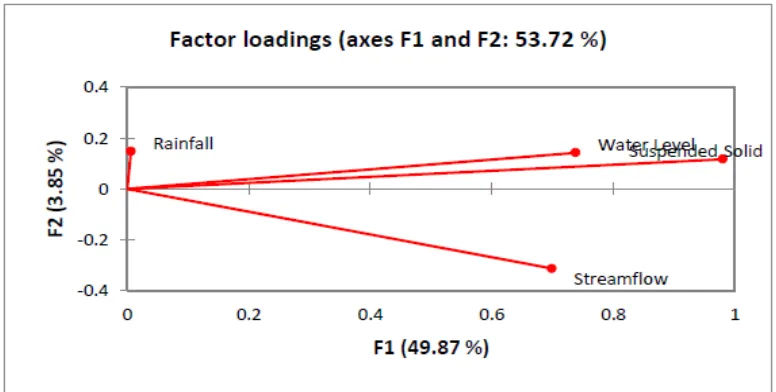
Flood occurrence in the study area actually occurred due to certain factors that caused changes in water level until beyond control limit. Factor analysis was performed in the study to determine the main factor that caused flood occurrence at the Johor river basin, and based on the results in Table 2 and Figure 2 it shows that in F1 suspended solid, stream flow and rainfall were in the same factor with strong coefficient, with the result of 0.699 for stream flow, 0.980 for suspended solid and 0.738 for water level.
Figure 2. Result for correlation coefficient of variables
This shows that these elements belong in the same factor for flood occurrence compared to rainfall, which belongs in F2 with a weak coefficient of 0.147. Based on the research [13], they explained that the result of factors beyond 0.7 was considered for interpretation in factor analysis. From this research, it clearly explained that the factor loading in F1 became the main factor loading for flood occurrence and clearly showed that rainfall was not the major reason for changes of water Level and contributed to flood occurrence.
Flood Control Warning System
The variable of water level has been selected as the main parameter for the flood control warning system. Compared to other variables such as stream flow and suspended solid, the water level shows the high correlation coefficient and the most practical to be taken for parameter in the flood control warning system. The variable is the most dynamic to become the main parameter for the warning alert system for flood. According to Li et al. [14] in their study of the dynamic control of reservoir operation also led to the use of water level variable for the flood study in China.
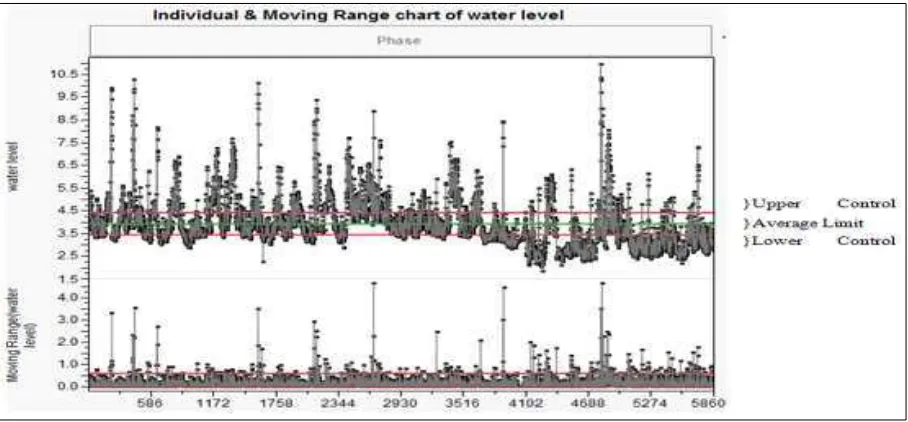
Figure 3 below explains the result of statistical process control of water level and based on the result, the Upper Control Limit for water level was 4.423m. The water level at this limit and above can easily initiate flood occurrence as it is beyond the normal condition of the Johor river basin. The normal condition for water level is usually within the average limit, which is 3.936 m. On the other hand, the Lower Control Limit for water level was 3.450 m.
997 This reading indicates that the warning system which is still used by the DID should be improved and the results of this analysis was able to bring change to the formation of an early flood warning system in the Johor River basin. Production of the Control Limit stated clearly more sensitive and more accurate reading of up to three decimal points can produce a flood warning system that is more efficient at management and the most economical as well as easy to operate.
Improvisation of the warning systems in the Johor River basin can also provide benefits to the DID in providing flood prevention infrastructure in accordance with the new alert level value visualized in Figure 3 clearly shows the pattern of the water level monitoring station located in Johor river basin.
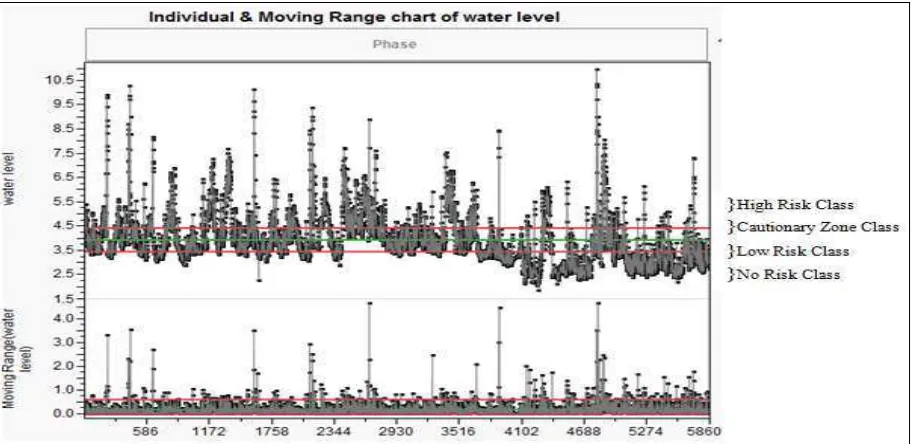
Figure 3. Result for SPC of water level in Johor river basin
Prediction for flood risk classification
The range of risk index has been set up and the value of Upper Control Limit is 70 and it was being categorized as a High Risk class. It is followed by Cautionary Zone class with a range of 35-69, and Low Risk Class with a range of 0-34.
The risks were classified based on the points plotted based on Figure 4 by using Statistical Process Control. It is predicted that for all points plotted above the Upper Control Limit, it is classified as High Risk class with high possibilities for flood occurrence. Cautionary Zone class is classified for all points plotted between the Average Limit line and Upper Control Limit line.
This class is considered for the Local Authority to prepare to take action for any possibilities of flood occurrence before the water level rises up to High Risk class. The Low Risk class is all the data plotted between Average Limit line and Lower Control Limit line, and this is being considered as normal condition for Johor river basin, while No Risk class is classified for the data below the Lower Control Limit line and at this condition, the river basin is considered to be safe from floods.
class with a range of 0-34, and 32.2% being classified within No Risk class. The accumulative for High Risk class and Cautionary Zone class for Water Level at the research area was 37.77%.
Figure 4. Result of risk pattern analysis in Johor river basin
Based on the results obtained, the overall water level data for the research area in the Johor River basin have been separated by risk index and risk class respectively. Risk analysis in this analysis clearly visualizes the level of flood risk based on the index derived from the water level of the research area in thirty years.
Johor river basin is surrounded by an active development and also has a variety of economic activities that contribute to the source of income for the state of Johor. Thus, a sound study of the risk must be implemented to ensure early action plans work best for comprehensive flood prevention in an effort to maintain economic stability in Johor state. Weakness in flood risk analysis in the research area will result in a weak emergency response plan of by the local authority as well as the Johor state government that can cause significant losses to many parties, including the civilians in the event of flooding in the research area.
The formation of risk review of this research appears to facilitate DID in Johor in setting the level of flood risk in the research area in a systematic and clear way. Risk index obtained in this analysis can be applied in the DID analysis to improve the existing flood risk, and the risk classification can be applied based on the year to see the pattern of risk with a more detailed plan of action to provide a more effective flood prevention for the state of Johor. Risk analysis generated by this research was able to provide a positive impact on the level of flood management for the state of Johor since the method used was simple, effective, and low cost and can have a big impact on the study of floods in Johor.
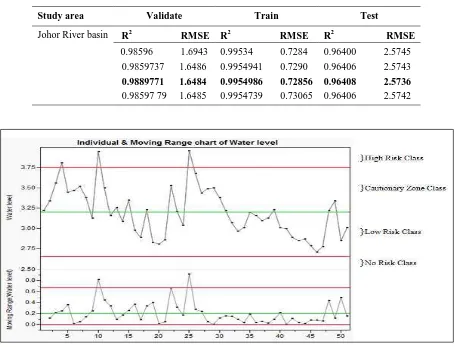
999 achieve optimal results. Prediction further analysed for the test partition, representing 20% of the total data. The results show a statistical prediction of the risk index was highly significant results of R2 is 0.96408 and the lowest RMSE of 2.5736 and the results of three hidden nodes required to achieve optimal results. Based on the test partition, the control limit for the future was expected and predictions of partition test results were significant and accurate. Based on Figure 5, prediction for the control limit risk index in the future was at the height of 3.75m and above was considered to be High Risk class, 3.20m - 3.74m was Cautionary Zone class, 2.65m - 3.19m was Low Risk category class, and 2.64m below was No Risk class category. The prediction appears accurate with prediction accuracy above 90%. It turns out that the prediction of future risk class hierarchy for the Johor river basin can be used by local authorities for planning flood control state in the future.
Table 3. The prediction of risk index by using ANN in Johor river basin
Study area Validate Train Test
Johor River basin R2 RMSE R2 RMSE R2 RMSE
0.98596 1.6943 0.99534 0.7284 0.96400 2.5745 0.9859737 1.6486 0.9954941 0.7290 0.96406 2.5743
0.9889771 1.6484 0.9954986 0.72856 0.96408 2.5736
0.98597 79 1.6485 0.9954739 0.73065 0.96406 2.5742
Figure 5. Result for future prediction of risk index pattern in Johor river basin
Conclusion
flood control for Malaysia Comparisons have been made in this study to confirm the ability of risk models developed with a history of flooding for each study area for 30 years. It turns out that the comparison proves the effectiveness of the risk model at optimum levels when the group of large-scale flood proved successful and is similar to the pattern of risk based on the risk index for flood risk model developed in this study. Thus, the used of risk models in this study were able to bring major changes to the global flood control issues in general and particularly in Malaysia.
Acknowledgement
The authors acknowledge the Department of Drainage and Irrigation (DID) under Ministry of Natural Resources and Environment for giving us permission to utilize hydrological data, and East Coast Environmental Research Institute (ESERI), UniSZA for giving advice, guidance and support for this study.
References
1. Strahler, N and Strahler, A (1978). Geography and man’s environment, John Wiley and Sons, U.S.A.
2. Ward, R. C. and Smith, K. (1998). Flooding: Physical processes and human impacts, John Wiley and Jones Ltd, England.
3. Nicholls, J.R., Natasha, M., Jason A. L., Sally B., Pier V., Diogo D.G., Jochen H. and Richard S. J. (2010).
Sea-level rise and its possible impacts given a ‘beyond 4°C world’ in the twenty-first century. Journal of the
Royal Society of Philosophical Transaction 369: 161-181.
4. Mouhsen, S., Zulkifli, Y., Fadhilah, Y., Shamsuddin, S., and Milad J. (2013). Flood Frequency Analysis Based on the t-copula for Johor River, Malaysia. Journal of Applied Sciences 13: 1021-1028.
5. Gasim M. B., Surif S., Mokhtar M., Toriman M. E., Rahim S. A., and Chong H. B. (2010). Flood Analysis of December 2006: Focus at Segamat Town, Johor. Sains Malaysiana 39: 353–361.
6. Floyd, F. J. and Widaman, K. F. (1995). Factor analysis in the development and refinement of clinical assessment instruments. Psychological Assessment 7(3), 286-299.
7. Gorsuch, R. L. (1990). Common Factor-Analysis versus Component Analysis - Some Well and Little Known Facts. Multivariate Behavioral Research 25(1), 33-39.
8. Thompson B. and Daniel L.G. (1996). Factor analytic evidence for the construct validity of scores: A historical overview and some guidelines. Educational and Psychological Measurement 56(2):197-208. Assessment of Water Quality Due To Land-Use Changes along Kuantan River Basin. From Sources to Solution 2014: pp 297-300.
14. Li, X., Guo, S., Liu, P., and Chen, G. (2010). Dynamic control of flood limited water level for reservoir operation by considering inflow uncertainty. Journal of Hydrology 391:124–132.