The Influence of Profitability, Liquidity, Leverage
,
and
Company
Growth to Dividend Policy
on Agricultural Companies
In Indonesia
Stock Exchange
OktaFiningsih1, Siti Nurlaela2, Kartika Hendra Titisari3 1), 2), 3)
Accounting Study Program, Faculty of Economics, Univercity of Islam Batik Surakarta, Indonesia
1)
Abstract: Capital Market Issuers in Indonesia are divided into several sectors. One of them is the agricultural sector. The agricultural sector contributes 1.69% of the total market capitalization in the Indonesia Stock Exchange (IDX). The agricultural sector is the owner of the smallest capitalization value compared to other sectors, this is because the number of agricultural sector issuers is also smaller than other sector issuers. So far the author has not found a research focusing on agricultural sector companies. Population in this research is all agriculture company in Indonesia Stock Exchange, sample is determined by purposive sampling method. This research is focused to know the influence of financial ratios namely Profitability, Liquidity, Leverage, and Company Growth to dividend policy on agricultural companies in Indonesia Stock Exchange period 2011-2016. The dependent variable in this study is Dividend Policy, and the independent variable consists of Profitability, Liquidity, Leverage, and Company Growth. Methods of data analysis using multiple linear regression analysis. The result of multiple linear regression test shows that profitability ratio measured by Return on Asset has significant influence to the dividend policy, while other independent variables have no significant influence to dividend policy. The result of determination coefficient test shows that 19.8% dependent variable in this research can be explained by the model of this research.
Keyword: Profitability, Liquidity, Leverage, Growth, Dividend
1. INTRODUCTION
Issuers in Indonesian capital market are categorized into several sectors, including: agriculture, mining, basic industries, various industries, consumer
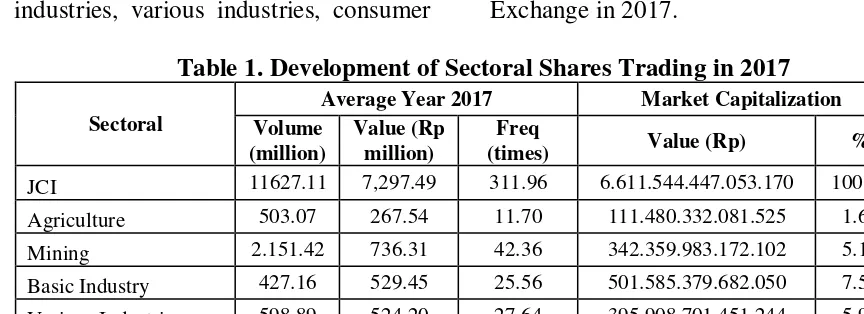
goods industries and other sectors. Table 1 presents the development of sectoral stock trading on the Indonesia Stock Exchange in 2017.
Table 1. Development of Sectoral Shares Trading in 2017
Sectoral
Average Year 2017 Market Capitalization Volume
(million)
Value (Rp million)
Freq
(times) Value (Rp) %
JCI 11627.11 7,297.49 311.96 6.611.544.447.053.170 100.00
Agriculture 503.07 267.54 11.70 111.480.332.081.525 1.69
Mining 2.151.42 736.31 42.36 342.359.983.172.102 5.18
Basic Industry 427.16 529.45 25.56 501.585.379.682.050 7.59
Various Industries 598.89 524.20 27.64 395.908.701.451.244 5.99
Consumption Industry 439.86 589.95 22.14 1.426.822.476.816.590 21.58
In 2017 the agricultural sector contributes 1.69% of the total market capitalization. The agricultural sector is the owner of the smallest capitalization value compared to other sectors, this is because the number of issuers of the agricultural sector is also less than the issuers of the other sectors.
This study aims to perform empirical tests on the influence of profitability, liquidity, leverage, and company growth to Dividend Policy. The dividend policy is basically to determine how much of the share of profits to be shared with shareholders or to be retained as part of profits which are subsequently reused for the operations of the company. Based on previous studies there are several factors that managers need to consider in making dividend policy decisions.
Lintner (1956) suggests that the dividend decision is based on the company's current profitability and dividends the previous year. Miller & Modigliani (1961) argue that dividend policy is irrelevant to company value. Gordon (1963) provides Bird in Hand
Teory, an increase in dividend can affect
shareholder wealth positively due to imperfect information and uncertainty in the market.
Arihala (2009) and Rehman & Takumi (2012) stated that profitability influences the dividend policy, dividend is the profit distributed, the size of the profits generated by the company will affect the size of the dividend distributed to the shareholders. Sumiadji (2011) states that profitability measured by Return on Asset does not give a significant influence on dividend policy.
Nufiati (2015) states that liquidity has a positive influence on dividend policy, liquidity is the ability of the company to meet its short-term obligations, liquidity is directly related to cash flow, so that cash flow or other high current assets guarantee the availability
of cash for dividend payments. Wijaya
com pany prioritizes debt repayment. Zais (2017) states that Debt to Equity Ratio has a significant negative influence on dividend policy. Sari & Sudjarni (2015) states that leverage has a significant negative influence on dividend policy.
company is able to generate bigger profits then the company will be able to distribute dividends while saving funds as retained earnings.
Alzomaia & Al-Khadhiri (2013), the company's current profitability and previous year's dividend rate have a significant influence on dividend rate in Saudi stock market. Research of Rehman & Takumi (2012) found that profitability has a significant influence on Dividend Payout Ratio. Zais (2017) research shows that profitability proxied by Return on Assets has a positive and significant influence on dividend policy. The results of research conducted by Khan and Ahmad (2017) also show a similar thing, where profitability also has a positive and significant influence on dividend payout. Arihala (2009) research results show that Profitability has a positive influence on dividend policy. Hypothesis to test the influence of Profitability to dividend policy is:
H1: Profitability has a significant influence to dividend policy on agricultural companies in Indonesia Stock Exchange
The Influence of Liquidity to Dividend Policy
Liquidity is the company's ability to fund its operations and meet its short-term liabilities. Liquidity is defined as a comparison between the amount of cash and other assets that can be equated with cash on the one hand with the amount of current debt on the other, as well as expenditures to arrange the company on the other (Riyanto, 1995). Sari & Sudjarni (2015) states that the Current Ratio have a positive and significant influence on dividend policy. The higher the current ratio of a company means the higher the liquidity of a company, the greater its likelihood that the company pays dividends. The hypothesis to test the
influence of liquidity to dividend policy is:
H2: Liquidity has a significant affect to dividend policy on agricultural companies in Indonesia Stock Exchange
The Influence of Leverageto Dividend Policy
Sulistyowati et al (2010), the greater the leverage of a company, the lower the amount of dividends to be paid in order to reduce dependence on external funding. So the greater the proportion of debt used for the capital structure of a company, the greater the number of obligations that will affect the size of the dividend to be distributed. Rehman & Takumi (2012) stated that Debt to Equity Ratio (DER) has a positive relationship agricultural companies in Indonesia Stock Exchange
The Influence of Company Growth to Dividend Policy
available for dividend will be greater (Riyanto, 1995).
Silviana (2014) Assets Growth is declared to have significant influence with negative direction toward devidend payout ratio. Thus any growth of the company will result in decreased devidend payout ratio. Hypothesis to test the influence of Company growth to dividend policy is:
H4: Company growth has a significant influence to the dividend policy on agricultural companies in Indonesia Stock Exchange
2. METHOD
The population in this study are all agricultural companies listed on the Indonesia Stock Exchange and publish their financial statements during the
period 2011-2016. The sample is determined by Purposive Sampling method with criterias: (1) Agricultural companies listed in Indonesia Stock Exchange and publish complete financial data for 6 consecutive years from 2011-2016, (2) Agricultural companies in Indonesia Stock Exchange which publish their data completely in accordance with the information required during the period 2011-2016, (3) The agricultural companies in Indonesia Stock Exchange consistently distributed dividends of 6 consecutive years during 2011-2016.
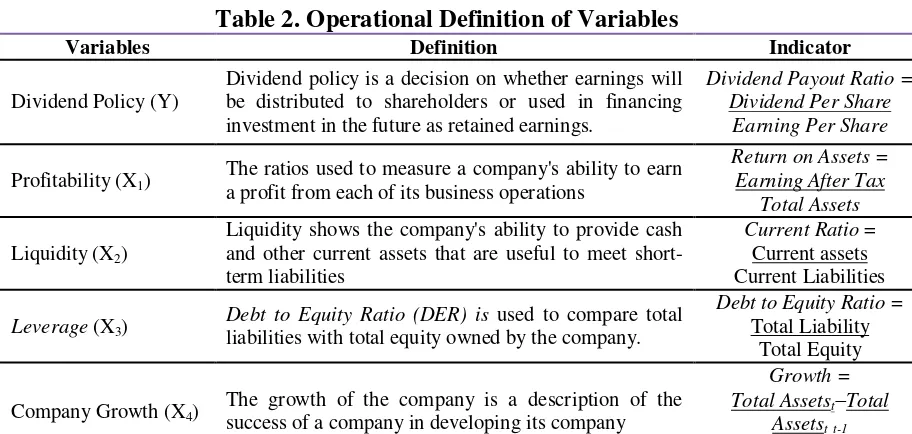
The independent variables in this research are profitability, liquidity, leverage, and company Growth. Dependent variable in this research is Dividend Policy. Operational definition of variables in this study are presented in Table 2.
Table 2. Operational Definition of Variables
Variables Definition Indicator
Dividend Policy (Y)
Dividend policy is a decision on whether earnings will be distributed to shareholders or used in financing investment in the future as retained earnings.
Dividend Payout Ratio =
Dividend Per Share
Earning Per Share
Profitability (X1)
The ratios used to measure a company's ability to earn a profit from each of its business operations
Return on Assets = liabilities with total equity owned by the company.
Debt to Equity Ratio = Total Liability
Total Equity
Company Growth (X4)
The growth of the company is a description of the success of a company in developing its company
Growth = multiple linear regression analysis using
IBM SPSS 21 application.
3. RESULTS
Descriptive statistics provide an overview of statistical data on the minimum, maximum, mean, and standard
deviation. The results of descriptive statistical analysis are presented in table 3.
Table 3. Descriptive Statistics Test Results
N Minimum Maximum Mean Std. Deviation
DPR 30 0.103 0.786 0.32303 0.118233
ROA 30 0.012 0.251 0.07627 0.051669
CR 30 0.802 8,077 2.71793 2.365801
DER 30 0.152 2,683 0.82373 0.761278
GROWTH 30 0.016 3,346 0.13950 0.088257
Valid N (listwise) 30
Source: Data processed, 2017
Based on Table 3 it can be seen that Dividend Policy as measured by Dividend Payout Ratio (DPR) has the minimum value that is 0.103 and the maximum value is 0.786, the average (mean) value is 0.32303, and the standard deviation value is 0.118233. The mean value is bigger than the standard deviation (0.32303 > 0.118233) which means that the distribution of the Dividend Payment Ratio is good.
Profitability as measured by Return on Assets (ROA) has the minimum value that is 0.012 and the maximum value is 0.251 , the average value (mean) is 0,07627, and the standard deviation is 0.051669 . Mean value is bigger than the standard deviation (0.07627 > 0.051669) which means that the distribution of Return on Asset value is good.
Liquidity as measured by the Current Ratio (CR) has the minimum value that is 0.802 and the maximum value is 8.077, the average (mean) value is 2.71793, and the standard deviation value 2.3659. Mean value is bigger than standard deviation (2.71793 > 2.365801) which means that the distribution of Current Ratio value is good.
Leverage as measured by Debt to Equity Ratio (DER) has the minimum value that is 0.152 and the maximum value is 2.683, the average (mean) value is 0,82373, and the standard deviation value is 0.761278. Mean value is bigger than standard deviation (0.82373 > 0.761278) which means that the distribution of Dept to Equity Ratio value is good.
Company growth measured by Assets Growth has the minimumt value 0.016 and the maximum value is 0.346, the average (mean) value is 0.13950, and the standard deviation value is 0.089163. Mean value is bigger than standard deviation (0.13950 > 0.088257) which means that the distribution of Growth value is good.
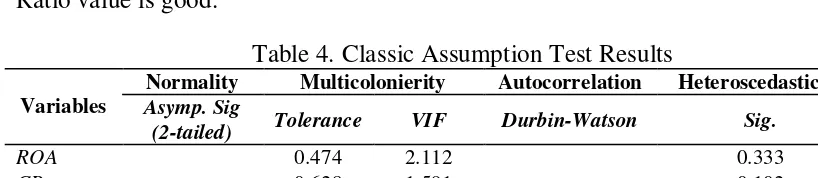
Classic Assumption Test
The classical assumption test aims to produce a good regression model. To avoid mistakes in testing classical assumptions the number of samples used should be free of bias (Ghozali, 2012). The results of the classic assumption test are presented in Table 4.
Table 4. Classic Assumption Test Results
Variables
Normality Multicolonierity Autocorrelation Heteroscedasticity
Asymp.Sig
(2-tailed) Tolerance VIF Durbin-Watson Sig.
ROA
0.435
0.474 2.112
1.7760
0.333
CR 0.628 1.591 0.102
DER 0.302 3.316 0.312
GROWTH 0.442 2.261 0.683
Based of Table 4, it is known that normality test results show Asymp. Sig
(2tailed) value. Significant value is 0.435
> 0.05, this indicates that the overall data in this study is normally distributed. The Multicolonierity Test Result shows that the overall independent variable has
Tolerance > 0.10 and VIF < 10, this indicates that the regression model in this research is free from the symptoms of multicolonierity. The results of the Autocorrelation Test shows that the value
of Durbin-Watson is 1.776, it can be
determined the value (dl) of 1.1426 and (du) of 1.7386, then the value du < DW
<4-du (1.7386 < 1.7760 < 2.2614), this indicates that there is no positive and negative autocorrelation in the regression
model used in this study. Hiteroskedasticity test results showed that the value of significant each independent variable > 0.05, this indicates that the independent variable in this study did not occur Heteroscedasticity symptoms. Overall it can be concluded that the model in this study has passed the classical assumption test.
Hypothesis Test
Data analysis method used to test the hypothesis is multiple linear regression analysis. The results of the model Feasibility Test and Coefficients Regression Test is presented in Table 5 and Table 6.
Table 5. Model Feasibility Test Result
Model Sum of Squares df Mean Square F Sig.
1
Regression 0.125 4 0.031 2,791 , 048 b
Residual 0.280 25 0.011
Total 0.405 29
Source: Data processed, 2017
Result of model feasibility test presented in table 5 can be seen that the value of Farithmetic > Ftable (2,791 > 2,760)
and sig value is ≤ 0.05), this indicates that the model in this study has passed of the model feasibility test.
Table 6. Regression Coefficient Test Results
Model
Unstandardized Coefficients
Standardized
Coefficients t Sig.
B Std.Error Beta
1 (Constant) 0.176 0.063 2,795 0.010
ROA 1,189 0.553 0,520 2,150 0.041
CR 0.020 0.010 0.390 1.861 0.074
DER 0.095 0.047 0.609 2.013 0.055
GROWTH 0.535 0.335 -0.400 1,598 0.123
Source: Data processed, 2017
Based on multiple linear regression test result, regression equation formed:
Dividend Policy = 0,176 + 1,189.ROA + 0,020.CR + 0,095.DER - 0,535.Growth
Based on the regression equation formed can be explained things as follows:
growth (Growth) has a 0 (zero) value.
b. Profitability as measured by Return On Assets (ROA) has a value of regression coefficient is equal to 1.189 with a positive direction, it can be interpreted that every 1% (one percent) increase of Profitability (ROA) variable, assuming other variables have a fixed value, then will raise the dividend policy (DPR) by 0.189 or 118.9% (one hundred and eighteen commas per cent).
c. The liquidity as measured by the Current Ratio (CR) has a regression coefficient value of 0.020 with a positive direction, it can be interpreted that every 1% (one percent) increase of the liquidity (CR) variable, assuming another variables have fixed value, then will raise the dividend policy by 0.020 or 2.0% (one point nine percent).
d. Leverage as measured by Debt to Equity Ratio (DER) has a regression coefficient value of 0.095 with a positive direction, it can be interpreted that every 1% (one percent) increase leverage (DER) variable, assuming other variables have fixed value, it will raise the dividend policy by 0.095 or 9.5% (eight point eight percent). e. The Company growth as measured
by Asset Growth (Growth) has a regression coefficient value of 0,535 with a negative direction, it can be interpreted that every 1% (one percent) increase company growth (growth) variable, assuming other variable have fixed value, it will reduce the dividend policy (DPR) by 0.535 or 53.5% (fifty one point five percent).
Coefficient Determination Result
The result of Coefficient Determination test is presented in tabel 7.
Table 7.Coefficient Determination (R2) Results
Model R R Square Adjusted R Square Std. Error of the Estimate
1 0,556a 0,309 0,198 0,105875
Source: Data processed, 2017
The Results of coefficient of determination (R2) test in Table 7 shows that the value of Adjusted R Square is 0.198. This means that the 19.8% dependent variable in this study can be explained by independent variables namely profitability (ROA), liquidity (CR), leverage (DER ), and company growth (Growth). While the rest of 80,2% explained by other variable outside this research model.
4. DISCUSION
The Influence of Profitability to Dividend Policy
Profitability (ROA) has a value of tarithmetic > ttable (2.150> 2.060) with a significance value is 0.041. The value of significance is 0.041> 0.050. It means that profitability (ROA ) has a significant influence on Dividend Policy (DPR). The first hypothesis (H1) is accepted.
current profitability and partly on dividends from the previous year. This result also corresponds to the Bird in Hand Theory put forward by Gordon (1963) stating that investors prefer cash dividends rather than uncertain income on future investments.
Dividend are taken from the net results of research conducted by Arihala (2009), Rehman & Takumi (2012) states that profitability affect the dividend policy.
The Influence of Liquidity to Dividend Policy
Liquidity (CR) has a value of tarithmetic <ttable (1.861 < 2.060) with a significance value is 0.074. The value of significance is 0.074> 0.050. This indicates that liquidity (CR) has no significant influence on Dividend Policy (DPR). The second hypothesis (H2) is rejected.
Liquidity is the company's ability to fund its operations and meet its short-term liabilities. The results showed that the liquidity does not give a significant influence on the size of the dividend payout ratio. This result is due to the presence of companies that have high liquidity ratios but distribute small dividends. This can be seen in one company that is PT. BISI Internation Tbk. where in 2011 to 2015 has a very high liquidity ratio, but distributes dividends with a relatively small but stable amount. So the size of the liquidity ratio does not give a significant influence on the company's decision in determining the amount of dividends.
The results of this study are relevant to the results of research
Arihala (2009), Kadir (2008), and Wijaya (2017) stating that liquidity as measured by Current Ratio (CR) has no influence on dividend policy.
The Influence of Leverage to Dividend Policy
Leverage (DER) has value t arithmetic <t table that is (2.013 < 2,060) with value of significancy is 0.055 > 0.05. This indicates that Leverage (DER) has no significant influence on the Dividend Policy (DPR). The third hypothesis (H3) is rejected. company by distributing dividends to shareholders in a stable and consistent manner from year to year. The Company prioritizes the payment of stable dividends to shareholders as a sign of the company's success in generating profits.
The results of this study support research conducted by Deitiana (2009), Lestari (2017), Wijaya (2017) and Khan & Ahmad (2017) stating that Leverage has no significant influence on dividend policy.
The Influence of Company Growth to Dividend Policy
Company Growth (Growth) has a value of tarithmetic < ttable is (1.598 < -2.060) with sig. 0.123 > 0.05. This indicates that Growth does not significantly affect Dividend Policy (DPR). So the fourth hypothesis is rejected.
The results of this study support the results of Marietta & Sampurno (2013), Swastiyastu (2014) and Lestari (2017) studies which stated that the growth of a company measured by Assets Growth (Growth) has no effect on dividend policy, but the results of this study contradict the proposed by Zaman (2013) which states that the company's growth has a significant effect on the dividend policy.
5. CONCLUSION
This study aimed to determine the influence of Profitability, Liquidity, Leverage and Growth on the Dividend Policy in agricultural companies in Indonesia Stock Exchange in 2011-2016. Based on the result of multiple linear regression analysis can be concluded: (1) Profitability significantly influences dividend policy as measured by Dividend Payout Ratio, (2) Liquidity has no significant influence on dividend policy, (3) Leverage has no significant 0.198, it means that 19.8% of dependent variables in this study can be explained by the independent variable is profitability; liquidity; leverage; and company growth, while the remaining 80.2% is explained by other variables outside of this research model.
The sample of companies used in this study is the agricultural sector companies, so the results of this study may not be generalizable to other sector companies.
Recomendation for next research is to use more other variables that can be a factor in influencing dividend policy, using other sector companies that can
provide more data to be processed to avoid failure in statistical testing.
Thanks to :
Sri Hartono, Yuli Chomsatu Samrotun, Siti Nurlaela, and Kartika Hendra Titisari
6. REFERENCES
Alzomaia, T. S., & Al-Khadhiri, A. (2013). Determinants of Dividend Policy: The Evidence from Saudi Arabia. International Journal of
Business and Social Science, 4,
181-191.
Arihala, M. A. (2009). Pengaruh Free Cash Flow Profitabilitas, Likuiditas, dan Leverage Terhadap Kebijakan Dividen. Jurnal
Keuangan dan Perbankan, 3,
78-87.
Deitiana, T. (2009). Faktor-Faktor yang Mempengaruhi Pembayaran Dividen Kas. Jurnal Bisnis dan
Akuntansi, 3, 57-64.
Ghozali, I. (2012). Aplikasi Analisis Multvariate dengan Program IBM
SPSS 20. Cetakan VI. Semarang:
Badan Penerbit Universitas Diponegoro.
Gordon, M. J. (1963). Optimal Investment and Financing Policy.
The Journal of Finance, 264-272.
Kadir, A. (2008). Analisis Faktor-Faktor yang Mempengaruhi Kebijakan Dividen Pada Perusahaan Public Agencies Go Public di Bursa Efek Indonesia.
Jurnal Manajemen dan Akuntansi,
10-20.
Journal of Financial Studies &
Research, 2017, 1-16.
Lestari, E., & Sulistyawati, A. I. (2017). Kebijakan Dividen Pada Indeks Saham LQ45 di Bursa Efek Indonesia. Jurnal Akuntansi
Indonesia, 6, 113-130.
Lestari, E., Sulistyawati, & Ika, A. (2017). Kebijakan Dividen Pada Indeks Saham LQ45 di Bursa Efek Indonesia. Jurnal Akuntansi
Indonesia, 6, 113-130.
Lintner, J. (1956). Distribution of Incomes of Corporations Among Dividens, Retained Earnings, and.
The American Economic Review, 46, 97-113.
Maladjian, C., & Khoury, E. R. (2014). Determinants of The Dividend Policy: An Empirical Study on Lebanese Banks. International Journal of Economics and Finance, 6, 240-256.
Marietta, U., & Sampurno, D. (2013). Analisis Pengaruh Cash Ratio, Return on Assets, Growth, Firm Size, Dept to Equity Ratio Terhadap Dividend Payout Ratio.
Diponegoro Journal of
Management, 2, 1-11.
Marietta, U., & Sampurno, D. (2013). Analisis Pengaruh Cash Ratio, Return on Assets, Growth, Firm Size, Dept to Equity Ratio Terhadap Dividend Payout Ratio.
Diponegoro Journal of
Management, 3, 1-11.
Miller, M. H., & Modigliani, F. (1961). Dividend Policy, Growth, and the Valuation of Share. The Journal of
Business, Vol. 34, No. 4, 34,
411-433.
Miller, M. H., & Modigliani, F. (1961). Dividend Policy, Growth, and the
Valuation of Shares. The Journal of
Business, 34, 411-433.
Moradi, M., Salehi, M., & Honarmand, S. (2010). Factors Affecting Dividend Policy Empirical Evidence of Iran. Poslovna
Izvesnost Zagreb, 4, 45-62.
Nufiati, N. M. (2015). Pengaruh Profitabilitas dan Likuiditas Terhadap Kebijakan Dividen Pada Perusahaan Pefindo 25. Jurnal Ilmu
dan Riset Manajemen, 4, 1-18.
Rehman, A., & Takumi, H. (2012). Determinants of Dividend Payout Ratio: Evidence From Karachi Stock Exchange (KSE). Journal of Contemporary Issues in Business
Research, 1, 20-27.
Riyanto, B. (1995). Dasar-Dasar Pembelanjaan Manajemen Edisi 4.
Yogyakarta: BPFE.
Sari, K. A., & Sudjarni, L. K. (2015). Pengaruh Likuiditas, Leverage, Pertumbuhan Perusahaan, dan Profitabilitas Terhadap Kebijakan Dividen Pada Perusahaan Manufaktur di BEI. E-Jurnal
Manajemen Unud, 4, 3346-3374.
Silviana, C. (2014). Analisis Variabel-Variabel Yang Mempengaruhi Kebijkan Deviden (Studi Pada Saham Indeks LQ-45 di BEI periode 2010-2012). Jurnal
Adsminitrasi Bisnis (JAB), 15.
Sulistyowati, I., Anggraini, R., & Utaminingtyas, T. H. (2010). Pengaruh Profitabilitas, Leverage, dan Growth Terhadap Kebijakan Dividen dengan Good Corporate Governance Sebagai Variabel Intervening. Simposium Nasioanal
Akuntansi (SNA), 1-23.
Kebijakan Dividen. Jurnal
Dinamika Akuntansi, 3, 129-138.
Swastiyastu, M. W. (2014). Analisis Faktor-Faktor yang Mempengaruhi Kebijakan Dividend Payout Ratio yang Terdaftar di Bursa Efek Indonesia (BEI). E-Journal S1 Ak Universitas Pendidikan Ganesha, 2.
Swatiyastu, M. W. (2014). Analisis Faktor-Faktor yang Mempengaruhi Kebijakan Dividend Payout Ratio yang Terdaftar di Bursa Efek Indonesia (BEI). E-Journal S1 Ak Universitas Pendidikan Ganesha, 2.
Wijaya, N. (2017). Faktor-Faktor yang Mempengaruhi Kebijakan Dividen Pada Perusahaan Non Keuangan.
Jurnal Bisnis dan Akuntansi, 19,
92-102.
Zais, G. M. (2017). Faktor-Faktor yang Mempengaruhi Kebijakan Dividen Pada Perusahaan Industri Barang Konsumsi di Bursa Efek Indonesia.
Jurnal Kompetitif, 6, 10-28.