20
Influence of Fundamental Factors on Dividend Payout Policy: Study on
Construction Companies Listed on Indonesian Stock Exchange
Rico Eka Wahyu Hudiwijono
1, Siti Aisjah
2, Kusuma Ratnawati
3123Master Program of Management, Faculty of Economics and Business, Brawijaya University
Faculty of Economics and Business, Brawijaya University
Abstract
This study examines the fundamental factors that influence the dividend payout policy, namely leverage, liquidity, free cash flow, firm size, firm growth, business risk and profitability. Several previous research results indicate differences in research findings. This study was conducted on five construction contractor companies listed in Indonesia Stock Exchange during 2010 to 2016. Multiple regression analysis was operated through SPSS 20 program and hypoteses testing simultaneously with F-test and partially with t-test. The results show that all independent variable are important factors in dividend payout policy, and firm size is the most dominant factors affecting dividend payout policy.
Keywords: Construction contractor companies, Dividend payout policy, Fundamental factors, Indonesia Stock Exchange.
INTRODUCTION
The number of national construction contractors that are listed on the Indonesia Stock Exchange from 2010 to 2016 amounted to 10 companies. However, only 5 companies which pay dividends regularly every year in that period. They are PT. Adhi Karya tbk, PT. Pembangunan Prumahan tbk, PT. Jaya Konstruksi MP tbk, PT. Wijaya Karya tbk and PT. Total Bangun Persada Tbk. As one of the business types in Indonesia, the construction service business is required to give profit to its shareholders. The company engaging in the property and construction sectors are more likely to pay dividends compared to other business fields [1]. Dividend policy is one of the most controversial issues in the financial sector, but it still remains a puzzle, whether the dividend payout policy may influence a company's value or not [2]. Dividend payout policy is a critical financial decision because it is involved in determining the value of money that should be distributed to the shareholders as profit or internally reinvested. Fundamentals economic factors - that are part of the capital structure and working capital companies also influence dividend payout policy. Participate in initiating the discussion on dividend payout policy as one of the fundamental components of our corporate policy [3]; [4]; [5]. It is seen as an issue of interest in financial literature.
Correspondence address:
Rico Eka Wahyu Hudiwijono
Email : [email protected]
Address : Master Program of Management, Faculty of Economics and Business, Brawijaya University Leverage
Leverage is the company's ability to use assets or funds that have fixed costs or fixed costs (or fixed assets) to increase the level of income (return) for the company owner [6]. Leverage is divided into three types, namely operating leverage, financial leverage and total leverage [6]. Leverage is closely related to the financial obligations of the company, which must be settled with the other parties. Leverage or debt is one of the sources of corporate financing, originating from another party. In this case, it is called a creditor where the fund yielding from debt is used to run the company's operations.
Liquidity
21
Free Cash Flow
Free cash flow is the cash flow available for capital reserves that can be used for reinvestment after fulfilling all of the business needs [7]. Free cash flow can be defined as excess cash to be used to fund projects with positive net worth [8]. Conflict interest arises when shareholders and managers want to determine dividend size to be paid by the availability of free cash flow [9]. state that managers can benefit themselves using excess cash [8]. Therefore, companies should pay dividends to reduce intentions and help managers from spending more money on futile projects.
Company size
Company size is the number and variety of production capacity and the ability of a company to process the production or the amount and variety of corporate services that can be provided simultaneously to its customers [10]. Managers have a larger control over big companies whose ownership is more dispersed and shareholders have little incentive and little ability to monitor the course of operations, as described in agency theory. Thus, large companies will distribute dividends to block the agency costs [11].
Firm growth
The growth factor of the company is also one of the factors that can influence the dividend payout policy [12]. Companies with growing income will tend to pay dividends in small amounts due to high capital demand during the company rapid growth. High-growth firms cost a lot of money to invest in their businesses. Growing companies are trying to improve internal finance and limit their dividend payments because financing with external borrowing is usually higher in interest than using internal funds [13].
Business Risk
Busines risk is a level of risk on the company assets if the company does not use debt on its operational activities [14]. Business risk is related to high cash flow fluctuations [13]. During the declining period or when facing the business risk, dividend payments of the company should be reduced to maintain the level of equity [1]. Profitability
Profitability is often used as a key indicator of a company's profitability capability. For the shareholders of a company, profitability is used as a reference for determining the amount of the dividend payer on the profit of the results of operations within a certain period. Some financial terms represent a value of financial ratios related to the profitability are gross profit margin, net profit margin, return on investment (ROI) or return on assets (ROA) and return on equity (ROE) [6].
HIPOTHESES
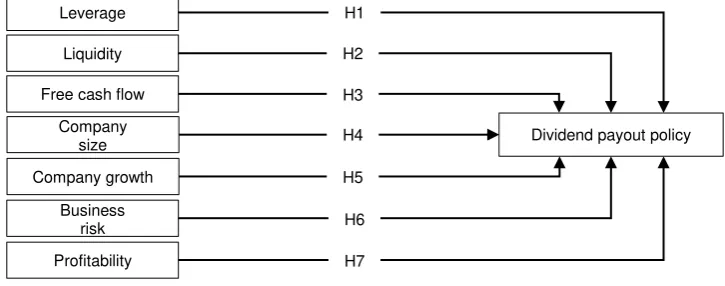
The distribution of dividend by a company is a sign given by the company itself in order to show that the company has performed well in carrying out its operations [14]. A policy can increase the payout of dividends if the manager believes that a high dividend payout can be sustained in the future. Thus, the dividend distribution containing the explanation of the company's performance condition will be in good condition in the present and future (Lintner, 1956). Figure 1 shows the conceptual framework of this study.
The relationship between leverage and dividend payout policy has been tested in research which shows that leverage has a positive effect on dividend payout policy [15]; [16]; [17]; [18]; [19]; [20].
Figure 1. Conceptual Framework Source: Previous Research Results, 2017
Profitability Business
risk Company growth
Company size Free cash flow
Leverage
Liquidity
Dividend payout policy H1
H2
H3
H4
H5
H6
It proves that the company's funds are used to pay corporate liabilities to other parties. Thus, it is necessary to maintain internal sources of the fund rather than to distribute them to shareholders in the form of dividends. In contrast, research results shows a positive relationship between Leverage and the dividend payout policy [21]; [22]; [23]. Their research results show that funds obtained from other parties, in the form of loans or debts, allow the company to freely distribute profit or return to shareholders in the form of dividends. Therefore, the following hypothesis is proposed:
H1 Leverage significantly affects the dividend payout policy
A weak liquidity position makes dividends difficult to pay due to lack of cash [24]. Managers can benefit themselves with excess cash, therefore the company must pay dividends to reduce free cash flow and protect managers from spending more money on futile projects [11]. The relationship between liquidity and dividend payout policy has been tested in a study which indicates that the liquidity factor influence positively and statistically significant to dividend payout policy [17]; [18]; [19]; [20]. On the other hand show that liquidity has a negative but statistically insignificant effect on dividend payout policy [21]; [19]. Therefore, the following hypothesis is proposed:
H2 Liquidity significantly affects the dividend payout policy
Managers can benefit themselves with surplus cash, so the company must pay dividends to reduce goodwill and fortify the manager in the effort to spend more money on futile projects [11]. That the free cash flow has a positive effect and statistically insignificant to the dividend payout policy [22]. On the contrary show that free cash flow has a negative effect but statistically insignificant on dividend payout policy [21]. Meanwhile, free cash flow has a negative effect and statistically significant on the dividend payout policy [18]. Therefore, the following hypothesis is proposed:
H3: Free cash flow significantly affect the dividend payout policy
When the company grows larger, it shows that they have a higher level of asymmetry information resulting in the higher costs of the agency. Show
that company size has a positive effect and statistically insignificant on the dividend payout ratio [15]; [18]; [20]; [23]. Instead, show that company size has a negative effect and statistically significant on the dividend payout policy [21]; [16]. Therefore, the following hypothesis is proposed:
H4: Company size significantly affects the dividend payout policy
Company growth is one of the factors that could affect dividend payout policy [12]. That the growing company tries to improve their internal financial and restrict dividend payments [13]. The reason is that financing with external loans usually has higher interest rates than using internal fund. The growth of the company has a positive effect and statistically insignificant on the policy of dividend payments [21]; [17]. Meanwhile, that company growth has a negative effect and statistically insignificant on the dividend payout policy [15]. Therefore, the following hypothesis is proposed:
H5 Corporate growth significantly affects the dividend payout policy
That business risks are associated with high fluctuations in cash flows [13]. Indicate that business risk influences negatively to the dividend
payout policy that will minimize the company’s
possibility of paying the dividend [15]; [22]. In contrast, that the business risk factors have a positive influence on the dividend-sharing policy [20]; [23]. Thus, invested or risk-bearing businesses can pay their dividends to the shareholders. Therefore, the following hypothesis is proposed:
H6 Business risk significantly affects the dividend payout policy
Companies with more advantages will be more likely to pay dividends to shareholders comparing to the company that does not have the advantage. That profitability has a positive effect on dividend payout policy [15]; [16]; [17]; [18]; [22]. Instead, that profitability negatively affects the dividend payout policy [20]; [23]. Therefore, the following hypothesis is proposed:
23
This study examines the fundamental factors that influence the dividend payout policy, namely leverage, liquidity, free cash flow, company size, business risk, and profitability. Several previous research results indicate the difference in research results. Hence, it is necessary to do research by testing the effect of leverage, liquidity, free cash flow, company size, corporate growth, business risk and profitability of dividend payout policy.
RESEARCH METHOD
This study uses a quantitative paradigm approach, namely the method testing of the theory by examining the relationship between variables [26]. The characteristics of companies as the research population are: (1) construction contractor companies listed on the Indonesia Stock Exchange respectively during the study period from 2010 to 2016; (2) the company has a value of equity without negative value in a row during the study period; and (3) the company pays dividend in a row during the study period. Based on these criteria, there are 5 companies as the members of this research population. The research data combine 7-year time data and cross-section data from 5 companies. The research data is obtained from published sources in the form of the balance sheet and income statement ended on 31 December each year. The source of financial information from Indonesia Capital Market Directory, 2010 - 2016 obtained from Indonesia Stock Exchange and other related sources. The method of collecting data in the form of documentation is taken from existing documents containing past events. This method is used to obtain secondary data in the form of financial statements, stock prices and all information related to the company required in this study. Analysis of this research data is multiple regression analysis. Modeling regression analysis with seven independent variables and one dependent variable in the form of equation Y
= β 0 + β 0 X 1 + β 2 X 2 + β 3 X 3 + β 4 X 4 + β 5 X 5 + β 6 X 6 + β 7 X 7 + e, where Y is the dividend payout policy, β 0 is a constant, β 1-7 is the beta coefficient of the dependent variables (X 1 = Leverage, X 2 = Liquidity, X 3 = free cash flow, X 4 = company size, firm growth X 5 = X 6 = business risk, X 7 = profitability, e = error term). A hypothesis test is conducted simultaneously with the F-test and partially by t-test with a level of error = 5 %.
RESULTS AND DISCUSSION
Table 1 shows the F test results
The value of F arithmetic is 5,270, while F table (α
= 0.05; db regression = 7: residual db = 27) is 2,373. Because F arithmetic> F table is 5.270> 2.373 or Sig value. F (0.006) <α = 0.05 then the regression analysis model is significant. This means that H0 is rejected and H1 is accepted, it can be concluded that the dependent variable (Dividend Payout Policy) can be significantly influenced by independent variables (Leverage (X1, Liquidity (X2) Free Cash Flow (X3), Company Size (X4), Growth (X5), Business Risk (X6) , Profitability (X7).
Table 1. F Test Result (Simultaneous)
Model Sum of
Squares df
Mean
Square F Sig.
Regression 46.412 7 6.630 5.270 0.001
Residual 33.972 27 1.258
Total 80.383 34
Source: Secondary data processed, 2017
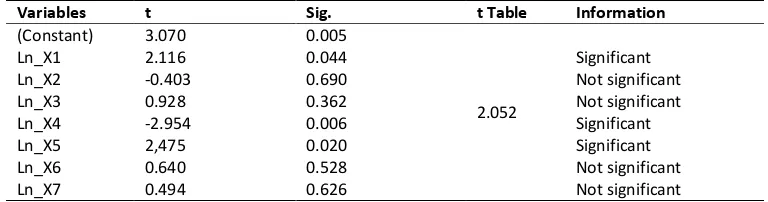
Table 2 shows the result of t-test (partial influence) from each independent variable to the dependent variable. The effect of the test result is partial compared with the significance value t with the probability error value of = 5%. The t-test result between X1 with Y obtains the t-count value
of (2.116) bigger than t-table (2.052) or sig. t
Table2.T-Test Result (Partial)
Variables t Sig. t Table Information
(Constant) 3.070 0.005
2.052
Ln_X1 2.116 0.044 Significant
Ln_X2 -0.403 0.690 Not significant
Ln_X3 0.928 0.362 Not significant
Ln_X4 -2.954 0.006 Significant
Ln_X5 2,475 0.020 Significant
Ln_X6 0.640 0.528 Not significant
Ln_X7 0.494 0.626 Not significant
(0.044) <α = 0.05 then the effect of X1 to Y is
significant which means that H1 is accepted. The
t-test result between X2 and Y obtains the t-count
value = - 0.403 smaller than t-table (2.052) or sig.
t (0.690)> α = 0.05 then the effect of X2 to Y is not
significant, which means H2 is rejected. The t-test
result between X3 and Y obtains the t-count value
of (0.928) smaller than t-table (2.052) or sig. t
(0.362)> α = 0.05 then the effect of X3 to Y is not
significant, which means H3 is rejected. The t-test result between X4 and Y obtains the t-count value
of (2.954) bigger than t-table (2,052) or sig. t
(0.006) <α = 0.05 then the effect of X4 to Y is
significant, which means H4 is accepted. The t-test
result between X5 and Y obtains the t-count value
of (2.475) greater than t-table (2.052) or sig. t
(0.020) <α = 0.05 then the effect of X5 to Y is
significant, which means H5 is accepted. The t-test
result between X6 and Y obtains the t-count value
of (0.640) smaller than t-table (2.052) or sig. t
(0.528)> α = 0.05 then the effect of X6 to Y is not
significant, which means H6 is rejected. The t-test
result between X7 and Y obtains the t-count value
of (0,494) smaller than t-table (2.052) or sig. t
(0.626)> α = 0.05 then the effect of X7 to Y is not
significant, which means H7 is rejected.
The results show that the influence of leverage on dividend payout policy is significant and positive. The increase of Leverage gives a significant impact on the dividend payout policy as the company continues to pay the dividend to its shareholders. This finding is in line with the research conducted by Hashemi and Akhlagi (2010) which show a significant positive relationship between leverage, dividend policy, and profitability. Influence of liquidity to the dividend payout policy is not significant and negative. Liquidity does not affect the dividend payout policy. This finding supports the research conducted that liquidity is not significant in dividend payment [27]; [28]; [2]; [29]. The effect of free cash flow on dividend payout policy is not significant and positive. The availability of cash does not have a big impact on the company because the company can still pay the dividend in a large amount. This finding is in line with the research conducted that the free cash flow factor has a positive effect and statistically insignificant on the dividend payout policy [22]. The increase of Company Size does not directly raise the dividend payout to the shareholders. The company's [16]; [1] . The company growth’s influence against dividend payment policy is significant and positive. Company Growth is very important for the company to pay the dividend. Therefore, the rise in growth will also improve the portion of the dividend payment to the shareholders. On the other hand, the Company with growing income is likely to pay the dividends in the small amount due to the high demand for capital when the company is growing rapidly. This finding is in line with the
research conducted that the company’s growth
has a positive effect and statistically significant on the dividend payout policy [1]. The company with rapid-growth certainly has a large external financing needs with the result that the company does not have to pay the dividend in large amount. The influence of the business risk to the dividend payment policy is not significant and positive. Even the company with risky business type can still pay the dividend. In other words, the company can still pay dividend considering the risky business they are operating. This finding is in line with the research conducted that business risk has an insignificant effect on the dividend payout policy [1]. Thus, the company can still pay dividend to its shareholders despite its risky business. The effect of profitability on dividend payout policy is insignificant and positive. Profitability has no important role in the dividend payout policy because the company can still pay its dividend even when the company does not generate profit. This finding is in line with the research conducted that profitability negatively and insignificantly affects the dividend payment policy [1].
CONCLUSION AND SUGGESTION Conclusion
25
The management division of the company should maintain and increase their service quality. The Company Size has the most dominant effect on the Dividend Payment Policy through increasing the sales, expanding the investment to generate larger profit. By doing so, the manager has more freedom to increase the dividend payment to the stakeholder.
REFERENCE
[1]. Komrattanapanya, P., & Suntraruk, P. (2013). Factors influencing dividend payout in Thailand: A tobit regression analysis. International journal of accounting and financial reporting, 3(2), 255.
[2]. Mehta, A. (2012). An empirical analysis of determinants of dividend policy-evidence from the UAE companies. Global Review of Accounting and Finance, 3(1), 18-31. [3]. Gordon, M. J. (1959). Dividends, earnings
and stock prices. Review of Economics and Statistics(May), 99-105.
[4]. Lintner, J. (1956). Distribution of incomes of corporations among dividends, retained earnings, and taxes. The American Economic Review, 46(2), 97-113.
[5]. Miller, M. H., & Modigliani, F. (1961). Dividend policy, growth, and the valuation of shares. the Journal of Business, 34(4), 411-433.
[6]. Syamsudin, L. (2011). Manajemen Keuangan Perusahaan. Jakarta: Raja Grafindo Persada. [7]. Sindhu, M. (2014). Relationship between free cash flow and dividend: Moderating role of firm size. Research Journal of Finance and Accounting, 5, 128-135.
[8]. Jensen, M. C. (1986). Agency costs of free cash flow, corporate finance, and takeovers. The American Economic Review, 76(2), 323-329.
[9]. Giriati. (2016). Free cash flow, dividend policy, investment opportunity set, opportunistic behavior and firm's value. Procedia - Social and Behavioral Sciences, 219, 248-254.
[10]. Aloy, N., & Velnampy, T. (2014). Firm size and profitability: A study of listed manufacturing firms in Sri Lanka. International Journal of Business and Management, 9(4).
[11]. Jensen, M. C., & Meckling, W. H. (1976). Theory of the firm: Managerial behavior, agency costs and ownership structure. Journal of Financial Economics, 3(4), 305-360.
[12]. Chen, J., & Dhiensiri, N. (2009). Determinants of dividend policy: the evidence from New Zealand. International Research Journal of Finance and Economics, 34(34), 18-28. [13]. Rozeff, M. S. (1982). Growth, beta and
agency costs as determinants of dividend payout ratios. Journal of Financial Research, 5(3), 249-259.
[14]. Brigham, E. F., & Houston, J. F. (2015). Fundamentals of Financial Management (11th ed.). Mason, OH: South-Western. [15]. Al-Malkawi, H.-A. N., Twairesh, A. E., &
Harery, K. (2013). Determinants of the likelihood to pay dividends: Evidence from Saudi Arabia. Journal of American Science, 9(12), 518-528.
[16]. Asad, M., & Yousaf, S. (2014). Impact of leverage on dividend payment behavior of Pakistani Manufacturing Firms. International Journal of Innovation and Applied Studies, 6(2), 216.
[17]. Badu, E. A. (2013). Determinants of dividend payout policy of listed financial institutions in Ghana. Research Journal of Finance and Accounting, 4(7), 185-190.
[18]. Jabbouri, I. (2016). Determinants of corporate dividend policy in emerging markets: Evidence from MENA stock markets. Research in International Business and Finance, 37, 283-298.
[19]. John, S. F., & Muthusamy, K. (2010). Leverage, growth and profitability as determinants of dividend payout ratio-evidence from Indian paper industry. Asian Journal of Business Management Studies, 1(1), 26-30.
[20]. Kaźmierska-Jóźwiak, B. (2015). Determinants of dividend policy: Evidence from Polish Listed Companies. Procedia Economics and Finance, 23, 473-477.
[21]. Appannan, S., & Sim, L. W. (2011). A study on leading determinants of dividend policy in Malaysia listed companies for food industry under consumer product sector.
[22]. Marfo-Yiadom, E., & Agyei, S. K. (2011). Determinants of dividend policy of banks in Ghana. International Research Journal of Finance and Economics, 61(61), 99-108. [23]. Khoury, R. E., & Maladjian, C. (2014).
empirical study on the Lebanese Listed Banks. International Journal of Economics and Finance, 6(4).
[24]. Ahmed, H., & Javid, A. Y. (2009). Determinants of dividend policy in Pakistan. International Research Journal of Finance and Economics, 29, 110-125.
[25]. Anil, K., & Kapoor, S. (2008). Determinants of dividend payout ratios-a study of Indian information technology sector. International Research Journal of Finance and Economics, 15(1), 63-71.
[26]. Creswell, J. W. (2014). Research Design: Qualitative, Quantitative, and Mixed Methods Approaches (4th ed.). Thousand Oaks, CA: SAGE.
[27]. Gill, A., Biger, N., & Tibrewala, R. (2010). Determinants of dividend payout ratios: Evidence from United States. The Open Business Journal, 3, 8-11.
[28]. Mardalani. (2014). Analisis pengaruh return on equity, debt to equity ratio dan current ratio terhadap dividend payout ratio pada perusahaan properti real estate yang terdaftar di Bursa Efek Indonesia 2010-2012. Jurnal Apresiasi Ekonomi, 2(2), 73-79. [29]. Sitanggang, V., & Yeni. (2011). Faktor-faktor