The Influence of Financial Ratios to Predict Profit Growth at the
Company's Manufacturing Sector Industry Goods Consumption Listed in
BEI Period 2014-2016
Nika Arvina a, Kartika Hendra Titisaria, Yuli Chomsatu b a
Universitas Islam Batik Surakarta, JL.KH Agus Salim No. 10 57147, Surakarta, Indonesia
b
Universitas Islam Batik Surakarta, JL.KH Agus Salim No. 10 57147, Surakarta, Indonesia E-mail : [email protected]
Abstract: The purpose of this research is to test and analyze the influence of the financial ratios as measured by the Current Ratio (CR), Debt to Equity Ratio (DER), Total Assets Turnover (TATO), Return On Assets (ROA) of profit growth in manufacturing company the sector industrial of goods consumption listed in BEI period 2014-2016. The population in this research is the whole companies manufacturing sector industrial goods consumption listed in BEI period 2014-2016. While the method of sampling using a Purposive sampling. The sample used as many as 20 companies manufacturing sector industrial goods consumption listed in BEI period 2014-2016. Methods of data analysis used was multiple linear regression analysis. Method of data analysis in this study uses the help of SPSS 17. The results showed that the variable CR, TATO and ROA effect on profit growth. While variable DER has no effect against the profit growth.
Keywords: Profit Growth, Current Ratio (CR), Debt to Equity Ratio (DER), Total Assets Turnover (TATO), and Return On Assets (ROA).
1. INTRODUCTION
Currently the business world is evolving very rapidly, each company vying to attract consumers in order to gain profit that has targeted the company. In order to be able to compete with fellow competitors and are able to develop his company, a company must be able to manage the performance of his company well. Every company has a goal to generate profit, other than that the resulting profit the company can serve as a measure of the success of the company's performance.
The financial information needed by an enterprise that is presented in the form of financial statements, that are useful to the parties concerned. Any investor requires an analysis of the financial statements in order to be easily understood and understand the contents of the financial statements of a company and can figure out the profit of the
company. One of the ways that can be used to analyze financial statements i.e. financial ratios. Financial ratios are used to knowing the financial condition of a company, through a calculation and analysis of financial ratios can be known to the company's financial strength or weakness. In addition with the financial ratio analysis can also provide predictions of corporate profit growth.
Financial ratios are used namely consists of: liquidity ratio, solvency ratio, activity ratio and profitability ratio. In this research the ratio of liquidity is used i.e. Current ratio. Current ratio is a ratio to measure the company's ability to pay short-term obligations or debts immediately due upon billed in its entirety (Kasmir, 2010). On research done Wibisono & Triyonowati (2016) shows that the Current ratio effect significantly to profit growth, but the research done by Djannah & Triyonowati
(2017) and Yanti (2017) shows the results of that Current ratio is negative no effect significantly to profit growth.
While the solvency ratio using the Debt to Equity Ratio. Debt to Equity Ratio is a ratio used to assess the debt with equity (Kasmir, 2010). Research Wibisono & Triyonowati (2016) shows the results of that debt to equity ratio effect significantly to profit growth, in contrast to research Yanti (2017) shows a debt to equity ratio is negative no effect significantly to profit growth.
Then there is activity ratio using the total assets turnover. Turnover Assets (Assets Turnover) is a ratio used to measure the rotation of all assets owned by the company. Then also measure how many sales gained from every rupiah assets (Kasmir, 2010). Research Sulistyowati & Suryono (2017) shows the results of total assets turnover positive and significant effect against the profit growth, yet research Erawati & Widayanto (2016) shows the results of total assets turnover not significantly influential against the growth of profits.
Profitability ratio in this study using Return On Assets. Return On Assets is a ratio that shows the result (return) over the total assets used in the company (Kasmir, 2010). Research Susanti & Fuadati (2014) shows that the return on asssets the influential significantly to profit growth, but the research Yanti (2017) showed a positive return on asssets no effect significantly to profit growth.
Based on the problems and the results still vary between researchers earlier, then researchers want to examine again the influence of financial ratios against growth of profits, this research was done at the manufacturing company the sector industrial of goods consumption with a period of 2014-2016.
By testing the influence of Current
2.1 Population And Sample
The population used to research the entire manufacturing company the sector industrial of goods consumption registered in BEI period 2014-2016. Sampling in this study using a purposive sampling of ways. Sample selection criteria for this study: (1) Company manufacturing sector industrial of goods consumption to publish financial statements audited period consecutive 2014-2016. (2)Company manufacturing sector industrial of goods consumption that have positive earnings after tax.
2.2 Dependent Variable
Bound variables in this research is the profit growth of manufacturing company the sector industrial of goods consumption.
2.3 Independent Variable
2.3.1 Current Ratio
Current Ratio is one of liquidity ratios, which compare between current assets with current liabilities.
2.3.2 Debt to Equity Ratio
between total liability with total equity.
2.3.3 Total Assets Turnover
Total Assets Turnover is one of activity ratios, which compares between sales with total assets.
2.3.4 Return On Assets
Return On Assets is one of profitability ratios, comparing between earning after interest and taxes by total assets.
2.4 Methods Of Data Analysis
Methods of data analysis used in this study i.e., descriptive statistics, classic assumption test and multiple linear regression analysis. Descriptive statistics is the statistics used to analyze data in a way describe or illustrate data that has been collected as-is without intending to make general conclusions applicable to or generalization (Sugiyono, 2006). A classic assumption test consists of normality test, multicollinearity test, autocorrelation test and heteroskedastisitas test. While the multiple linear regression analysis is used to find out the relationship between the dependent variable with independent variable. Multiple linear
regression analysis consists of a regression models, model feasibility test ( F test), hypothesis test (t-test), and coefficient of determination (R2) test. Multiple linear regression equations in this research are:
Y = a + b1X1 + b2X2 + b3X3 + b4X4 + e
Where:
Y = profit growth a = Constant
b1,b2,b3,b4 = Regression Coefficient,
X 1 = Current Ratio
X 2 = Debt to Equity Ratio X 3 = Total Assets Turnover X 4 = Return On Assets e = error
3. RESULT AND DISCUSSION
3.1 Descriptive statistics
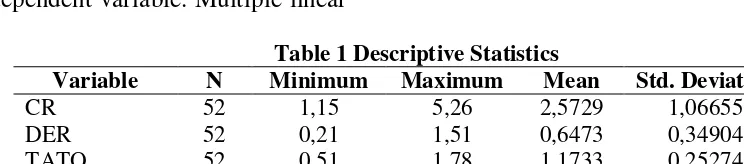
Descriptive statistics can give information about the minimum value, maximum value, average value and standard deviation of the values of the variable Current Ratio, Debt to Equity Ratio, Total Asset Turnover, Return On Assets and profit growth. Results from the descriptive statistics in this study are shown in the following table:
Table 1 Descriptive Statistics
Variable N Minimum Maximum Mean Std. Deviation
CR 52 1,15 5,26 2,5729 1,06655
DER 52 0,21 1,51 0,6473 0,34904
TATO 52 0,51 1,78 1,1733 0,25274
ROA 52 0,01 0,25 0,0913 0,04911
3.2 A Classic Assumption Test 3.2.1 Normality test
Table 2 The Results Of Normality Test
Variable Asymp. Sig.
(2-tailed)
Criteria Description
Unstandardize d Residual
0,903 >0,05 Data is
distributed normally Based on the table 2 above can
be explained the results of the normality test shows that data is distributed normally. It is indicated by the value of the
Unstandardized Residual has a value of sig > 0,05 (0,903 > 0,05 ) which means the data is distributed normally.
3.2.2 Multicollinearity Test
Table 3 The Results of Multicollinearity Test
Variable Tolerance criteria VIF Criteria Conclusion
CR 0,330 >0,10 3,035 <10 No Multicollinearity
DER 0,402 >0,10 2,490 <10 No Multicollinearity
TATO 0,882 >0,10 1,134 <10 No Multicollinearity
ROA 0,591 >0,10 1,692 <10 No Multicollinearity
Based on the results of a test for multicollinearity in the table 3 shows that all independent variables (Current Ratio, Debt to Equity Ratio, Total Assets Turnover, and Return On Assets) has a value of VIF < 10
and value tolerance > 0,01. So it can be inferred that the symptom does not occur multicollinearity between independent variable research.
3.2.3 Autocorrelation Test
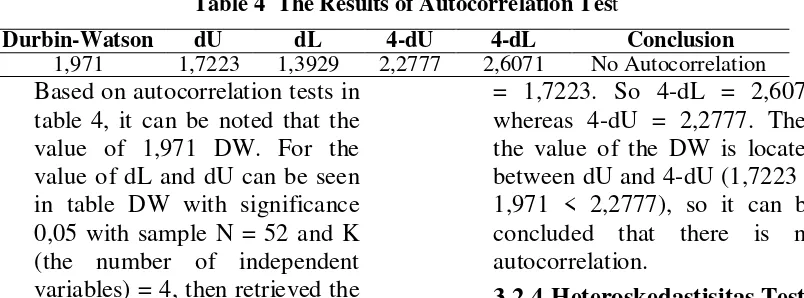
Table 4 The Results of Autocorrelation Test
Durbin-Watson dU dL 4-dU 4-dL Conclusion
1,971 1,7223 1,3929 2,2777 2,6071 No Autocorrelation
Based on autocorrelation tests in table 4, it can be noted that the value of 1,971 DW. For the value of dL and dU can be seen in table DW with significance 0,05 with sample N = 52 and K (the number of independent variables) = 4, then retrieved the value of the dL = 1,3929 and dU
= 1,7223. So 4-dL = 2,6071 whereas 4-dU = 2,2777. Then the value of the DW is located between dU and 4-dU (1,7223 < 1,971 < 2,2777), so it can be concluded that there is no autocorrelation.
3.2.4 Heteroskedastisitas Test
Table 5 The Results of Heteroskedastisitas Test
Variable Sig Criteria Conclusion
CR 0,771 >0,05 No heteroskedastisitas
DER 0,820 >0,05 No heteroskedastisitas
TATO 0,612 >0,05 No heteroskedastisitas
ROA 0,139 >0,05 No heteroskedastisitas
Based on table 5 shows that all independent variables (Current Ratio, Debt to Equity Ratio, Total Asset Turnover, Return
3.3 Multiple Linear regression analysis
Table 6 Multiple Linear Regression
Based on the results of testing of SPSS 17, then multiple linear regression equation in this research, i.e:
b. Coefficient regression Current Ratio has the value of -0,192. This means that if the variable Current Ratio rising by 1%, then
the profit growth will suffer a decrease of 19,2% or 0,192. c. Coefficients regression Debt to Assets Turnover has a value of -0,520. This means that if the variable Total Assets Turnover increase by 1%, then the profit growth will suffer a decrease of 52% or 0,520.
e. Coefficient regression Return On Assets value amounted to 3,257. This means that if the variable is Return On Assets increase by 1%, then the profit growth will increase amounted to 3,257 or 325,7%. significance value smaller than 0,05
(0,012 < 0,05). So it can be inferred that the regression model is feasible for use.
3.5 Hypothesis Test (t-test)
Table 8 The Results of t-test
Hypothesis Tcount ttable Sig Criteria Conclusion
H1 -2,696 -2,01174 0,010 <0,05 Accepted
H2 -1,065 -2,01174 0,292 <0,05 Rejected
H3 -2,832 -2,01174 0,007 <0,05 Accepted
H4 2,825 2,01174 0,007 <0,05 Accepted
The influence of Current Ratio against the growth of profit (H1)
Testing the hypothesis 1 has a purpose and that is to find out if the Current Ratio of influential variables or not against profit growth. Current Ratio tcount has a value of -2,696 and
The results of this research are consistent with research conducted by Wibisono & Triyonowati (2016) shows that the Current ratio effect significantly to profit growth.
The influence of Debt to Equity Ratio against the growth of profit (H2)
Hypothesis testing 2 has a purpose and that is to find out if the Debt to Equity Ratio variables are influential or not against profit growth. Debt to Equity Ratio has a value of tcount -1,065 and significance of 0,292. This means –tcount > -ttable (-1,065 >-2,01174) and the significance of 0,05 > (0,292 > 0,05), so that it can be concluded that Ho is accepted, which means that there is no influence of the variable Debt to Equity Ratio towards partially profit growth. The results of this research are consistent with research conducted by Djannah & Triyonowati (2017) , Gunawan & Wahyuni (2013) stating that the Debt to Equity Ratio has no effect against a significant profit growth.
This shows that capital owned companies were lower compared with the debt and the debt in its operational activities does not provide the maximum profit, so that the company still has to pay off mortgage debt-debt and the interest burden and the impact on earnings of the acquired company will be growth. Total Assets Turnover has a value of tcount -2,832 and significance of 0,007. This means –tcount < - ttable
(-2,832 <-2,01174) and its significance < 0,05 ( 0,007 < 0,05), so it can be inferred that the H3 is accepted, which means that there is an influence of the variable Total Assets Turnover against partially profit growth. The results of this research are consistent with research conducted by Gunawan & Wahyuni (2013), Susanti & Fuadati (2014) and Wibisono & Triyonowati (2016) stating that the total asset turnover effect significantly to profit growth. The Influence of Return On Assets against the growth of profit (H4)
3.6 Coefficient Determination (R2) Test
Table 9 The Results of Coefficient Determination (R2) Test
Model Adjusted R Square Conclusion
1 0,169 The dependent variable can be explained by
the independent variable of 16,9% Based on the test results of the
R2 in table 9, noted that the value of the Adjusted R Square of 0,169. This shows that the dependent variable (profit growth) can be explained of 16,9% by the independent variable (Current Ratio, Debt to Equity Ratio, Total Asset Turnover, Return On Assets). While 83,1% explained by other variables that do not exist in this research.
4. CONCLUSION
This research aims to examine and analyze the influence of Current Ratio (CR), Debt to Equity Ratio (DER), Total Assets Turnover (TATO), Return On Assets (ROA) of profit growth at the company's manufacturing sector industry goods consumption listed on the Indonesia stock exchange period 2014-2016. This research uses the entire population of the company’s manufacturing sector industry goods consumption that are listed on the Indonesia stock exchange period 2014-2016. While the sampling using sampling purposive way. Then the samples are used as many as 20 companies. This research tested using the help of software SPSS 17.
Based on the results of hypothesis testing 1 stating that the Current Ratio effect on profit growth supported by empirical evidence. For the hypothesis 3 and hypothesis 4 proposed in this research i.e. Total Assets Turnover and Return On Assets the effect on profit growth was also supported by empirical evidence. While hypotheses 2 stating that the Debt to Equity Ratio effect to profit
growth is not supported by empirical evidence.
For subsequent researchers suggested the company may add to the population and sample the research, and not just limited to the company’s manufacturing sector industry goods consumption only. For subsequent researchers should add variable research that could affect to profit growth, as Net Profit Margin, Return On Equity, Inventory Turnover, Debt to Asset Ratio.
5. REFERENCE
Djannah, R., & Triyonowati. (2017). Pengaruh Kinerja Keuangan Terhadap Pertumbuhan Laba Pada Perusahaan Food and Beverages. Jurnal Ilmu dan Riset
Manajemen Volume 6, Nomor 7.
Erawati, T., & Widayanto, I. J. (2016). Pengaruh Working Capital To Total Asset, Operating Income To Total Liabilities, Total Asset Turnover, Return On Asset, dan Return On Equity Terhadap Pertumbuhan Laba Pada Perusahaan Manufaktur Yang Tedaftar Di Bursa Efek Indonesia.
Jurnal Akuntansi Vol.4 No.2 .
Gunawan, A., & Wahyuni, S. F. (2013). Pengaruh Rasio Keuangan Terhadap Pertumbuhan Laba Pada Perusahaan Perdagangan di Indonesia. Jurnal Manajemen & Bisnis Vol 13 No.01 .
Kasmir. (2010). Pengantar Manajemen
Keuangan. Jakarta: Kencana
Sari, D. P., Paramu, H., & Utami, E. S. (2017). Analisis Pengaruh Rasio Keuangan dan Ukuran Aset Pada Pertumbuhan Laba Perusahaan Manufaktur yang Terdaftar Pada Bursa Efek Indonesia Periode 2010-2013. e-Journal Ekonomi Bisnis dan Akutansi ,2017,Volume IV (1) : 63-66.
Sugiyono. (2006). Metode Penelitian Administrasi Dilengkapi dengan
Metode R&D. Bandung:
CV.ALFABETA.
Sulistyowati, & Suryono, B. (2017). Analisis TATO, NPM, dan ROA Terhadap Pertumbuhan Laba Pada Perusahaan Food & Beverage. Jurnal Ilmu dan Riset Akuntansi Volume 6, Nomor 4.
Susanti, N. H., & Fuadati, S. R. (2014). Analisis Rasio Keuangan Untuk Memprediksi Pertumbuhan Laba Perusahaan Otomotif di BEI.
Jurnal Ilmu & Riset Manajemen Vol.3 No.5(2014).
Wibisono, S. A., & Triyonowati. (2016). Pengaruh Kinerja Keuangan Terhadap Pertumbuhan Laba Pada Perusahaan Otomotif di BEI. Jurnal Ilmu dan Riset Manajemen : Volume 5, Nomor 12.