©Universitas Bandar Lampung 2013
P.O Box 80200 Zip Code 21589 Jeddah-Kingdom of Saudi Arabia
1
(Received June 2013, Accepted November 2013)
Abstract:Current research works indicated that parts of Kingdom of Saudi Arabia have low to moderate seismic regions. For structural engineers, seismic load should be considered as important aspect that needs to be included in the building design. However Major part of buildings are designed for gravity loading only and poorly detailed to accommodate lateral loads. The purpose of this paper is to investigated gravity supporting building its resistance to expected seismic loading in different regions (Makkah, Jeddah, Gizan and Haql). In this paper, a test RC building that was designed for gravity loading only is investigated. This will be accomplished by performing the nonlinear static analysis (pushover analysis) according to ATC 40. Pushover analysis produces the pushover curves, capacity spectrum, plastic hinges and performance level of the building. This analysis gives better understanding seismic performance of buildings and also traces the progression of damage or failure. The building performance level is determined by intersection of demand and capacity curves and the hinge developed in the beams and the columns. The results show that the test building is found inadequate for Haql region and it still can be considered for Makkah, Jeddah and Gizan.
Keywords— seismic analysis; pushover; ATC 40; seismic zone; capacity spectrum several regions in the Kingdom necessitate the detailed consideration of seismic loads in the design of all buildings. Major part of building industry are designed for gravity loading only and poorly detailed to accommodate lateral loads. The existing buildings have to be provided by some rehabilitation to sustain the expected performance level. The capacity of the building should be
It is generally believe that the conventional elastic design analysis method cannot capture many important aspects that control the seismic performance of the building. The capacity of building to undergo inelastic deformations governs the structural behaviour of building during seismic ground motions. For that reason, the evaluation of building should be based the inelastic deformation demanded by seismic. On the other hand, linear elastic analysis does not provide information about real strength, ductility and energy dissipation [4].
Nonlinear dynamic analysis is principally correct approach. However, it is very complex and not practical for every design. It needs time history of ground motion data and detailed hysteretic behaviour of structural members which cannot be predicted. This analysis is appropriate for research and for design of important structures [7].
For estimating seismic demands for building, the structural engineering profession is now using the non-linear static procedure, known as pushover analysis. It is a commonly used technique, which is finding prominence in standards and guidance material. The term static implies that a static method is applied to represent a dynamic phenomenon [8].
Pushover analysis is a series of incremental static analysis carried out to develop a capacity curve for the building. Figure 1 illustrates pushover analysis. This procedure needs the execution of a nonlinear static analysis of structure that allows monitoring progressive yielding of the structure. The building is subjected a lateral load. The load magnitude increase until the building reaches target displacement. This target displacement is determined to represent the top displacement when the building is subjected to design level ground excitation.
International Journal of Engineering and Technology Development 73 Vol.1, No.3, December 2013, p. 72-77
Pushover analysis produces pushover curve or capacity curve that presents relationship between base shear (V) and roof displacement (∆). The Pushovercurve depends on strength and deformation capacities of the structure and describes how the structure behaves after the elastic limit.
Structural response to ground motion during earthquake cannot be accurately predicted due to the complexity of the structural properties and ground motion parameters. In pushover analysis, a set of lateral displacement is used directly as design condition. The displacement is an estimate of the maximum expected response of the structure during ground motion.
Once pushover analysis is defined, the performance level can be determined using demand displacement. The performance verifies the structure is adequate the acceptable limits of performance level.
Recently, there are some codes such as ATC-40, FEMA 256, FEMA 440 adopted standards and guidance materials regarding the assessment of existing structures. Some programs are also developed for pushover analysis and are listed: SAP2000, ETABS, and DRAIN-2DX. A. Capacity Spectrum
Building performance level can be determined by target displacement using capacity spectrum method (ATC 40). The capacity spectrum method allows for a graphical comparison between the structure capacity and the seismic demand. Pushover curve represents the lateral resisting capacity and response spectrum curve represents the seismic demand.
The capacity spectrum method, which is given in Figure 2, is started by producing force-displacement curve that consider inelastic condition. The result is then plotted to ADRS (Acceleration Displacement Response Spectrum). Demand is also converted into ADRS format so that capacity curve and demand curve are in the same format [1].
Fig. 2 Capacity Spectrum Method Note:
a. Pushover curve b. Demand spectrum c. ARDS format d. Final result
The performance point is obtained by superimposing demand spectrum on capacity curve into spectral
coordinate or ADRS format. The capacity spectrum method has been built in SAP2000 program
Performance levels of buildings are shown in table I
TABLE I. PERFORMANCE LEVEL OF BUILDING
B. Nonlinear Plastic Hinge
Pushover Analysis requires the development of the force-deformation curve for the critical section of beams and column by using the guideline [2]. Such a curve is presented in Figure 3
Fig. 3 Typical load-deformation relation and target performance level
Point A corresponds to the unloaded condition. Load deformation relation shall be described by linear response from A to an effective yield B. Then the stiffness reduce from point B to C. Point C has resistance equal to the nominal strength then sudden reduction in lateral load resistance to point D, the response at reduced resistance to E, final loss of resistance thereafter. The slope of line BC, ignoring effects of gravity effects of gravity loads acting through lateral displacement, is usually taken between 0 and 10% of the initial slope. Line CD corresponds to initial failure of the member. Line DE represents the residual strength of the member.
II. DESCRIPTIVE OF THE TEST BUILDIN rectangular 500/300 mm. Type of soil is soft class C according to Saudi Building Code 301.
Fig. 4 Structural Layout The structural system was designed fo gravity load only. Longitudinal bar in beams upwards at their end to resist negative moment gravity load. Strong lateral load can change t the end span of the beam. Therefore, the bottom end of the beam may be not adequate for Summary of modelling assumption is prese II.
TABLE II.MODELLING ASSUMP
III. PUSHOVER ANALYSIS In the present paper, Pushover analysis using SAP2000 program. A three dimensional structure has been created as shown in Figure 5.
UILDING d can change the moment at efore, the bottom steel at 356 rule, which is built in SAP 2000 with CP limit states for hinge rotation have acceptance criteria.
The pushover analysis is executed orthogonal directions to study the performa building in both directions. Gravity push, w for gravity load only, Push-X is the lateral direction starting at the end of gravity push, Y direction starting at the end of gravity
The pushover analysis is achieved displacement control strategy, where subjected the lateral load pattern displacement reach a target value. The of state used is 10 and the maximum is 100.
Pushover analysis is performed regions in KSA (Makkah, Jeddah, Gizan, Parameters Ca and Cv are taken from Code 301 to construct response spectrum in figure 6. stiffness and ductility. Under incrementall
for X and Y Direction modelled as nonlinear frame
International Journal of Engineering and Technology Development 75 Vol.1, No.3, December 2013, p. 72-77
lateral load, the structural element may be yield sequentially. At every step, the structure experience loss in stiffness. Therefore, slope of pushover curve gradually is decreasing.
The comparison of pushover curve in X and Y direction shows that the stiffness of frame is more in X direction as compared to Y direction. This is explained that Y-direction is the critical point.
Fig. 7 Pushover Curve
The performance point has been obtained by superimposing demand spectrum on capacity curve into spectral coordinate. Figure 8 shows capacity spectrum for Gizan region in X direction. It is obvious that the demand curve tend to intersect the capacity curve at the performance point. For Gizan, It can be concluded that there are sufficient strength and displacement reserves at this performance point.
Fig. 8 Capacity Spectrum
Table III summarizes the performance point of the structure for each region.
TABLE.III.PERFORMANCE POINT FOR EACH REGION
At every deformation step of pushover analysis determine plastic rotation hinge location in the elements and which hinges reach the FEMA limit state, which are IO, LS, and CP using colours for identification.
Plastic hinges formation have been obtained at different displacement levels or performance points. The hinging patterns for each region are plotted in figure 7.
Makkah
The element response is still not dangerous at this performance point. Yield occurs in some elements but none of them exceeds IO (Immediate Occupancy) level. The outer columns still behave in elastic range.
Jeddah
Most of elements are in yield condition. The damage of the building is still limited both in X and Y direction since yielding occurs at event B (yielding) to IO (Immediate Occupancy).
Gizan
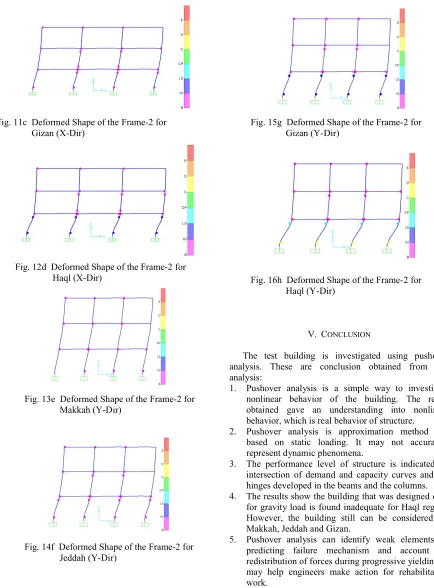
Although the element response is generally adequate at this performance point, the response is more severe in Y-direction. The yielding at the lower column occurs at event IO (Immediate Occupancy) to LS (Life Safety).
Haql
For X direction, the building is still adequate due to yielding occurs at even B to IO. However, the building is not adequate for Y direction due to the lower columns yield exceed C (Collapse) condition.
Fig. 9a Deformed Shape of the Frame-2 for Makkah ( X-Dir)
Fig. 11c Deformed Shape of the Frame-2 for Gizan (X-Dir)
Fig. 12d Deformed Shape of the Frame-2 for Haql (X-Dir)
Fig. 13e Deformed Shape of the Frame-2 for Makkah (Y-Dir)
Fig. 14f Deformed Shape of the Frame-2 for Jeddah (Y-Dir)
Fig. 15g Deformed Shape of the Frame-2 for Gizan (Y-Dir)
Fig. 16h Deformed Shape of the Frame-2 for Haql (Y-Dir)
V. CONCLUSION
The test building is investigated using pushover analysis. These are conclusion obtained from this analysis:
1. Pushover analysis is a simple way to investigate nonlinear behavior of the building. The result obtained gave an understanding into nonlinear behavior, which is real behavior of structure.
2. Pushover analysis is approximation method and based on static loading. It may not accurately represent dynamic phenomena.
3. The performance level of structure is indicated by intersection of demand and capacity curves and the hinges developed in the beams and the columns. 4. The results show the building that was designed only
for gravity load is found inadequate for Haql region. However, the building still can be considered for Makkah, Jeddah and Gizan.
International Journal of Engineering and Technology Development 77 Vol.1, No.3, December 2013, p. 72-77
REFERENCES
[1] Applied Technology Council, Seismic Evaluation and Retrofit of Reinforced Concrete buildings”, Report ATC 40 /, 1996.
[2] American Society of Civil Engineers, FEMA-356: Pre standard and Commentary for The Seismic Rehabilitation of Buildings, 2000.
[3] Attar, M. S, (2003). Evaluation of the Seismic Performance of A Typical School Building, Master Thesis, College of Engineering, KAAU.
[4] Abd-alla, Mohamed N, (2007). Application of Recent Techniques of Pushover for Evaluating Seismic Performance of Multistory Building. Faculty of Engineering, Cairo University.
[5] Chopra, A.K and Goel, R.K. (2004). A Modal Pushover Analysis Procedure to Estimate Seismic Demands for Unsymmetric-plan Buidings. Earthquake Engng Struct. Dyn. 33 :903–927 (DOI: 10.1002/eqe.380)
[6] Elnashai, A.S. (2001). Advanced inelastic static (pushover) analysis for earthquake applications. Structural Engineering and Mechanics, Vol 12, No. 1.
[7] Fajfar, P. (2002).Structural Analysis in Earthquake Engineering – Breakthrough of Simplified Nonlinear Methods. 12th European Conference on Earthquake Engineering,
[8] Giannopoulos, P.I. (2009). Seismic Assessment of RC Building according to FEMA 356 and Euro code 8, 16th Conference on Concrete, TEE, ETEK [9] Poluraju, P and Rao, N. (2011). Pushover Analysis
of reinforced concrete frame structure using SAP 2000. International Journal of Earth Science and Engineering, Vol. 04, No 6 SPL, pp. 684-690. [10] The Saudi Code National Building Committee, The
Saudi Building Code 301 Structural – Loading and Forces, 2007.