Neuronal–glial alterations in non-primary motor areas in chronic
subcortical stroke
Carmen M. Cirsteaa,c,d,*, Randolph J. Nudob,e, Sorin C. Craciunasa,1, Elena A. Popescua, In-Young Choia,d, Phil Leea,e, Hung-Wen Yehf, Cary R. Savageg, and William M. Brooksa,d
aHoglund Brain Imaging Center, University of Kansas Medical Center, USA
bLandon Center on Aging, University of Kansas Medical Center, USA
cDepartment of Physical Therapy and Rehabilitation Science, University of Kansas Medical
Center, USA
dDepartment of Neurology, University of Kansas Medical Center, USA
eDepartment of Molecular and Integrative Physiology, University of Kansas Medical Center, USA
fDepartment of Biostatistics, University of Kansas Medical Center, USA
gDepartment of Psychiatry and Behavioral Sciences, University of Kansas Medical Center, USA
Abstract
Whether functional changes of the non-primary motor areas, e.g., dorsal premotor (PMd) and supplementary motor (SMA) areas, after stroke, reflect reorganization phenomena or recruitment of a pre-existing motor network remains to be clarified. We hypothesized that cellular changes in these areas would be consistent with their involvement in post-stroke reorganization. Specifically, we expected that neuronal and glial compartments would be altered in radiologically normal-appearing, i.e., spared, PMd and SMA in patients with arm paresis. Twenty survivors of a single ischemic subcortical stroke and 16 age-matched healthy controls were included. At more than six months after stroke, metabolites related to neuronal and glial compartments: N-acetylaspartate, myo-inositol, and glutamate/glutamine, were quantified by proton magnetic resonance
spectroscopy in PMd and SMA in both injured (ipsilesional) and un-injured (contralesional) hemispheres. Correlations between metabolites were also calculated. Finally, relationships between metabolite concentrations and arm motor impairment (total and proximal Fugl-Meyer Upper Extremity, FMUE, scores) were analyzed. Compared to controls, stroke survivors showed significantly higher ipsilesional PMd myo-inositol and lower SMA N-acetylaspartate.
Significantly lower metabolite correlations were found between ipsilesional and contralesional SMA. Ipsilesional N-acetylaspartate was significantly related to proximal FMUE scores. This study provides evidence of abnormalities in metabolites, specific to neuronal and glial compartments, across spared non-primary motor areas. Ipsilesional alterations were related to proximal arm motor impairment. Our results suggest the involvement of these areas in post-stroke reorganization.
Keywords
1H-MRS; Neuronal and glial compartments; Non-primary motor areas; Subcortical stroke
© 2012 Elsevier B.V. All rights reserved.
*Corresponding author at: Hoglund Brain Imaging Center, University of Kansas Medical Center, 3901 Rainbow Blvd, Mail Stop 1052,
NIH Public Access
Author Manuscript
Brain Res
. Author manuscript; available in PMC 2013 April 15. Published in final edited form as:Brain Res. 2012 June 29; 1463: 75–84. doi:10.1016/j.brainres.2012.04.052.
NIH-PA Author Manuscript
NIH-PA Author Manuscript
1. Introduction
Whether non-primary motor areas, such as dorsal premotor cortex (PMd) and supplementary motor area (SMA), are important for restoring motor function after damage to primary motor cortex (M1) neurons or their axons, e.g., subcortical stroke, remains a topic of some debate. Several properties make these areas optimal to assume some M1 functions in the event of stroke: (i) their efferents project directly to the spinal cord (Dum and Strick, 1991; Hutchins et al., 1988; Nachev et al., 2008); (ii) they are heavily interconnected via the corpus callosum (Fang et al., 2008; Mochizuki et al., 2004); (iii) they are ipsilaterally interconnected with each other (Dum and Strick, 2005), as well as with M1 (Stepniewska et al., 1993); (iv) they contain a somato-topic organization that parallels the M1 organization (He et al., 1993; Wise et al., 1996); and (v) they contain neurons that can be modified with motor learning (Deiber et al., 1997; Perez et al., 2008; Wise et al., 1996). However, non-invasive functional brain imaging studies provide inconsistent results regarding their recruitment and recovery of the impaired arm.
In healthy individuals, although non-primary areas are involved to some extent in simple motor tasks, they are further recruited as complexity increases (Horenstein et al., 2009). After a subcortical stroke, there is generally more widespread, bilateral recruitment of the non-primary areas during movement of the impaired arm, regardless of the task complexity (Calautti and Baron, 2003). For example, increased ipsilesional (Carey et al., 2002; Fridman et al., 2004; Seitz et al., 1998) and contralesional (Gerloff et al., 2006; Johansen-Berg et al., 2002; Lotze et al., 2006) PMd activation, frequently associated with recovery, has been reported. Moreover, contralesional PMd activation is more prominent in patients with significant impairment (Johansen-Berg et al., 2002; Ward et al., 2006). However, one study failed to demonstrate a relationship between bilateral PMd recruitment and recovery (Calautti et al., 2007). The relationship between SMA activation and post-stroke recovery is also inconsistent (Calautti et al., 2007; Loubinoux et al., 2003; Riecker et al., 2010; Zemke et al., 2003). Finally, although functional connectivity between the ipsilesional non-primary areas was weaker in patients imagining and executing a motor task compared to controls (Sharma et al., 2009), altered connectivity during execution was not correlated with the motor impairment. Therefore, the exact function served by increased recruitment of non-primary areas after stroke remains to be clarified.
We hypothesized that if the increased recruitment of non-primary motor areas is an
expression of underlying cellular changes, this would be consistent with the involvement of these areas in post-stroke reorganization. Non-invasive proton magnetic resonance
spectroscopy (1H-MRS) provides insight into cellular changes through measurements of certain metabolites that are associated with specific cell types (Van Zijl and Barker, 1997). Studies in stroke commonly report low N-acetylaspartate (NAA), a marker of neuronal integrity (Siegel et al., 2005), in ipsilesional PMd (Kang et al., 2000; Kobayashi et al., 2001; Munoz Maniega et al., 2008). In some instances, NAA level relates to disability (Kobayashi et al., 2001). Although other 1H-MRS-visible metabolites might be informative, as we recently reported in M1 (Cirstea et al., 2011), no such studies have been reported on PMd or SMA.
Therefore, the first goal of the present study was to characterize neuronal and glial compartments in hand representation of PMd and SMA, identified by functional MRI, in chronic subcortical stroke. We used 1H-MRS imaging (1H-MRSI) to quantify concentrations of metabolites related to these compartments, i.e., NAA, myo-inositol (mI, a putative glial cell marker), and glutamate/glutamine (Glx, reflective of neuronal–glial neurotransmission system). As the neuronal integrity might be compromised in these regions remote from the
NIH-PA Author Manuscript
NIH-PA Author Manuscript
site of a focal brain damage, e.g., through neuronal death and/or diaschisis (Chu et al., 2002; Cirstea et al., 2011; Giehl and Tetzlaff, 1996; Lu et al., 2001), we expected NAA to be decreased, especially in the ipsilesional areas. Since mI provides insights into the role of glia in plastic brain changes (Henneberger et al., 2010; Rango et al., 2008; Shibuya, 2009), we expected mI to be increased. Possible changes in Glx could be expected in both ipsi- and contralesional motor areas based on the theory of altered intra-cortical excitability after stroke (Liepert et al., 2000; Manganotti et al., 2002; Swayne et al., 2008; Tarkka et al., 2008). We also explored correlations between metabolite concentrations and arm motor impairment. Since previous anatomical and physiological studies showed a predominant representation of the proximal muscles in these areas (Boudrias et al., 2010a; Boudrias et al., 2010b; Dum and Strick, 1991; He et al., 1995), we also evaluated clinical correlations with the proximal arm motor impairment.
Based on our previous evidence of “metabolic coupling” in M1 (Cirstea et al., 2011), and the anatomical and functional connectivity between PMd and SMA, our second goal was to identify evidence of “metabolic coupling” between non-primary motor areas. Further, we determined whether this coupling was altered following stroke.
2. Results
2.1. Participants
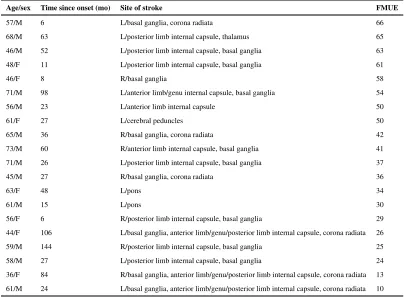
Stroke participants had sustained a single cerebral infarction 44.6±37.8 (mean±SD) months prior to study leading to arm motor impairment (40.7±17.1 on FMUE). The location of cerebral infarction was determined from the T1-weighted MRI (Mai et al., 2008) (Table 1). Seventeen patients had experienced infarcts involving the striato-capsular area. Of these, six were found to have involvement of the anterior limb/genu of the internal capsule and six had striato-capsular infarctions extending to the corona radiata. In addition, two had pontine infarctions, and one had infarction of the posterior cerebral artery territory involving the cerebral peduncles.
Since most patients (65%) suffered left-sided infarcts, we compared ipsilesional metabolites in stroke survivors with left-sided metabolites in controls. Stroke and control groups did not differ statistically with respect to sex (65% vs. 63% male), age (57.3±10.3 vs. 49.4±14.7 years, p>0.05), or education (13.6±2.0 vs. 14.7±3.2 years, p>0.05).
2.2. Spectroscopic voxel location
Although larger PMd and SMA activations were found in stroke compared with control participants (ipsilesional vs. left, PMd, 9.3±9.1% vs. 2.7 ±3.5%, p=0.04; SMA, 21.5±16.2% vs. 2.4±1.8%, p=0.002; contralesional vs. right, PMd, 3.6 ± 4.3% vs. 0.6±0.8%, p=0.04; SMA, 10.1 ±8.6% vs. 1.2 ±0.9%, p=0.006), the anatomic locations of spectroscopic voxels were similar in both groups. Typical examples of voxel location and 1H-MRS spectra for the two examined regions are shown in Fig. 1.
1H-MRS spectra with good signal-to-noise ratios were obtained consistently from both
control and stroke participants. Similar percentages of brain tissue within spectroscopic voxels were found in each group. However, the brain tissue fraction in ipsilesional SMA was slightly higher in stroke survivors (81.3±4.4% vs. 77.6±4.3%, p=0.02).
2.3. Metabolite concentrations
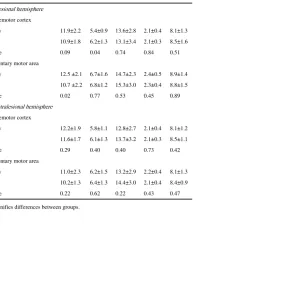
In controls, similar metabolite concentrations of NAA, mI, and Glx were found in both left and right PMd or left and right SMA (Table 2).
NIH-PA Author Manuscript
NIH-PA Author Manuscript
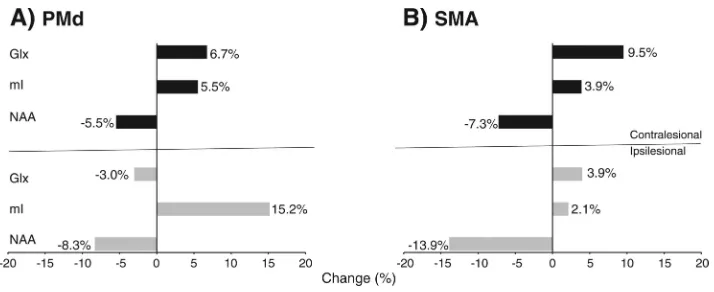
NAA values were generally lower in stroke than controls in all regions although reaching statistical significance only in the ipsilesional SMA (Table 2). We also found significantly higher mI in ipsilesional PMd. We illustrate the magnitude of these differences in Fig. 2, which shows a 13.9% decrease in SMA NAA and a 15.2% increase in PMd mI. Between-group differences in NAA in PMd (F1,72=4.1, p=0.04) and SMA (F1,72=7.2, p=0.009) and mI in PMd (F1,72=4.3, p=0.04) were greater in the ipsilesional compared to contralesional hemisphere. There were no significant alterations in Glx concentrations in either PMd or SMA.
Significant correlations were found between ipsilesional NAA and proximal FMUE sub-scores (PMd, r=0.54, p=0.01; SMA, r=0.51, p=0.02). Although the correlations between ipsilesional NAA and total FMUE score were of moderate strength (PMd, r=0.38, p=0.1; SMA, r=0.39, p=0.08), they did not reach statistical significance.
2.4. Metabolite correlations
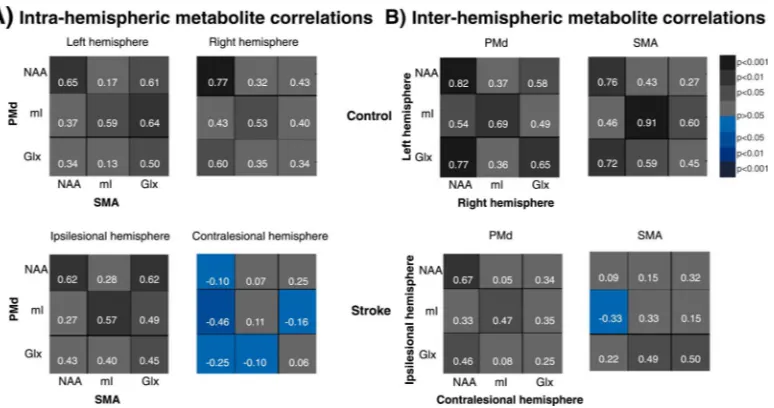
We illustrate the correlational patterns in Fig. 3 where the color-coding (and numeric data) indicates the strength/sign of each metabolite pair correlation (Pearson's correlation). The overall intra- and inter-hemispheric correlations (canonical correlation) within each group are shown in Table 3.
2.5. Intra-hemispheric correlations
Correlation coefficients (Pearson) between individual metabolite pairs ranged from 0.13 to 0.65 in the left, and from 0.32 to 0.77 in the right hemisphere in controls (Fig. 3A). Strong and significant correlations were found between NAAPMd and NAASMA and between mIPMd and mISMA in each hemisphere. In the left hemisphere, significant correlations were also found between GlxSMA and all PMd metabolites. In the right hemisphere, NAASMA and GlxPMd were also significantly correlated. Canonical correlation analysis revealed high and significant overall correlations between PMd and SMA in each hemisphere (Table 3). There were no significant differences between left and right PMd–SMA overall correlations (p=0.5).
In stroke survivors, the correlations ranged from 0.27 to 0.62 in the ipsilesional, and from – 0.46 to 0.25 in the contralesional hemisphere (Fig. 3A). While ipsilesional significant metabolite pair correlations were similar to those in the left hemisphere in controls, all contralesional correlations were markedly lower than those in right hemisphere. Indeed, in five out of nine metabolite pairs, the sign of the correlation had become negative. For example, the lowest correlations were found between NAASMA and all PMd metabolites (NAA–NAA, r=–0.10 vs. r=0.77; NAA–mI, r=–0.46 vs. r=0.43; NAA–Glx, r=–0.25 vs. r=0.60). High and significant PMd–SMA overall correlations were found in the ipsilesional hemisphere while low and non-significant overall correlations were reported in the
contralesional hemisphere (Table 3). However, similar overall correlations were found in either hemisphere (p=0.3). Compared to controls, the overall correlations were lower, but the differences did not reach statistical significance (Table 3).
2.6. Inter-hemispheric correlations
In controls, metabolite correlations between left and right PMd ranged from 0.36 to 0.82 (six out of nine were significant; Fig. 3B). In SMA, the correlations ranged from 0.27 to 0.91 (five significant). High and significant overall inter-hemispheric correlations were found in PMd and SMA (Table 3) and there was no significant difference between these correlations (p=0.2).
NIH-PA Author Manuscript
NIH-PA Author Manuscript
In stroke survivors, although most correlations were lower (Fig. 3B) in both PMd
(range=0.05 to 0.67) or SMA (range=–0.33 to 0.50), the magnitude of differences appeared greater in SMA, particularly contralesional NAA and ipsilesional metabolites (NAA–NAA, r=0.09 vs. r=0.76; NAA–mI, r=–0.33 vs. r=0.46; NAA–Glx, r=0.22 vs. r=0.72). Overall inter-hemispheric correlations between metabolites in each of PMd and SMA were lower and non-significant in stroke survivors (Table 3). Overall correlations were similar in PMd and SMA (p=0.7). Compared to controls, overall SMA metabolite correlations were significantly lower (Table 3).
3. Discussion
The first finding of the current study was that concentrations of metabolites related to neurons and glia were altered in spared non-primary motor areas in the chronic stage of sub-cortical stroke. The lower NAA and higher mI found in the ipsilesional hemisphere are of similar magnitude to spectroscopic findings previously reported in other central nervous system pathologies. Most studies of normal-appearing tissue report lower NAA ranging from 4.6% to 30.0%, e.g., systemic lupus erythematosus (by 15.9%, Sabet et al., 1998), multiple sclerosis (4.8%, Chard et al., 2002; 30.0%, Aboul-Enein et al., 2010; 4.6%, Suhy et al., 2000; 12.3%, Sastre-Garriga et al., 2005), and traumatic brain injury (16.1%, Capizzano et al., 2010; 12.9%, Garnett et al., 2000). Higher mI, ranging from 10.8% to 14.4% has been also reported in patients with multiple sclerosis (by 10.8%, Chard et al., 2002; 14.4%, Sastre-Garriga et al., 2005) and Alzheimer's disease (11.1%, Watanabe et al., 2010). Consequently, we consider the differences in NAA and mI reported in our patients to be robust compared to controls.
Possible explanations of altered NAA and mI concentrations include neuronal death or neuronal metabolic depression (Siegel et al., 2005). Although retrograde degeneration is a possible source of neuronal death, animal studies suggest that retrograde degeneration is limited above the lesion (Wannier et al., 2005) and few human data exist (Liang et al., 2008). Alternatively, apoptotic cell death of injured corticospinal neurons has been reported after subcortical injury, e.g., axotomy (Giehl and Tetzlaff, 1996; Lu et al., 2001). However, significant neuronal loss would likely result in decreased cortical volume, which is
inconsistent with our results. Accordingly, appreciable neuronal death seems unlikely. An alternative explanation for altered metabolites is neuronal metabolic depression. Since NAA and mI changes were remote from the site of infarction, diaschisis is possible (Chu et al., 2002; Cirstea et al., 2011; Seitz et al., 1999). Indeed, descending axons from non-primary and primary motor areas converge as they approach the internal capsule (Morecraft et al., 2002) and subcortical strokes are more likely to involve both primary and non-primary motor pathways. Although the majority of non-primary efferents course through the anterior limb and genu of the internal capsule (Fries et al., 1993), those efferents relevant for arm recovery per se appear to course more posteriorly through the posterior limb of the internal capsule (Shelton and Reding, 2001; Werring et al., 1998). Indeed, the posterior limb of the internal capsule was involved in 50% of patients and the anterior limb in 30%. Therefore, our areas contain neurons whose axons are “injured” and it is possible that the events occurring in these neurons are similar to those classically associated with diaschisis. Diaschisis has been reported weeks to months after stroke (Chu et al., 2002; Seitz et al., 1999). However, our data suggest that diaschisis might persist considerably longer, i.e., up to 12 years after injury. In addition, the relationship between ipsilesional NAA and clinical severity provides further support for NAA as a marker of post-stroke reorganization in these areas.
Although glutamate, a major component of Glx, is of interest in light of enhanced motor cortical excitability after stroke (Hummel et al., 2009; Liepert et al., 2000; Manganotti et al.,
NIH-PA Author Manuscript
NIH-PA Author Manuscript
2002; Swayne et al., 2008; Tarkka et al., 2008), Glx concentrations were not significantly altered in non-primary areas. However, since glutamate and glutamine can change
independently, further studies are needed to determine whether the changes in Glx are due to glutamate, glutamine, or both.
The second finding was that of altered metabolite correlations between non-primary motor areas. Normal coordinated movement requires that motor areas in both hemispheres interact and cooperate. We found high and significant overall metabolite correlations (see Table 3) between non-primary motor areas, i.e., “metabolic coupling”, supporting the role of neuronal–glial interactions in neuronal function (Siegel et al., 2005). Our finding of weaker correlations between metabolites in secondary areas after stroke suggests a disturbance of this metabolic coupling. We speculate that lower ipsilesional NAA indicating fewer fully functioning neurons, would contribute to altered neuron–neuron “communication” between ipsilesional and their homologous contralateral areas. For example, NAA was ~14% lower in the ipsilesional SMA and, as suspected, the NAA–NAA correlation coefficient between ipsi- and contralesional SMA was markedly lower than in healthy participants (r=0.09 vs. r=0.76). However, although many aspects of this coupling remain to be elucidated, these findings may provide new insights into brain reorganization. Nonetheless, since this is the first documentation of altered metabolic coupling after stroke, our interpretation remains cautious.
Our study has some limitations that might affect its generalizability. Our focus on
subcortical infarcts provides statistical power by minimizing patient variance, but limits our ability to explore the effects of infarct location on metabolites (e.g., subcortical vs. cortical). Another limitation is the time after injury (6 to 144 months) that might have contributed to the spread of metabolite concentrations. Although no data regarding the long-term evolution of metabolites in remote areas have been reported, we chose this time frame to avoid the likely change in more acute phases. Another possible confounding effect is carotid stenosis. Although effects of cerebral blood flow alterations on NAA (and choline, lactate) have been noted (Hattingen et al., 2009; van der Grond et al., 1995, 1996; Walker et al., 2006), we found similar concentrations of choline in each group (see Table 2) and lactate was not detectable in either group (Cramer–Rao lower bonds>45), suggesting that stenosis is not a factor. Although our fMRI task activates a large network (e.g., contralateral sensorimotor cortex and bilateral M1, PMd, SMA, cingulate motor areas, inferior parietal cortex and intraparietal sulcus, insula cortex, cerebellar vermis, and both inferior and superior cerebellar hemispheres), we focused on areas considered as crucial during learning and recovery of function after brain damage. We have previously described M1 metabolite changes after sub-cortical stroke (Cirstea et al., 2011), and it is likely that plasticity, including metabolite changes, occurs elsewhere within the network, i.e., PMd, SMA. However, future studies are required to determine the relative contributions of different sites of plasticity and the conditions in which they apply differentially.
These results support and unify some of the seemingly contradictory observations when considering two major points. First, they show altered neuronal and glial metabolism in structurally intact non-primary motor areas, which exhibit functional changes that are related to clinical severity after stroke. Second, although the present results do not provide
information regarding the specific role, i.e., beneficial or detrimental, of the metabolic changes in non-primary motor areas, they suggest that these areas underlie functional reorganization rather than excess recruitment. Pinpointing these mechanisms would greatly assist in design therapeutic approaches aimed to enhance and accelerate the recovery processes.
NIH-PA Author Manuscript
NIH-PA Author Manuscript
4. Experimental procedures
4.1. Participants
Twenty stroke survivors and 16 healthy controls (all right-handed and without
contraindications to MRI) gave written informed consent. The study was carried out under approval of the University of Kansas Medical Center Human Subjects Committee (IRB).
Stroke survivors met the following inclusion criteria: single ischemic subcortical stroke at least six months prior to participation, radiologically-normal appearing cortical motor areas in both hemispheres based on T2-weighted magnetic resonance imaging (MRI), and ability to perform a handgrip task with the affected arm Meyer Upper Extremity Scale (Fugl-Meyer et al., 1975) or FMUE≥10). Exclusion criteria were: chronic/degenerative disease predating the stroke and affecting the central nervous system (from review of the medical record), receptive aphasia (as evaluated by Token test), visual attention deficits (Cancelation test), and apraxia (clinical observation of the use of scissors to cut paper and making coffee). Stroke survivors were on anti-hypertensive (95%), cholesterol-lowering (45%) and/or antiplatelet (45%) therapy, but were not receiving inpatient or outpatient treatment.
Age- and sex-matched healthy individuals, without neurological and psychiatric disorder and with normal T2-weighted images, served as controls.
4.2. Experimental protocol
MRI data were acquired on a 3 T MR system (Allegra, Siemens, Erlangen, Germany). During scanning, participants’ heads were immobilized with head cushions and instructed not to move. The participants received visual instructions through optical-fiber magnet-compatible goggles (Resonance Technology). A detailed description of the experimental protocol has been reported previously (Cirstea et al., 2011). Briefly, an axial dual-echo proton density/T2-weighted MRI (TR=4800 ms; TE1/TE2=18/106 ms; FOV=240 mm; matrix=256×256; slice thickness=5 mm, no gap) was acquired to confirm the presence of a single ischemic lesion sparing cortical motor areas. A whole-brain 3-dimensional T1-weighted MRI (MPRAGE; TR=2300 ms; TE=3 ms; FOV=240 mm; matrix=256×256; resolution=1×1×1 mm3) was acquired to estimate brain tissue fraction in spectroscopic voxels. A gradient echo blood oxygen level-dependent (BOLD) scan (TR=2000 ms; TE=50 ms; FOV=240 mm; matrix=64×64; slice thickness=5 mm; 0 skip; resolution=5×5 mm2; 100 time points) was acquired for impaired hand (dominant for controls) to identify the hand representation within our regions of interest (ROI), PMd and SMA, in each hemisphere. For the BOLD scan, two alternating conditions were repeated (3 min 28 s): movement condition (20 s), where participants performed a handgrip task, and rest condition (20 s), where participants were resting motionless. During the movement condition, a target pressure (25% of handgrip maximal voluntary contraction) was displayed graphically as a vertical bar through the goggles. A sign “MOVE” displayed on the screen for 2 s, at every 4 s, indicated the required rate of handgrip. Participants did a single handgrip after each sign “MOVE” until the column representing the applied pressure reached the target on the screen at which point the grip was released. Participants were asked specifically to attend to this continuous feedback. We selected this task to broaden patient recruitment, since handgrip returns earlier than finger movements (Heller et al., 1987).
After the BOLD acquisition was completed, the data were analyzed using the scanner analysis software to guide the spectroscopic imaging (1H-MRSI) slab positioning. Specifically, the slices corresponding to non-primary motor area activation were used to select the corresponding coincident T2-weighted image upon which the 1H-MRSI slab was centered. Eight outer voxel suppression bands (thickness=30 mm) were prescribed around the 1H-MRSI slab to minimize scalp lipid artifact. 1H-MRSI was acquired using the
point-NIH-PA Author Manuscript
NIH-PA Author Manuscript
resolved spectroscopy sequence (PRESS; TE=30 ms; TR=1500 ms; matrix=16×16; FOV=160 mm2; thickness=15 mm; resolution=5×5 mm2; spectral width=1200 Hz). Automated, followed by manual, shimming was performed to achieve an optimal full-width at half maximum of <20 Hz of the water signal from the entire excitation volume. The total scan duration was about 45 min.
Analysis methods have been detailed previously (Cirstea et al., 2011) and consisted in analysis of BOLD data (using Brain Voyager software, Brain Innovation B.V., Maastricht, Netherlands), 1H-MRSI data (LCModel; (Provencher, 2001), linear combination of model spectra using a basis set included in the package and using a radio-frequency coil loading factor), and T1-weighted images (brain segmentation, SPM2, Welcome Department of Cognitive Neurology, London, UK). For BOLD data analysis, motion correction was performed by a rigid body transformation, estimating six parameters, three translational and three rotational. These parameters were inspected for head movement. None of the
participants moved their head more than 2 mm in any direction. Then, 3D spatial smoothing with a 4 mm Gaussian filter was used to permit valid statistical inference according to the Gaussian random field theory. The time series in each voxel was high-pass filtered at 0.01 Hz to remove low frequency confounds. Movement and rest periods were modeled by a boxcar function with hemodynamic response modification (predictor movement) and the general linear model was used to extract foci of activation and create a hand representation mask in our ROIs (cluster threshold=100 voxels and pBonferroni=0.01). We used spatial extent of brain activation to identify the relevant regions of PMd and SMA for motor output. First, we outlined bilateral ROIs on the background T1 image without knowledge of the activation patterns, using standard sulcal and gyral landmarks identified from a
3-dimensional anatomy atlas (Constable et al., 1998): PMd, on the anterior half of precentral gyrus; SMA, on the medial wall of the hemisphere from the top of the brain to the depth of the cingulated sulcus, between a posterior boundary, halfway between the extension of the central and precentral sulci onto the medial surface, and an anterior boundary, a vertical line trough the anterior commissure. Then, we counted the activated voxels in the ROI using pBonferroni=0.01. The ratio (expressed as a %) between the number of activated voxels and the total number of voxels in the ROI represents the spatial extent of activation.
Using custom-designed software (written in Matlab v7.1), we overlaid the hand representation mask images, quantitative spectroscopic output (from LCModel), and segmented T1-weighted images. This graphical interface was used to display spectra and to obtain metabolite concentrations and brain tissue fraction from selected spectroscopic voxels corresponding to hand representation in our ROIs (Fig. 1). In each ROI, we chose three spectroscopic voxels with the following characteristics: gray matter>75%, a signal-to-noise ratio>10, and Cramer–Rao lower bounds<20%. Metabolite concentrations were corrected for voxel brain tissue fraction (FB) as follows: c=cLCModel/FB, where c is corrected concentration and cLCModel is the institutional unit from LCModel output. Since a priori hypothesis is to describe neuronal–glial alterations, we elected to analyze NAA, mI, Glx (target metabolites), although two additional metabolites (choline, Cho; creatine, Cr) have also been quantified (other metabolites, see Table 2). This is based on the little or no direct role of choline and creatine in neuronal–glial interactions. We converted the corrected concentration into molar concentrations (millimoles per kilogram wet weight brain tissue) (Cirstea et al., 2011) by using a calibration factor obtained by matching the mean NAA concentration in our controls to the mean gray matter NAA concentration previously reported in healthy human brain (Hetherington et al., 1996; Inglese et al., 2008; Wang and Li, 1998).
In the stroke group, we used the FMUE scale to evaluate arm motor impairment (total FMUE, normal=66). In a sub-analysis, we selected the FMUE components specifically
NIH-PA Author Manuscript
NIH-PA Author Manuscript
dealing with proximal movements, including active shoulder and elbow movements in and out of synergy (proximal FMUE, normal=30).
4.3. Statistical analysis
We focused on three target metabolites (NAA, mI, Glx) measured in two ROIs (PMd, SMA) and in two hemispheres (left, right) in each group (control, stroke). We used one clinical outcome (total and proximal FMUE scores) in the stroke group. Means and standard deviations were computed for each metabolite. In addition, for each metabolite, between-group differences in mean concentrations were expressed as percent change of the control group (see Fig. 2). Specifically, we computed the percent change as follows:
Stroke and control groups were compared for each metabolite in each ROI by using independent sample t-test (2-tails). To compare the between-group differences in
metabolites between hemispheres, we used mixed effects ANOVA models (with factors of Group, Hemisphere, Group×Hemisphere) for each metabolite and each ROI.
In the stroke group, Spearman rank order correlation was used to quantify the correlations between metabolite concentrations and FMUE scores.
In each group, we used Pearson's correlation to examine metabolite relationships between ROIs within each hemisphere (intra-hemispheric) and between hemispheres within each ROI (inter-hemispheric). As detailed previously (Sharma et al., 2011), the correlation coefficients were coded based on p-values: p<0.001 (r=1–0.76 for healthy; 1–0.71 for stroke), 0.001≤p<0.01 (r=0.75–0.62; 0.70–0.56), 0.01≤p<0.05 (r=0.61–0.50; 0.55–0.44), and p>0.05 (r<0.50; 0.43). Similar categories were used for the negative correlations. The correlation coefficients were then transformed into gray (for positive values) and blue (for negative) colors for visualization of metabolite correlations (see Fig. 3). Then, to assess the overall correlations of each correlation matrix (3 metabolites×3 metabolites), we carried out canonical correlation analyses and reported the canonical correlations for the first pair of canonical variables. We then compared intra- and inter-hemispheric canonical correlations within each group and between groups using non-parametric bootstrapping (Efron and Tibshirani, 1994). Significant differences were considered at p<0.05 (SPSS 18.0, SPSS Inc. Chicago, IL, except the mixed-effects ANOVA and canonical correlation analyses which were performed on SAS 9.2, SAS Inc. Cary, NC).
Acknowledgments
This work was supported by Natural Sciences and Engineering Research Council of Canada (CMC) and American Heart Association (0860041Z to CMC; 0655759Z to WMB). The Hoglund Brain Imaging Center is supported by a generous gift from Forrest and Sally Hoglund and funding from the National Institutes of Health (P30 HD002528, S10 RR29577, UL1 RR033179, and P30 AG035982). Dr. Brooks is also supported in part by P30 AG035982, R01 AG033673, R01 DK080090, R01 DK085605, and UL1 RR033179. Dr. Nudo is supported in part by R37 NS030853. The content is solely the responsibility of the authors and does not necessarily represent the official views of the funding agencies.
Abbreviations
NAA N-acetylaspartate
mI myo-inositol
Glx glutamate+glutamine
NIH-PA Author Manuscript
NIH-PA Author Manuscript
PMd dorsal premotor cortex
SMA supplementary motor area
M1 primary motor cortex
FMUE Fugl-Meyer Upper Extremity test
REFERENCES
Aboul-Enein F, Krssak M, Hoftberger R, Prayer D, Kristoferitsch W. Reduced NAA-levels in the NAWM of patients with MS is a feature of progression. A study with quantitative magnetic resonance spectroscopy at 3 Tesla. PLoS One. 2010; 5:e11625. [PubMed: 20652023] Boudrias MH, Lee SP, Svojanovsky S, Cheney PD. Forelimb muscle representations and output
properties of motor areas in the mesial wall of rhesus macaques. Cereb. Cortex. 2010a; 20:704–719. [PubMed: 19633176]
Boudrias MH, McPherson RL, Frost SB, Cheney PD. Output properties and organization of the forelimb representation of motor areas on the lateral aspect of the hemisphere in rhesus macaques. Cereb. Cortex. 2010b; 20:169–186. [PubMed: 19561063]
Calautti C, Baron JC. Functional neuroimaging studies of motor recovery after stroke in adults: a review. Stroke. 2003; 34:1553–1566. [PubMed: 12738893]
Calautti C, Naccarato M, Jones PS, Sharma N, Day DD, Carpenter AT, Bullmore ET, Warburton EA, Baron JC. The relationship between motor deficit and hemisphere activation balance after stroke: a 3T fMRI study. Neuroimage. 2007; 34:322–331. [PubMed: 17045490]
Capizzano AA, Jorge RE, Robinson RG. Limbic metabolic abnormalities in remote traumatic brain injury and correlation with psychiatric morbidity and social functioning. J. Neuropsychiatry Clin. Neurosci. 2010; 22:370–377. [PubMed: 21037120]
Carey JR, Kimberley TJ, Lewis SM, Auerbach EJ, Dorsey L, Rundquist P, Ugurbil K. Analysis of fMRI and finger tracking training in subjects with chronic stroke. Brain. 2002; 125:773–788. [PubMed: 11912111]
Chard DT, Griffin CM, McLean MA, Kapeller P, Kapoor R, Thompson AJ, Miller DH. Brain metabolite changes in cortical grey and normal-appearing white matter in clinically early relapsing– remitting multiple sclerosis. Brain. 2002; 125:2342–2352. [PubMed: 12244090]
Chu WJ, Mason GF, Pan JW, Hetherington HP, Liu HG, San Pedro EC, Mountz JM. Regional cerebral blood flow and magnetic resonance spectroscopic imaging findings in diaschisis from stroke. Stroke. 2002; 33:1243–1248. [PubMed: 11988598]
Cirstea MC, Brooks WM, Craciunas SC, Popescu AE, Choi I, Lee S, Bani-Ahmed A, Yeh H, Savage CR, Cohen LG, Nudo RJ. Primary motor cortex — a functional MRI-guided proton magnetic resonance spectroscopic study. Stroke. 2011; 42:1004–1009. [PubMed: 21330627]
Constable RT, Skudlarski P, Mencl E, Pugh KR, Fulbright RK, Lacadie C, Shaywitz SE, Shaywitz BA. Quantifying and comparing region-of-interest activation patterns in functional brain MR imaging: methodology considerations. Magn. Reson. Imaging. 1998; 16:289–300. [PubMed: 9621970]
Deiber MP, Wise SP, Honda M, Catalan MJ, Grafman J, Hallett M. Frontal and parietal networks for conditional motor learning: a positron emission tomography study. J. Neurophysiol. 1997; 78:977– 991. [PubMed: 9307128]
Dum RP, Strick PL. The origin of corticospinal projections from the premotor areas in the frontal lobe. J. Neurosci. 1991; 11:667–689. [PubMed: 1705965]
Dum RP, Strick PL. Frontal lobe inputs to the digit representations of the motor areas on the lateral surface of the hemisphere. J. Neurosci. 2005; 25:1375–1386. [PubMed: 15703391]
Efron, B.; Tibshirani, RJ. An Introduction to the Bootstrap. 1st edition. CRC Press; Boca Raton, FL: 1994.
NIH-PA Author Manuscript
NIH-PA Author Manuscript
Fang PC, Stepniewska I, Kaas JH. Corpus callosum connections of subdivisions of motor and premotor cortex, and frontal eye field in a prosimian primate, Otolemur garnetti. J. Comp. Neurol. 2008; 508:565–578. [PubMed: 18383053]
Fridman EA, Hanakawa T, Chung M, Hummel F, Leiguarda RC, Cohen LG. Reorganization of the human ipsilesional premotor cortex after stroke. Brain. 2004; 127:747–758. [PubMed: 14749291] Fries W, Danek A, Scheidtmann K, Hamburger C. Motor recovery following capsular stroke. Role of
descending pathways from multiple motor areas. Brain. 1993; 116(Pt 2):369–382. [PubMed: 8461971]
Fugl-Meyer AR, Jaasko L, Leyman I, Olsson S, Steglind S. The post-stroke hemiplegic patient. 1. A method for evaluation of physical performance. Scand. J. Rehabil. Med. 1975; 7:13–31. [PubMed: 1135616]
Garnett MR, Blamire AM, Rajagopalan B, Styles P, Cadoux-Hudson TA. Evidence for cellular damage in normal-appearing white matter correlates with injury severity in patients following traumatic brain injury: a magnetic resonance spectroscopy study. Brain. 2000; 123(Pt 7):1403– 1409. [PubMed: 10869052]
Gerloff C, Bushara K, Sailer A, Wassermann EM, Chen R, Matsuoka T, Waldvogel D, Wittenberg GF, Ishii K, Cohen LG, Hallett M. Multimodal imaging of brain reorganization in motor areas of the contralesional hemisphere of well recovered patients after capsular stroke. Brain. 2006; 129:791– 808. [PubMed: 16364955]
Giehl KM, Tetzlaff W. BDNF and NT-3, but not NGF, prevent axotomy-induced death of rat corticospinal neurons in vivo. Eur. J. Neurosci. 1996; 8:1167–1175. [PubMed: 8752586] Hattingen E, Lanfermann H, Menon S, Neumann-Haefelin T, de Rochement RD, Stamelou M,
Hoglinger GU, Magerkurth J, Pilatus U. Combined 1H and 31P MR spectroscopic imaging: impaired energy metabolism in severe carotid stenosis and changes upon treatment. MAGMA. 2009; 22:43–52. [PubMed: 18855032]
He SQ, Dum RP, Strick PL. Topographic organization of corticospinal projections from the frontal lobe: motor areas on the lateral surface of the hemisphere. J. Neurosci. 1993; 13:952–980. [PubMed: 7680069]
He SQ, Dum RP, Strick PL. Topographic organization of corticospinal projections from the frontal lobe: motor areas on the medial surface of the hemisphere. J. Neurosci. 1995; 15:3284–3306. [PubMed: 7538558]
Heller A, Wade DT, Wood VA, Sunderland A, Hewer RL, Ward E. Arm function after stroke: measurement and recovery over the first three months. J. Neurol. Neurosurg. Psychiatry. 1987; 50:714–719. [PubMed: 3612152]
Henneberger C, Papouin T, Oliet SH, Rusakov DA. Long-term potentiation depends on release of d-serine from astrocytes. Nature. 2010; 463:232–236. [PubMed: 20075918]
Hetherington HP, Pan JW, Mason GF, Adams D, Vaughn MJ, Twieg DB, Pohost GM. Quantitative 1H spectroscopic imaging of human brain at 4.1 T using image segmentation. Magn. Reson. Med. 1996; 36:21–29. [PubMed: 8795016]
Horenstein C, Lowe MJ, Koenig KA, Phillips MD. Comparison of unilateral and bilateral complex finger tapping-related activation in premotor and primary motor cortex. Hum. Brain Mapp. 2009; 30:1397–1412. [PubMed: 18537112]
Hummel FC, Steven B, Hoppe J, Heise K, Thomalla G, Cohen LG, Gerloff C. Deficient intracortical inhibition (SICI) during movement preparation after chronic stroke. Neurology. 2009; 72:1766– 1772. [PubMed: 19451532]
Hutchins KD, Martino AM, Strick PL. Corticospinal projections from the medial wall of the hemisphere. Exp. Brain Res. 1988; 71:667–672. [PubMed: 2458281]
Inglese M, Rusinek H, George IC, Babb JS, Grossman RI, Gonen O. Global average gray and white matter N-acetylaspartate concentration in the human brain. Neuroimage. 2008; 41:270–276. [PubMed: 18400521]
Johansen-Berg H, Rushworth MF, Bogdanovic MD, Kischka U, Wimalaratna S, Matthews PM. The role of ipsilateral premotor cortex in hand movement after stroke. Proc. Natl. Acad. Sci. U. S. A. 2002; 99:14518–14523. [PubMed: 12376621]
NIH-PA Author Manuscript
NIH-PA Author Manuscript
Kang DW, Roh JK, Lee YS, Song IC, Yoon BW, Chang KH. Neuronal metabolic changes in the cortical region after subcortical infarction: a proton MR spectroscopy study. J. Neurol. Neurosurg. Psychiatry. 2000; 69:222–227. [PubMed: 10896697]
Kobayashi M, Takayama H, Suga S, Mihara B. Longitudinal changes of metabolites in frontal lobes after hemorrhagic stroke of basal ganglia: a proton magnetic resonance spectroscopy study. Stroke. 2001; 32:2237–2245. [PubMed: 11588307]
Liang Z, Zeng J, Zhang C, Liu S, Ling X, Xu A, Ling L, Wang F, Pei Z. Longitudinal investigations on the anterograde and retrograde degeneration in the pyramidal tract following pontine infarction with diffusion tensor imaging. Cerebrovasc. Dis. 2008; 25:209–216. [PubMed: 18216462] Liepert J, Hamzei F, Weiller C. Motor cortex disinhibition of the unaffected hemisphere after acute
stroke. Muscle Nerve. 2000; 23:1761–1763. [PubMed: 11054757]
Lotze M, Markert J, Sauseng P, Hoppe J, Plewnia C, Gerloff C. The role of multiple contralesional motor areas for complex hand movements after internal capsular lesion. J. Neurosci. 2006; 26:6096–6102. [PubMed: 16738254]
Loubinoux I, Carel C, Pariente J, Dechaumont S, Albucher JF, Marque P, Manelfe C, Chollet F. Correlation between cerebral reorganization and motor recovery after subcortical infarcts. Neuroimage. 2003; 20:2166–2180. [PubMed: 14683720]
Lu P, Blesch A, Tuszynski MH. Neurotrophism without neurotropism: BDNF promotes survival but not growth of lesioned corticospinal neurons. J. Comp. Neurol. 2001; 436:456–470. [PubMed: 11447589]
Mai, JK.; Paxinos, G.; Voss, T. Atlas of the Human Brain. Elsevier; New York, NY: 2008.
Manganotti P, Patuzzo S, Cortese F, Palermo A, Smania N, Fiaschi A. Motor disinhibition in affected and unaffected hemisphere in the early period of recovery after stroke. Clin. Neurophysiol. 2002; 113:936–943. [PubMed: 12048054]
Mochizuki H, Huang YZ, Rothwell JC. Interhemispheric interaction between human dorsal premotor and contralateral primary motor cortex. J. Physiol. 2004; 561:331–338. [PubMed: 15459244] Morecraft RJ, Herrick JL, Stilwell-Morecraft KS, Louie JL, Schroeder CM, Ottenbacher JG,
Schoolfield MW. Localization of arm representation in the corona radiata and internal capsule in the non-human primate. Brain. 2002; 125:176–198. [PubMed: 11834603]
Munoz Maniega S, Cvoro V, Chappell FM, Armitage PA, Marshall I, Bastin ME, Wardlaw JM. Changes in NAA and lactate following ischemic stroke: a serial MR spectroscopic imaging study. Neurology. 2008; 71:1993–1999. [PubMed: 19064881]
Nachev P, Kennard C, Husain M. Functional role of the supplementary and pre-supplementary motor areas. Nat. Rev. Neurosci. 2008; 9:856–869. [PubMed: 18843271]
Perez MA, Tanaka S, Wise SP, Willingham DT, Cohen LG. Time-specific contribution of the supplementary motor area to intermanual transfer of procedural knowledge. J. Neurosci. 2008; 28:9664–9669. [PubMed: 18815252]
Provencher SW. Automatic quantitation of localized in vivo 1H spectra with LCModel. NMR Biomed. 2001; 14:260–264. [PubMed: 11410943]
Rango M, Cogiamanian F, Marceglia S, Barberis B, Arighi A, Biondetti P, Priori A. Myoinositol content in the human brain is modified by transcranial direct current stimulation in a matter of minutes: a 1H-MRS study. Magn. Reson. Med. 2008; 60:782–789. [PubMed: 18816828] Riecker A, Groschel K, Ackermann H, Schnaudigel S, Kassubek J, Kastrup A. The role of the
unaffected hemisphere in motor recovery after stroke. Hum. Brain Mapp. 2010; 31:1017–1029. [PubMed: 20091792]
Sabet A, Sibbitt WL Jr. Stidley CA, Danska J, Brooks WM. Neurometabolite markers of cerebral injury in the antiphospholipid antibody syndrome of systemic lupus erythematosus. Stroke. 1998; 29:2254–2260. [PubMed: 9804631]
Sastre-Garriga J, Ingle GT, Chard DT, Ramio-Torrenta L, McLean MA, Miller DH, Thompson AJ. Metabolite changes in normal-appearing gray and white matter are linked with disability in early primary progressive multiple sclerosis. Arch. Neurol. 2005; 62:569–573. [PubMed: 15824254] Seitz RJ, Hoflich P, Binkofski F, Tellmann L, Herzog H, Freund HJ. Role of the premotor cortex in recovery from middle cerebral artery infarction. Arch. Neurol. 1998; 55:1081–1088. [PubMed: 9708958]
NIH-PA Author Manuscript
NIH-PA Author Manuscript
Seitz RJ, Azari NP, Knorr U, Binkofski F, Herzog H, Freund HJ. The role of diaschisis in stroke recovery. Stroke. 1999; 30:1844–1850. [PubMed: 10471434]
Sharma N, Baron JC, Rowe JB. Motor imagery after stroke: relating outcome to motor network connectivity. Ann. Neurol. 2009; 66:604–616. [PubMed: 19938103]
Sharma NK, McCarson K, Van Dillen L, Lentz A, Khan T, Cirstea MC. Primary somatosensory cortex in chronic low back pain — a H-MRS study. Journal of Pain Research. 2011; 4:143–150.
[PubMed: 21647218]
Shelton FN, Reding MJ. Effect of lesion location on upper limb motor recovery after stroke. Stroke. 2001; 32:107–112. [PubMed: 11136923]
Shibuya M. Brain angiogenesis in developmental and pathological processes: therapeutic aspects of vascular endothelial growth factor. FEBS J. 2009; 276:4636–4643. [PubMed: 19664071] Siegel, GJB.; Agranoff, BW.; Albers, GW.; Fisher, SK.; Uhler, MD. Basic Neurochemistry:
Molecular, Cellular and Medical Aspects. 7th ed.. Academic Press; Oxford, UK: 2005.
Stepniewska I, Preuss TM, Kaas JH. Architectonics, somatotopic organization, and ipsilateral cortical connections of the primary motor area (M1) of owl monkeys. J. Comp. Neurol. 1993; 330:238– 271. [PubMed: 7684050]
Suhy J, Rooney WD, Goodkin DE, Capizzano AA, Soher BJ, Maudsley AA, Waubant E, Andersson PB, Weiner MW. 1H MRSI comparison of white matter and lesions in primary progressive and relapsing–remitting MS. Mult. Scler. 2000; 6:148–155. [PubMed: 10871825]
Swayne OB, Rothwell JC, Ward NS, Greenwood RJ. Stages of motor output reorganization after hemispheric stroke suggested by longitudinal studies of cortical physiology. Cereb. Cortex. 2008; 18:1909–1922. [PubMed: 18234688]
Tarkka IM, Kononen M, Pitkanen K, Sivenius J, Mervaalat E. Alterations in cortical excitability in chronic stroke after constraint-induced movement therapy. Neurol. Res. 2008; 30:504–510. [PubMed: 18953741]
van der Grond J, Balm R, Kappelle LJ, Eikelboom BC, Mali WP. Cerebral metabolism of patients with stenosis or occlusion of the internal carotid artery. A 1H-MR spectroscopic imaging study. Stroke. 1995; 26:822–828. [PubMed: 7740574]
van der Grond J, Balm R, Klijn CJ, Kapelle LJ, Eikelboom BC, Mali WP. Cerebral metabolism of patients with stenosis of the internal carotid artery before and after endarterectomy. J. Cereb. Blood Flow Metab. 1996; 16:320–326. [PubMed: 8594065]
Van Zijl PC, Barker PB. Magnetic resonance spectroscopy and spectroscopic imaging for the study of brain metabolism. Ann. N. Y. Acad. Sci. 1997; 820:75–96. [PubMed: 9237450]
Walker PM, Ben Salem D, Giroud M, Brunotte F. Is NAA reduction in normal contralateral cerebral tissue in stroke patients dependent on underlying risk factors? J. Neurol. Neurosurg. Psychiatry. 2006; 77:596–600. [PubMed: 16614018]
Wang Y, Li SJ. Differentiation of metabolic concentrations between gray matter and white matter of human brain by in vivo 1H magnetic resonance spectroscopy. Magn. Reson. Med. 1998; 39:28–33. [PubMed: 9438434]
Wannier T, Schmidlin E, Bloch J, Rouiller EM. A unilateral section of the corticospinal tract at cervical level in primate does not lead to measurable cell loss in motor cortex. J. Neurotrauma. 2005; 22:703–717. [PubMed: 15941378]
Ward NS, Newton JM, Swayne OB, Lee L, Thompson AJ, Greenwood RJ, Rothwell JC, Frackowiak RS. Motor system activation after subcortical stroke depends on corticospinal system integrity. Brain. 2006; 129:809–819. [PubMed: 16421171]
Watanabe T, Shiino A, Akiguchi I. Absolute quantification in proton magnetic resonance spectroscopy is useful to differentiate amnesic mild cognitive impairment from Alzheimer's disease and healthy aging. Dement. Geriatr. Cogn. Disord. 2010; 30:71–77. [PubMed: 20689286]
Werring DJ, Clark CA, Barker GJ, Miller DH, Parker GJ, Brammer MJ, Bullmore ET, Giampietro VP, Thompson AJ. The structural and functional mechanisms of motor recovery: complementary use of diffusion tensor and functional magnetic resonance imaging in a traumatic injury of the internal capsule. J. Neurol. Neurosurg. Psychiatry. 1998; 65:863–869. [PubMed: 9854962]
Wise SP, di Pellegrino G, Boussaoud D. The premotor cortex and nonstandard sensorimotor mapping. Can. J. Physiol. Pharmacol. 1996; 74:469–482. [PubMed: 8828893]
NIH-PA Author Manuscript
NIH-PA Author Manuscript
Zemke AC, Heagerty PJ, Lee C, Cramer SC. Motor cortex organization after stroke is related to side of stroke and level of recovery. Stroke. 2003; 34:e23–e28. [PubMed: 12677024]
NIH-PA Author Manuscript
NIH-PA Author Manuscript
Fig. 1.
A. Cortical activation elicited by a handgrip task executed with the right (paretic) hand in a representative healthy control (56-year old male) and stroke survivor (61-year-old male, Subject #14 in Table 1); Compared to control, the stroke survivor showed abnormal activity in bilateral non-primary motor areas; Spectroscopic voxels (black squares) were selected based on PMd and SMA activation; L indicates left; R, right. B. LCModel output from one spectroscopic voxel located in PMd (upper panels) and SMA (lower panels) in the left (ipsilesional) hemisphere in the healthy and stroke participants above-mentioned. For the stroke survivor, the spectrum was selected from a similar axial slice and spectroscopic voxel location as in the healthy control. PMd mI increase (6.3 mM vs. 5.6 mM) and SMA NAA decrease (9.0 mM vs. 12.2 mM) are visible in the spectra of patient compared to control (see arrows); ppm indicates parts per million.
NIH-PA Author Manuscript
NIH-PA Author Manuscript
Fig. 2.
Metabolite changes (%) in stroke versus controls in PMd (A) and SMA (B) in ipsilesional (gray bars) and contralesional (black) hemispheres.
NIH-PA Author Manuscript
NIH-PA Author Manuscript
Fig. 3.
Metabolite correlation pattern between non-primary motor areas (PMd and SMA) within each hemisphere (A, intra-hemispheric), and between hemispheres within each non-primary motor area (B, inter-hemispheric), in controls (upper panels) and stroke patients (lower panels). Pearson's correlation coefficients (r, white numbers) are presented as color gradients (gray—positive, blue—negative) and the side legend represent the corresponding p-values.
NIH-PA Author Manuscript
NIH-PA Author Manuscript
NIH-PA Author Manuscript
NIH-PA Author Manuscript
NIH-PA Author Manuscript
Table 1
Demographic and clinical characteristics of patients.
Age/sex Time since onset (mo) Site of stroke FMUE
57/M 6 L/basal ganglia, corona radiata 66
68/M 63 L/posterior limb internal capsule, thalamus 65
46/M 52 L/posterior limb internal capsule, basal ganglia 63
48/F 11 L/posterior limb internal capsule, basal ganglia 61
46/F 8 R/basal ganglia 58
71/M 98 L/anterior limb/genu internal capsule, basal ganglia 54
56/M 23 L/anterior limb internal capsule 50
61/F 27 L/cerebral peduncles 50
65/M 36 R/basal ganglia, corona radiata 42
73/M 60 R/anterior limb internal capsule, basal ganglia 41
71/M 26 L/posterior limb internal capsule, basal ganglia 37
45/M 27 R/basal ganglia, corona radiata 36
63/F 48 L/pons 34
61/M 15 L/pons 30
56/F 6 R/posterior limb internal capsule, basal ganglia 29
44/F 106 L/basal ganglia, anterior limb/genu/posterior limb internal capsule, corona radiata 26
59/M 144 R/posterior limb internal capsule, basal ganglia 25
58/M 27 L/posterior limb internal capsule, basal ganglia 24
36/F 84 R/basal ganglia, anterior limb/genu/posterior limb internal capsule, corona radiata 13
61/M 24 L/basal ganglia, anterior limb/genu/posterior limb internal capsule, corona radiata 10
Cirstea et al.
Page 19
Table 2
Between-groups comparisons of mean±SD metabolite concentrations (mM).
Target metabolites Other metabolites
NAA mI Glx Cho Cre
Left/ipsilesional hemisphere
Dorsal premotor cortex
Healthy 11.9±2.2 5.4±0.9 13.6±2.8 2.1±0.4 8.1±1.3
Stroke 10.9±1.8 6.2±1.3 13.1±3.4 2.1±0.3 8.5±1.6
p-Value 0.09 0.04 0.74 0.84 0.51
Supplementary motor area
Healthy 12.5 ±2.1 6.7±1.6 14.7±2.3 2.4±0.5 8.9±1.4
Stroke 10.7 ±2.2 6.8±1.2 15.3±3.0 2.3±0.4 8.8±1.5
p-Value 0.02 0.77 0.53 0.45 0.89
Right/contralesional hemisphere
Dorsal premotor cortex
Healthy 12.2±1.9 5.8±1.1 12.8±2.7 2.1±0.4 8.1±1.2
Stroke 11.6±1.7 6.1±1.3 13.7±3.2 2.1±0.3 8.5±1.1
p-Value 0.29 0.40 0.40 0.73 0.42
Supplementary motor area
Healthy 11.0±2.3 6.2±1.5 13.2±2.9 2.2±0.4 8.1±1.3
Stroke 10.2±1.3 6.4±1.3 14.4±3.0 2.1±0.4 8.4±0.9
p-Value 0.22 0.62 0.22 0.43 0.47
p-Value signifies differences between groups.
Brain Res
NIH-PA Author Manuscript
NIH-PA Author Manuscript
NIH-PA Author Manuscript
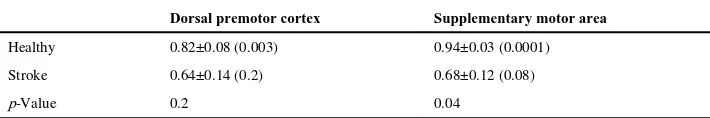
Table 3
Canonical correlation analysis (rc±SE (p-value)).
Intra-hemispheric correlations between dorsal premotor cortex and supplementary motor area Left/ipsilesional hemisphere Right/contralesional hemisphere
Healthy 0.83±0.08 (0.002) 0.91±0.05 (0.005)
Stroke 0.77±0.09 (0.02) 0.55±0.16 (0.3)
p-Value 0.7 0.1
Inter-hemispheric correlations between homologous premotor areas left/ipsilesional and right/contralesional Dorsal premotor cortex Supplementary motor area
Healthy 0.82±0.08 (0.003) 0.94±0.03 (0.0001)
Stroke 0.64±0.14 (0.2) 0.68±0.12 (0.08)
p-Value 0.2 0.04