DOI: http://dx.doi.org/10.21609/jiki.v9i1.364
ELECTROCARDIOGRAM ARRHYTHMIA CLASSIFICATION SYSTEM USING SUPPORT VECTOR MACHINE BASED FUZZY LOGIC
Sugiyanto, Tutuk Indriyani, and Muhammad Heru Firmansyah
Department of Informatics Engineering, Faculty of Information Technology, Adhi Tama Institute of Technology Surabaya
Arief Rachman Hakim 100, Surabaya, 60117, Indonesia
E-mail: [email protected], [email protected], [email protected]
Abstract
Arrhythmia is a cardiovascular disease that can be diagnosed by doctors using an electrocardiogram (ECG). The information contained on the ECG is used by doctors to analyze the electrical activity of the heart and determine the type of arrhythmia suffered by the patient. In this study, ECG arrhythmia classification process was performed using Support Vector Machine based fuzzy logic. In the pro-posed method, fuzzy membership functions are used to cope with data that are not classifiable in the method of Support Vector Machine (SVM) one-against-one. An early stage of the data processing is the baseline wander removal process on the original ECG signal using Transformation Wavelet Dis-crete (TWD). Afterwards then the ECG signal is cleaned from the baseline wander segmented into units beat. The next stage is to look for six features of the beat. Every single beat is classified using SVM method based fuzzy logic. Results from this study show that ECG arrhythmia classification using proposed method (SVM based fuzzy logic) gives better results than original SVM method. ECG arrhythmia classification using SVM method based fuzzy logic forms an average value of accuracy level, sensitivity level, and specificity level of 93.5%, 93.5%, and 98.7% respectively. ECG arrhyth-mia classification using only SVM method forms an average value accuracy level, sensitivity level, and specificity level of 91.83%, 91.83%, and 98.36% respectively.
Keywords: arrhythmia classification, ECG, fuzzy logic, heart rate, Support Vector Machine
Abstrak
Aritmia adalah penyakit kardiovaskular yang dapat didiagnosis dokter menggunakan elektrokardio-gram (EKG). Informasi yang terdapat di EKG digunakan oleh dokter untuk menganalisis aktivitas elektrik jantung dan menentukan jenis aritmia yang diderita oleh pasien. Dalam penelitian ini, proses klasifikasi aritmia EKG dilakukan dengan menggunakan Support Vector Machine berbasis fuzzy logic. Pada metode yang diusulkan, fungsi keanggotaan fuzzy digunakan untuk mengatasi dengan data yang tidak dapat diklasifikasikan dalam metode Support Vector Machine (SVM) satu-terhadap-satu. Tahap awal pengolahan data adalah proses baseline wander removal pada sinyal EKG asli menggunakan Transformasi Wavelet Diskrit (TWD), dan kemudian sinyal EKG bersih dari baseline wander tersegmentasi ke unit denyut. Tahap berikutnya adalah untuk mencari enam fitur dari denyut, dan setiap denyut tunggal diklasifikasikan menggunakan metode SVM berbasis fuzzy logic. Hasil dari penelitian menunjukkan bahwa klasifikasi aritmia EKG menggunakan metode yang diusulkan (SVM berdasarkan logika fuzzy) memberikan hasil yang lebih baik daripada metode SVM asli. Klasifikasi aritmia EKG menggunakan metode SVM berbasis logika fuzzy membentuk nilai rata-rata tingkat akurasi, tingkat sensitivitas, dan tingkat spesifisitas 93,5%, 93,5%, dan 98,7%. Klasifikasi aritmia EKG menggunakan metode SVM asli hanya membentuk tingkat rata-rata nilai akurasi, tingkat sensitivitas, dan tingkat spesifisitas 91,83%, 91,83%, dan 98,36%.
Kata Kunci:klasifikasi aritmia, ECG, logika fuzzy, denyut jantung, Support Vector Machine
1. Introduction
Arrhythmias are disorders of the heart in the form of interference on the frequency, irregularity, pla-ce of origin pulse or conduction of electrical im-pulses in the heart [1]. Arrhythmia is a dangerous disease, so patients need immediate treatment and
therapy regularly to prevent a worsening conditi-on [2]. In general, the diagnosis of arrhythmias can only be done by a cardiologist. Along with the development of science and technology, many re-searchers doing research on the diagnosis of arr-hythmias to find a system that can classify arrhy-thmias more accurately.
1, February 2016
Many researchers have previously raised the topic of arrhythmia classification. Srivastava et al. [3] create an arrhythmia classification system usi-ng Fuzzy Sugeno method. The proposed sys-tem is able to categorize an ECG wave to one of thir-teen types of arrhythmia. Results from the classi-fication system are consistent with the results of testing by the cardiologist as many as 91 of the 105 data.
Moavenian and Khorrami [4] conducted a comparison using the method of Support Vector Machine (SVM) and Artificial Neural Network (ANN) to classify the six types of arrhythmia am-ong others Right Bundle Branch Block (RBBB), Left Bundle Branch Block (LBBB), Premature Ventricular Beat (PVB), Paced Beat (PB) Prema-ture Atrial Beat (PAB), and Fusion of Paced and normal Beat (FB). The testing process using three assessment criteria includes performance training, performance testing and training time. The results show that SVM is superior in performance train-ing and traintrain-ing time while ANN is superior in performance testing.
Castillo et al. [5] did a comparison between three methods of classification of arrhythmias inc-lude Fuzzy K-Nearest Neighbours, Multi-Layer Perceptron with Back Propagation Gradient Des-cent with momentum, and Multi-Layer Perceptron with Back Propagation Gradient Scale Conjuga-ted. Each method resulted considerable accuracy. After the arrhythmia classification system combi-ned with Fuzzy Mamdani method, it rise the accu-racy up to 98%.
From several previous studies, the authors found a solution to make the arrhythmia classifi-cation system using SVM method that has proven better for classifying arrhythmias, and combined with fuzzy methods to address data that is not classified. One of the electrocardiogram signal noises that often arise is the Baseline Wander, a condition in which an electrocardiogram signal have movement at low frequencies irregular [6]. So that the system can perform accurate classifi-cation electrocardiogram signal, the signal must be free from noise. The solution resulted in higher levels of accuracy.
2. Methods
Electrocardiogram
Electrocardiogram (ECG) is a representation of a signal generated by the electrical activity of the heart muscle [7]. ECG signal is recorded using an electrocardiograph device. Electrocardiograph de-vices are medical dede-vices used by patients to mea-sure the electrical activity of the heart by measu-ring the difference biopotential from the outside
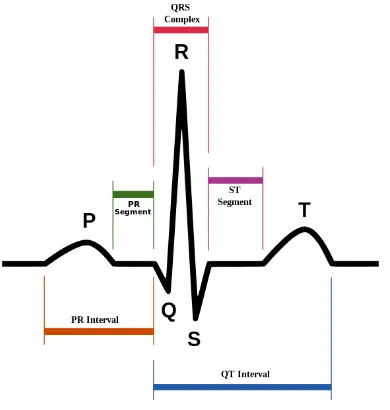
into the body. In the medical field, electrocardio-graph is used to diagnose some types of diseases related to the heart of which is a heart attack, di-sease/heart conditions, ischemia, hypertension (hi-gh blood pressure). One-piece ECG describes the condition of normal heartbeat consists of one P wave, one QRS complex, and one T wave. Figure 1 shows a schematic representation of normal ECG.
Arrhythmia
Arrhythmia is a change in the frequency of heart rhythm caused by abnormal electrolyte conduct-ion or automatically [1]. Heart rhythm disorder is not confined to the irregularity of the heart rate but also includes the rate and conduction distur-bances. Heart rhythm disorder is caused by lack of oxygenated blood supply to the heart muscle, usu-ally arises throbbing sensation that is too slow, too fast, or irregular throbbing pulsations [8]. Based on the type of beat, Association for the Advance-ment of Medical InstruAdvance-mentation (AAMI) classi-fies the arrhythmia into 15 types of beat [9]. This study will classify the six types of disorder's arr-hythmias selected from disorders that often appear in the dataset MIT-BIH [10] among other's Nor-mal Beat (NB), Premature Ventricular Contraction (PVC), Paced Beat (PB), Left Bundle Branch Blo-ck Beat (LBBB), Right Bundle Branch BloBlo-ck Be-at (RBBB), and Atrial PremBe-ature BeBe-at (APB). Support Vector Machine
Support Vector Machine (SVM) is a linear classi-fier method with the predetermined feature set [11]. SVM delivers maximum results while using fewer data training and there is no overlap
ween the existing classes [12]. SVM looking for a hyperplane with the largest margin is called Maxi-mum Marginal Hyperplane (MMH) to separate the existing class. 𝑫𝑫 (𝒙𝒙,𝒘𝒘,𝒃𝒃) is a decision functionto determine the MMH can be expressed by equation(1).
𝐷𝐷(x, w, b) =𝑊𝑊𝑇𝑇 .𝑋𝑋+𝑏𝑏=�W𝑖𝑖𝑥𝑥𝑖𝑖 𝑛𝑛
𝑖𝑖=1
+𝑏𝑏 (1)
To optimize the equation(1) in order to obtain a maximum margin, quadratic programming optimi-zation is performed using equation(2).
𝐿𝐿𝑑𝑑(𝑎𝑎) =−0.5𝑎𝑎2𝐻𝐻𝑎𝑎+𝑓𝑓𝑇𝑇𝑎𝑎 (2)
Equation(2) has a constraint such as equation(3), and equation(4). we used equation(5) and (6) to obtain the value of w, and b are optimal.
where equation(6) is only used on data that has a support vector (α>0).
Support Vector Machine Based Fuzzy Logic
Support Vector Machine (SVM) based fuzzy logic is the development of Support Vector Machine methods to overcome the problems of multiclass. In each class, there will be defined a polyhedral pyramidal decision membership function using function obtained from SVM method for a class pair. SVM method will look for a hyperplane with the largest margin called Maximum Marginal Hy-perplane (MMH). The distance between the hy-perplane with a side of the margin is equal to the distance between the hyperplane with margin on the other side. If the classification is done in pairs, decision function for class i and j formulated in equation(7).
𝐷𝐷𝑖𝑖𝑖𝑖(𝑥𝑥) =𝑤𝑤𝑖𝑖𝑖𝑖𝑇𝑇𝑥𝑥+ 𝑏𝑏𝑖𝑖𝑖𝑖 (7)
SVM based fuzzy logic used membership functions to classify areas that cannot be classified by the decision function. Equation(8) shows the membership function mij.
𝑚𝑚𝑖𝑖𝑖𝑖(𝑥𝑥) =�
1,𝑓𝑓𝑓𝑓𝑓𝑓𝐷𝐷𝑖𝑖𝑖𝑖(𝑥𝑥) ≥1,
𝐷𝐷𝑖𝑖𝑖𝑖(𝑥𝑥) 𝑓𝑓𝑓𝑓𝑓𝑓𝑡𝑡ℎ𝑒𝑒𝑓𝑓𝑡𝑡ℎ𝑒𝑒𝑓𝑓 (8)
By using 𝑚𝑚𝑖𝑖𝑖𝑖(𝑥𝑥), the membership function x to the class i can be defined using the operator equ-ation(9).
𝑚𝑚𝑖𝑖(𝑥𝑥) = j=1𝑚𝑚𝑎𝑎𝑚𝑚,…..n𝑚𝑚𝑖𝑖𝑖𝑖(𝑥𝑥) (9)
Equation(8) and (9) are equivalent to equation (10).
𝑚𝑚𝑖𝑖(𝑥𝑥) =𝑚𝑚𝑎𝑎𝑚𝑚(1,j≠i𝑚𝑚𝑎𝑎𝑚𝑚,j=1,…..n𝐷𝐷𝑖𝑖𝑖𝑖(𝑥𝑥)) (10)
To simplify the calculations, equation(10) can be written into the equation(11).
𝑚𝑚𝑖𝑖(𝑥𝑥) = j≠i𝑚𝑚𝑎𝑎𝑚𝑚,j=1,…..n𝐷𝐷𝑖𝑖𝑖𝑖(𝑥𝑥) (11)
Furthermore, the data is classified based on the hi-ghest membership value according to the equation (12).
𝐷𝐷𝑎𝑎𝑡𝑡𝑎𝑎𝑐𝑐𝑙𝑙𝑎𝑎𝑐𝑐𝑐𝑐𝑥𝑥=𝑚𝑚𝑎𝑎𝑥𝑥
i=1,…..n 𝑚𝑚𝑖𝑖(𝑥𝑥) (12)
ECG Dataset
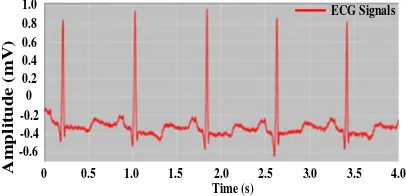
The dataset used in this study is the MIT-BIH ar-rhythmia database published by PhysioNet [10]. The source of the ECG recording consists of 4000 Holter recordings originating from Beth Israel Hospital Arrhythmia Laboratory between 1975 and 1979. ECG randomly selected each from 48 the data recording ECG signals with a duration of 30 minutes. Examples of ECG signal representati-on can be seen in Figure 2.
1, February 2016
System Flowchart
System flowchart is divided into two parts, na-mely the training system flowchart, and testing system flowchart. Training system doing the lear-ning from the trailear-ning data to find a classi-fication model. The early stage of ECG data processing is the baseline wander removal process on the origi-nal ECG sigorigi-nal using Discrete Wavelet Transfor-mation (TWD). The ECG signal is clean from the baseline wander will be segmented into units beat. The next stage is to find six features of the beat, and every single beat is classified using SVM me-thod based fuzzy logic. Researchers added fuzzy membership function in SVM method to solve the problem of classified data when using Support Vector Machine (SVM) one-against-one. Figure 3 shows the training system flowchart.
The testing system created a prediction bas-ed on testing data processing to get the classifi-cation results, and continued by analyzing the
cla-ssification results. Figure 4 shows the testing sys-tem flowchart.
Baseline Wander Removal
Baseline Wander is a condition when the ECG signal is shifted up or down to the isoelectric line (line axis). To overcome the noise, the researchers conducted the Baseline Wander Removal using Transform Wavelet Discrete method [6].
The original signal is decomposed using the Transform Wavelet type Daubechies order 4. The system calculated the energy value at a high-fre-quency signal and found the conditions in which
Start
MIT-BIH Arrhythmia
Database
Baseline Wander Removal using
TWD
SVM based Fuzzy Logic Training Feature Extraction
Segmentation
Classification Model
End
Figure 3. Training System Flowchart
Baseline Wander Removal using TWD
Daubechies orde 4 decomposition
Calculate the high frequency signals
energy
Low frequency signals reconstruction
Original ECG signal
End sub Clean Signal = Original
Signal - Baseline
Clean Signal from Baseline Wander
Baseline
Figure 5. Baseline Wander Removal Flowchart
Segmentation
Find R wave peaks of the all beat
Early beat = R wave peaks - 150 Clean ECG Signal from
Baseline Wander
End sub Final beat = R wave peaks + 149
One Beat Location
Figure 6. Beat Segmentation Flowchart Start
MIT-BIH Arrhythmia Database,
Classification Model
End Classification
Evaluation Baseline Wander
Removal using TWD
SVM based Fuzzy Logic Classification
Feature Extraction Segmentation
Classification Results
Evaluation Results
the value of decomposition level is lower than the value of decomposition level before. Furthermore, the system performed approximation signal recon-struction of this level by removing the value of the high-frequency signal. Figure 5 shows the Base-line Wander Removal flowchart.
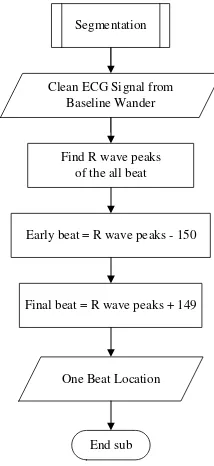
Beat Segmentation
In this stage, the ECG signals segmented into each beat. This process used additional annotation file to locate the position of the R-wave peaks. Assu-ming the width of each beat is done by positioning the peak of R as a pivot for each beat [8]. Early signals are sliced starting from the position of R-150 to R-149, so we get as many as 300 samples of beat data. Figure 6 shows the beat segmentation flowchart.
Feature Extraction
Feature extraction is the process of detection char-acteristics of the electrocardiogram that is used as an input variable in the classification process. The process consists of several steps as shown in Fi-gure 7. This process begins by determining the R-wave peaks on the signal segmentation results, and then continued found for the wave that is P, Q, S and T. After all waves found, then continued to characterize the one beat of ECG signal. These include the QRS duration, QRS morphology, P
wave height, RR interval, RRI ratio, and T wave height.
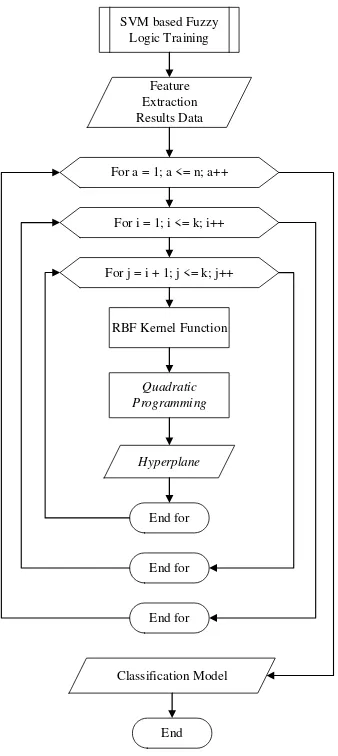
Training Process
SVM based fuzzy logic training process used the same training process with SVM one against one method, and build 𝑘𝑘(𝑘𝑘 −1)/2 parts of the binary classification model (k is the classes number). Ea-ch classification models is trained using data from two classes. For classroom training data to class i and class j, the system will solve the problems with the 6 classes by finding 15 separator func-tions as follows:
D𝑖𝑖𝑖𝑖(𝑥𝑥) = D12(𝑥𝑥), D13(𝑥𝑥), D14(𝑥𝑥), D15(𝑥𝑥), D16(𝑥𝑥),
D23(𝑥𝑥), D24(𝑥𝑥), D25(𝑥𝑥), D26(𝑥𝑥), D34(𝑥𝑥), D35(𝑥𝑥),
D36(𝑥𝑥), D45(𝑥𝑥), D46(𝑥𝑥), D56(𝑥𝑥).
So that the data can be separated linearly, this system uses Radial Basis Function (RBF) ker-nel 𝐾𝐾(𝑥𝑥,𝑦𝑦) =𝑒𝑒𝑥𝑥𝑒𝑒(−1
2𝜎𝜎2‖𝑥𝑥 − 𝑦𝑦‖2). To obtain a
so-lution or the separation of these two classes, this system using quadratic programming. Result of
Feature Extraction
Find R wave peaks
P, Q, S and T wave detection ECG signal segmentation results
End sub
Determine the QRS duration, QRS morphology, PR wave height, RR interval, RRI ratio, and T wave height
QRS duration, P high, RR interval, RRI ratio, QRS morphology, and T high
Figure 7. Feature Extraction Flowchart
SVM based Fuzzy Logic Training
RBF Kernel Function
Quadratic Programming
Feature Extraction Results Data
For a = 1; a <= n; a++
End for
End For i = 1; i <= k; i++
End for For j = i + 1; j <= k; j++
End for
Hyperplane
Classification Model
1, February 2016
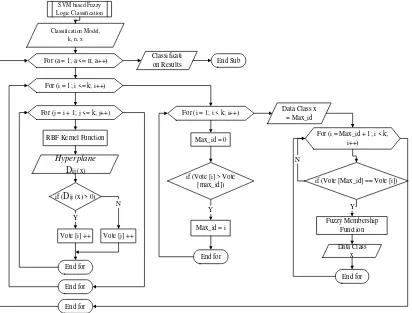
quadratic programming are w, x, and B that used for the testing process. The flowchart for the stag-es of the training procstag-ess can be seen in Figure 8. Classification Process Using SVM based fuzzy logic
A common strategy in the testing process using one-against-one SVM method is max-voting [9]. Based on this strategy, if the representation of a data on the hyperplane Dij(x) is in class i, then
vo-ting added one for the class i. Otherwise, if the representation of a data on the hyperplane Dij(x) is
in class j, then voting added one for the class j. These steps are repeated for all hyperplane. Then, system predicted x is in a class where, based on the value of the highest voting. In cases where there are two classes with the same voting value, then selected the smallest index value, the process is arguably less effective. To resolve with the data that is not classifiable, this study used the mem-bership function according to the equation(11) using mi(x). The data x are classified based on the
highest membership value according to the equ-ation(12). Flowchart for the stages SVM based fu-zzy logic method can be seen in Figure 9.
3. Results and Analysis
Evaluations of the classification results of the arr-hythmia abnormalities consisted of two scenarios, among others, using the original SVM, and pro-posed method (SVM based fuzzy logic). This stu-dy used 600 testing data, which consisted of each 100 Normal Beat (NB) data, 100 Left Bundle Bra-nch Block Beat (LBBB) data, 100 Right Bundle Branch Block Beat (RBBB) data, 100 Premature Ventricular Contraction (PVC) data, 100 Atrial Premature Beat (APB) data, and 100 Paced Beat (PB) data. Then the results are compared based on three measures among others accuracy, sensitive-ty, and specificity.
Accuracy
=number of data classified correctly
number of tests performed x100%
(13)
Sensitivity = TP
TP + FN x 100% (14)
Specificity = TN
FP + TN x 100% (15)
where True Positive (TP) is arrhythmia correctly
SVM based Fuzzy Logic Classification
RBF Kernel Function Classification Model,
k, n, x
For (a = 1; a <= n; a++)
For (j = i + 1; j <= k; j++)
End for
End for For (i = 1; i <= k; i++)
End for
Hyperplane
Dij (x)
Y if (Dij (x) > 0)
Vote [i] ++ Vote [j] ++ N
Y if (Vote [i] > Vote
[max_id])
Max_id = i For (i = 1; i < k; i++)
Max_id = 0
Y
if (Vote [Max_id] == Vote [i])
Fuzzy Membership Function For (i = Max_id + 1; i < k;
i++)
End for
End for Data Class
x Classificati
on Results End Sub
Data Class x = Max_id
N
identified, False Positive (FP) is arrhythmia wro-ngly identified, True Negative (TN) is arrhythmia correctly not identified, and False Negative (FN) is arrhythmia wrongly not identified.
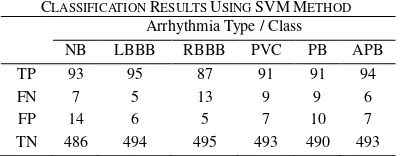
Scenario 1: Classification using SVM Method [4]
Experimental results of classification using SVM method [4] can be seen in Table 1.
Sensitivity of NB Class = 93
93+7 x 100% = 93%
Sensitivity of LBBB Class = 95
95+5 x 100% = 95%
Sensitivity of RBBB Class = 87
87+13 x 100% = 87%
Sensitivity values for each class are summed and divided by six, to obtain the average sensiti-vity value of 91.83%.
Specificity of NB Class = 486
14+486 x 100% = 97.2%
Specificity of LBBB Class = 494
6+494 x 100% = 98.8%
Specificity of RBBB Class = 495
5+495 x 100% = 99%
Specificity of PVC Class = 493
7+493 x 100% = 98.6%
Specificity of PB Class = 490
10+490 x 100% = 98%
Specificity of APB Class = 493
7+493 x 100% = 98.6%
The classification system using SVM me-thod has average specificity value of 98.36%. From Table 1, we can calculate the overall accura-cy value of 91.83%, the sensitivity average value of 91.83%, and the average specificity value of 98.36%.
Scenario 2: Classification using Proposed Method
Experimental results of classification using propo-sed method (Support Vector Machine bapropo-sed fuzzy logic method) can be seen in Table 2. Experime-nts scenario 2 uses the same dataset as that used in scenario 1.
Sensitivity values of classification using pro-posed method for each class are summed and divi-ded by six, to obtain the average sensitivity value of 93.5%.
Specificity of NB Class = 490
10+490 x 100% = 98%
Specificity of LBBB Class = 494
6+494 x 100% = 98.8%
Specificity of RBBB Class = 495
5+495 x 100% = 99%
Specificity of PVC Class = 493
7+493 x 100% = 98.6%
Specificity of PB Class = 496
4+496 x 100% = 99.2%
Specificity of APB Class = 493
7+493 x 100% = 98.6%
The classification system of classification using proposed method has average specificity va-lue of 98.7%. From Table 2, we can calculate the overall accuracy value of 93.5%, the average sen-sitivity value of 93.5%, and the average specifici-ty value of 98.7%. These results indicate that the arrhythmia classification system uses proposed method deliver performance values of accuracy, sensitivity, and specificity higher than the arrhyth-mia classification system using the original SVM method. This is because the use of fuzzy member-ship functions can cope with the data that is not classifiable in one against one Support Vector Machine method.
4. Conclusion
From the results of experiments and calculations, it can be concluded that the use of support vector machine based on fuzzy logic methods for classi-fication system abnormalities on ECG arrhythmia delivered performance with an accuracy level of 93.5%, the sensitivity of 93.5% and specificity of 98.7%. The result is higher when compared with the use of Support Vector Machine method with
TABLE 1
CLASSIFICATION RESULTS USING SVMMETHOD Arrhythmia Type / Class
NB LBBB RBBB PVC PB APB Arrhythmia Type / Class
NB LBBB RBBB PVC PB APB
TP 95 95 93 91 93 94
FN 5 5 7 9 7 6
FP 10 6 5 7 4 7
1, February 2016
an accuracy of 91.83%, sensitivity of 91.83%, and specificity of 98.36%. The use of fuzzy member-ship function can cope with data that are not cla-ssifiable in the one against one SVM method to deliver performance values of accuracy, sensitivi-ity, and specificity higher than SVM method. This research is only using one lead of ECG signals. Some arrhythmia disorders common feature but is different leads, such as abnormalities in Left Bun-dle Branch Block Beat (LBBB), and Beat Right Bundle Branch Block (RBBB). Further research can be done using two leads to improve the accu-racy of the arrhythmia classification system. References
[1] A. Dallali, A. Kachouri, & M. Samet. “Fuz-zy c-means clustering, Neural Network, WT, and HRV for classification of cardiac arrhy-thmia”, ARPN Journal of Engineering and Applied Sciences. Vol. 6(10). 2011.
[2] Arrhythmia Rules. Biomedical Telemetry. http://www.biotel.ws/ekgs/TheRules.htm ac-cessed on 12 May 2014.
[3] P. Srivastava, N. Sharma, & C.S. Aparna. Fuzzy Soft System and Arrhythmia Classifi-cation. Hindawi. India. 2013.
[4] M. Moavenian, & H. Khorrami. “A qualita-tive comparison of Artificial Neural Net-works and Support Vector Machines in ECG arrhythmias classification”. Elsevier. 3088-3093. 2010.
[5] O. Castilo, P. Melin, E. Ramirez, & J. Soria. “Hybrid intelligent system for cardiac arrhy-thmia classification with Fuzzy K-Nearest
Neighbours and neural networks combined with a fuzzy system”. Elsevier. 2947-2955. 2012.
[6] D. Sripathi. Efficient Implementations of Di-screte Wavelet Transform Using FPGAs. Florida State University. Florida. 2003. [7] A.K.M.F. Haque, H. Ali, M. A. Kiber, & Md.
T. Hasan. “Detection of Small Variations of ECG Features Using Wavelet”, ARPN Jour-nal of Engineering and Applied Sciences. 4(6):27-30. 2009.
[8] B. Anuradha, & V.C. Veera Reddy. “ANN for Classification of Cardiac Arrhythmias”, ARPN Journal of Engineering and Applied Sciences. 3(3):1-6. 2008.
[9] A. Dallali, A. Kachouri, & M. Samet. “Inte-gration Of HRV, WT and Neural Networks for ECG Arrhythmia Classification”, ARPN Journal of Engineering and Applied Scien-ces. 06/2011; 6(5). 2011.
[10]"MIT-BIH Arrhythmia database," 2015. [On-line]. Available:http://www.physionet.org/phy siobank/database/mitdb/. Accessed on 29 May 2014.
[11] K. J. Reza, S. Khatun, M. F. Jamlos, M. M. Fakir, & S. S. Mostafa. “Performance eva-luation of diversified SVM kernel functions for breast tumour early prognosis”, ARPN Journal of Engineering and Applied Scien-ces. 03/2014; 9(3):329-335. 2014.