Budi Harsanto
Dept. of Management & Business, Faculty of Economics, Universitas Padjadjaran [email protected]
Material
Review Last Topic
•
INVENTORY MANAGEMENT
– Probabilistic Models and Safety Stock – Single Period Model
Today Outline
•
MRP
– Dependent Demand
– Dependent Inventory Model
Requirements
– MRP Structure
– MRP Management
– Lot Sizing Technique
Operations
Management
Operations
Management
Chapter 14 –
Material Requirements
Planning (MRP) and
ERP
PowerPoint presentation to accompanyHeizer/Render
Benefts of MRP
1. Better response to customer
orders
2. Faster response to market
changes
3. Improved utilization of facilities
and labor
Dependent Demand
The demand for one item is
related to the demand for
another item
Given a quantity for the end
item, the demand for all parts
and components can be
calculated
In general, used whenever a
schedule can be established for
an item
Dependent Demand
1. Master production schedule
2. Specifcations or bill of material 3. Inventory availability
4. Purchase orders outstanding 5. Lead times
Efective use of dependent
Master Production Schedule
(MPS)
Specifes what is to be made and when Must be in accordance with the
aggregate production plan
Inputs from fnancial plans, customer
demand, engineering, supplier performance
As the process moves from planning to execution, each step must be tested for feasibility
The MPS is the result of the production
Master Production Schedule
(MPS)
MPS is established in terms of specifc
products
Schedule must be followed for a
reasonable length of time
The MPS is quite often fxed or frozen in the near term part of the plan
The MPS is a rolling schedule
Aggregate
Production Plan
Months January February
Aggregate Production Plan 1,500 1,200
(Shows the total
quantity of amplifers)
Weeks 1 2 3 4 5 6 7 8
Master Production Schedule (Shows the specifc type and quantity of amplifer to be produced
240-watt amplifer 100 100 100 100
150-watt amplifer 500 500 450 450
75-watt amplifer 300 100
Master Production Schedule
(MPS)
A customer order in a job shop
(make-to-order) company
Modules in a repetitive (assemble-to-order or forecast) company
An end item in a continuous
(stock-to-forecast) company
Focus for Diferent
Process Strategies
Stock to Forecast
(Product Focus)
Schedule fnished product
Assemble to Order or Forecast
(Repetitive)
Schedule modules
Make to Order
(Process Focus)
Schedule orders
Examples: Print shop Motorcycles Steel, Beer, Bread Machine shop Autos, TVs Lightbulbs Fine-dining restaurant Fast-food restaurant Paper
MPS Examples
Gross Requirements for Crabmeat Quiche
Gross Requirements for Spinach Quiche
Day 6 7 8 9 10 11 12 13 14 and so on
Amount 50 100 47 60 110 75
Day 7 8 9 10 11 12 13 14 15 16 and so on
Amount 100 200 150 60 75 100
Table 14.1
Bills of Material
List of components, ingredients,
and materials needed to make
product
Provides product structure
Items above given level are called
parents
BOM Example
B(2) Std. 12” Speaker kit C(3) Std. 12” Speaker kit w/ amp-booster
1
E(2)
E(2) F(2)
Packing box and installation kit of wire,
bolts, and screws
Std. 12” Speaker booster assembly 2 D(2) 12” Speaker D(2) 12” Speaker G(1) Amp-booster 3
Product structure for “Awesome” (A) A
BOM Example
B(2) Std. 12” Speaker kit C(3) Std. 12” Speaker kit w/ amp-booster
1
E(2)
E(2) F(2)
Packing box and installation kit of wire,
bolts, and screws
Std. 12” Speaker booster assembly 2 D(2) 12” Speaker D(2) 12” Speaker G(1) Amp-booster 3
Product structure for “Awesome” (A) A
Level 0
Part B: 2 x number of As = (2)(50) = 100
Part C: 3 x number of As = (3)(50) = 150
Part D: 2 x number of Bs
+ 2 x number of Fs = (2)(100) + (2)(300) = 800
Part E: 2 x number of Bs
+ 2 x number of Cs = (2)(100) + (2)(150) = 500
Part F: 2 x number of Cs = (2)(150) = 300
Bills of Material
Modular Bills
Modules are not fnal products but components that can be
assembled into multiple end items
Bills of Material
Planning Bills (Pseudo Bills)
Created to assign an artifcial parent to the BOM
Used to group subassemblies to
reduce the number of items planned and scheduled
Used to create standard “kits” for
Bills of Material
Phantom Bills
Describe subassemblies that exist only temporarily
Are part of another assembly and
never go into inventory
Low-Level Coding
Item is coded at the lowest level at which it occurs
Accurate Records
Accurate inventory records are
absolutely required for MRP (or
any dependent demand system)
to operate correctly
Generally MRP systems require
99% accuracy
Outstanding purchase orders
Lead Times
The time required to purchase,
produce, or assemble an item
For production – the sum of the order, wait, move, setup, store, and run times
Time-Phased Product
Structure
| | | | | | | |
1 2 3 4 5 6 7 8
Time in weeks
F 2 weeks 3 weeks 1 week A 2 weeks 1 week D E 2 weeks D G 1 week 1 week 2 weeks to produce B C E
Start production of D Must have D and E completed here so production can
begin on B
MRP Structure
Figure 14.5 Output Reports MRP by period report MRP by date report Planned order report Purchase advice Exception reports Order early orlate or not needed Order quantity too small or too
large
Data Files
Purchasing data BOM
Lead times
(Item master fle)
Determining Gross
Requirements
Starts with a production schedule for
the end item – 50 units of Item A in week 8
Using the lead time for the item,
determine the week in which the order should be released – a 1 week lead
time means the order for 50 units should be released in week 7
Determining Gross
Requirements
From the BOM, every Item A requires 2 Item Bs – 100 Item Bs are required in week 7 to satisfy the order release for Item A
The lead time for the Item B is 2 weeks
– release an order for 100 units of Item B in week 5
The timing and quantity for component requirements are determined by the
Determining Gross
Requirements
The process continues through the
entire BOM one level at a time – often called “explosion”
By processing the BOM by level, items
with multiple parents are only
processed once, saving time and resources and reducing confusion
Low-level coding ensures that each
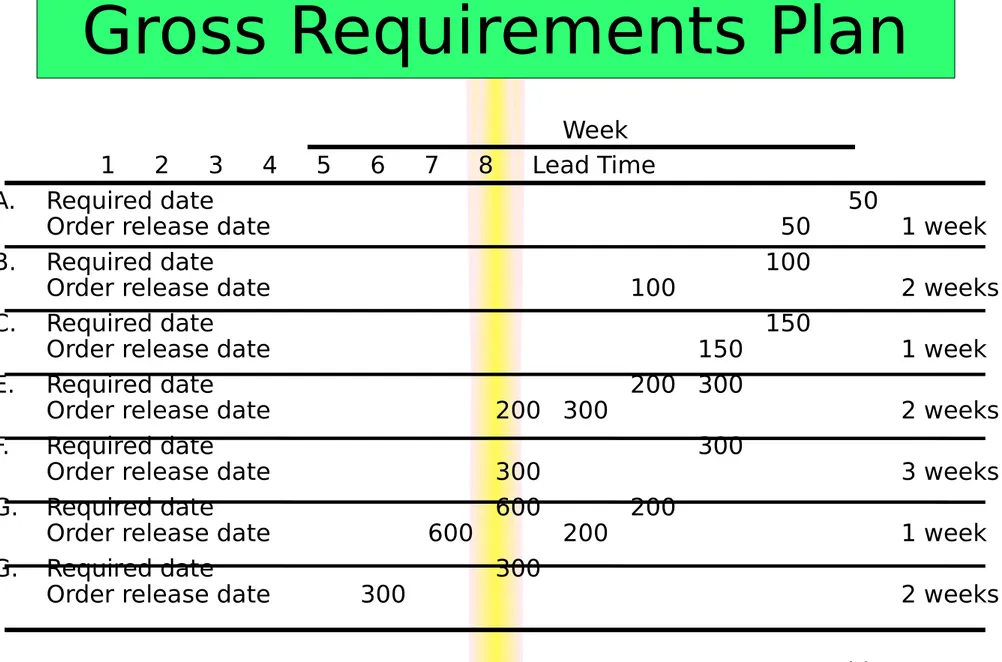
Gross Requirements Plan
Table 14.3 Week
1 2 3 4 5 6 7 8 Lead Time
A. Required date 50
Order release date 50 1 week
B. Required date 100
Order release date 100 2 weeks
C. Required date 150
Order release date 150 1 week
E. Required date 200 300
Order release date 200 300 2 weeks
F. Required date 300
Order release date 300 3 weeks
G. Required date 600 200
Order release date 600 200 1 week G. Required date 300
Determining Net
Requirements
Starts with a production schedule for the end item – 50 units of Item A in week 8
Because there are 10 Item As on hand, only 40 are actually required – (net
requirement) = (gross requirement - on- hand inventory)
Determining Net
Requirements
Following the lead time ofset
procedure, the planned order release for Item A is now 40 units in week 7
The gross requirement for Item B is now 80 units in week 7
There are 15 units of Item B on hand,
so the net requirement is 65 units in week 7
A planned order receipt of 65 units in
Determining Net
Requirements
A planned order receipt of 65 units in week 7 generates a planned order
release of 65 units in week 5
The on-hand inventory record for Item B is updated to refect the use of the 15 items in inventory and shows no on-hand inventory in week 8
This is referred to as the Gross-to-Net calculation and is the third basic
Net Requirements Plan
The logic of net requirements
Available inventory
Net requirements On
hand + Scheduled receipts
– =
Total requirements Gross
Gross Requirements
Schedule
Figure 14.6 A
B C
5 6 7 8 9 10 11
40 50 15
Lead time = 4 for A Master schedule for A
S
B C
12 13 8 9 10 11
20 30 40
Lead time = 6 for S Master schedule for S
1 2 3 10 10
Master schedule for B
sold directly
Periods
Therefore, these are the gross requirements for B
Gross requirements: B 10 40+10=50 40 50 20 15+30=45
1 2 3 4 5 6 7 8
MRP Planning Sheet
Safety Stock
BOMs, inventory records, purchase
and production quantities may not
be perfect
Consideration of safety stock may
be prudent
Should be minimized and
ultimately eliminated
Typically built into projected
MRP Management
MRP is a dynamic system
Facilitates replanning when
changes occur
System nervousness can result
from too many changes
Time fences put limits on
replanning
Pegging links each item to its
Lot-Sizing Techniques
Lot-for-lot techniques order just
what is required for production
based on net requirements
May not always be feasible
If setup costs are high, lot-for-lot can
be expensive
Economic order quantity (EOQ)
EOQ expects a known constant
Lot-Sizing Techniques
Part Period Balancing (PPB) looks
at future orders to determine most
economic lot size
The Wagner-Whitin algorithm is a
complex dynamic programming
technique
Assumes a fnite time horizon
MRP in Services
Some services or service items
are directly linked to demand for
other services
These can be treated as
dependent demand services or
items
Restaurants
Uncooked linguini #30004 Sauce #3000 6 Veal #3000 5
MRP in Services
Chef; Work Center #1 Helper one; Work Center #2 Asst. Chef; Work Center #3 Cooked linguini
#20002 Spinach #20004
Prepared veal and sauce
#20003 (a) PRODUCT STRUCTURE TREE
Veal picante #10001
MRP in Services
(b) BILL OF MATERIALS
Part
Number Description Quantity MeasureUnit of costUnit 10001 Veal picante 1 Serving —
20002 Cooked linguini 1 Serving —
20003 Prepared veal and sauce 1 Serving —
20004 Spinach 0.1 Bag 0.94
30004 Uncooked linguini 0.5 Pound —
30005 Veal 1 Serving 2.15
MRP in Services
(c) BILL OF LABOR FOR VEAL PICANTE
Labor Hours Work Center Operation Labor Type Setup Time Run Time
1 Assemble dish Chef .0069 .0041
2 Cook linguini Helper one .0005 .0022
3 Cook veal
Enterprise Resource Planning
(ERP)
An extension of the MRP system
to tie in customers and suppliers
1. Allows automation and integration of many business processes
2. Shares common data bases and business practices
3. Produces information in real time
Coordinates business from
Enterprise Resource Planning
(ERP)
ERP modules include
Basic MRP
Finance
Human resources
Supply chain management (SCM)
Customer relationship
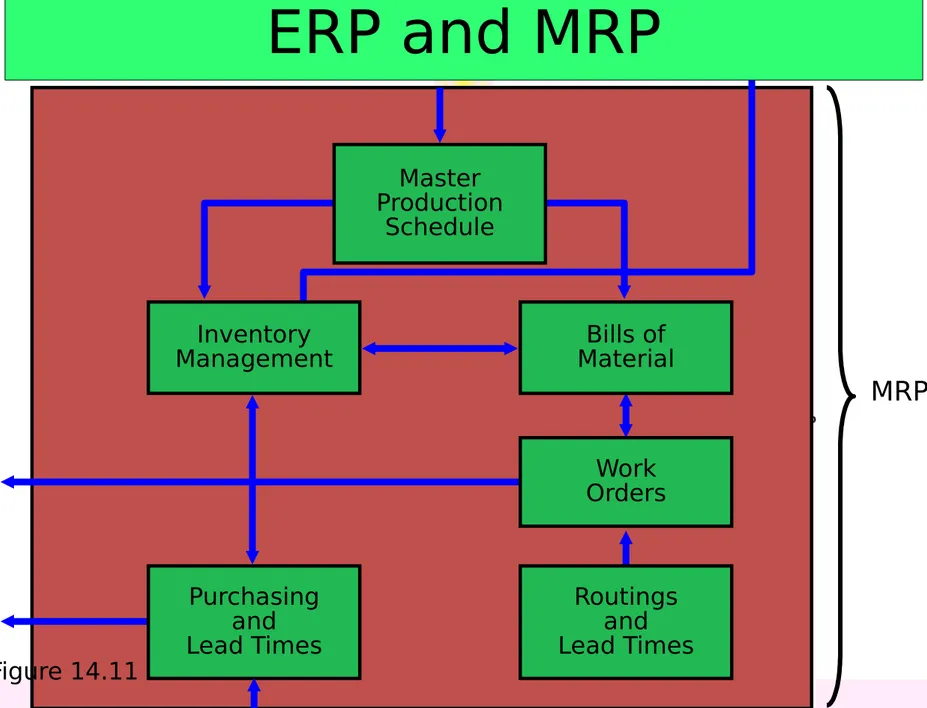
ERP and MRP
ERP and MRP
Figure 14.11
Customer Relationship Management
Invoicing
Shipping Distributors,
retailers, and end users Sales Order
Table 13.6
Bills of Material
Work Orders
Purchasing and Lead Times
Routings and Lead Times Master
Production Schedule
Inventory Management
ERP and MRP
Figure 14.11
ERP and MRP
Figure 14.11
Supply Chain Management
Vendor Communication
ERP and MRP
Figure 14.11Table 13.6
Finance/ Accounting
General Ledger Accounts Receivable
Payroll Accounts
Enterprise Resource Planning
(ERP)
ERP can be highly customized to
meet specifc business
requirements
Enterprise application integration
software (EAI) allows ERP systems
to be integrated with
Warehouse management
Logistics
Electronic catalogs
Enterprise Resource Planning
(ERP)
ERP systems have the potential to
Reduce transaction costs
Increase the speed and accuracy of
information
Facilitates a strategic emphasis on
Advantages of ERP Systems
1. Provides integration of the supply chain, production, and administration
2. Creates commonality of databases 3. Can incorporate improved best
processes
4. Increases communication and
collaboration between business units and sites
Disadvantages of ERP
Systems
1. Is very expensive to purchase and even more so to customize
2. Implementation may require major changes in the company and its
processes
3. Is so complex that many companies cannot adjust to it
4. Involves an ongoing, possibly never
completed, process for implementation 5. Expertise is limited with ongoing stafng
SAP’s ERP Modules
Figure 14.12
Cash to Cash
Covers all fnancial related activity:
Accounts receivable General ledger Cash management Accounts payable Treasury Asset management
Dock to Dispatch
Covers internal inventory management:
Warehousing Forecasting Physical inventory Distribution planning Replenishment planning Material handling
Promote to Deliver
Covers front-end customer-oriented activities:
Marketing
Quote and order processing Transportation
Documentation and labeling
After sales service Warranty and guarantees
Procure to Pay
Covers sourcing activities: Vendor sourcing Purchase requisitioning Purchase ordering Purchase contracts Inbound logistics Supplier invoicing/ matching Supplier payment/ settlement Supplier performance
Design to Manufacture
Covers internal production activities: Design Shop foor engineering reporting Production
Contract/project
engineering management
Plant Subcontractor maintenance
management
Recruit to Hire
Covers all HR- and payroll-oriented activity:
Example I
Sebuah perusahaan kayu yang membuat produk X menerima 2 pesanan, yaitu sebesar 100 unit yang harus selesai pada awal minggu ke-4 dan sebesar 150 unit yang harus selesai pada awal minggu ke-8. Produk X terdiri dari 4 unit bagian A dan 2 unit bagian B. Bagian A dibuat sendiri oleh perusahaan yang membutuhkan waktu selama 1 minggu.
Bagian B dipesan dari luar dengan lead time 2
minggu.Untuk merakit produk X dibutuhkan waktu 1 minggu. Persediaan bagian A ada 70 unit.
Tentukan rencana kebutuhan material untuk membuat produk tersebut,
a. Dengan metode lot for lot ordering
b. Dengan metode lot size ordering dengan ELS
produk A 470 unit dan ELS produk B 320 unit.workshe et
Example II
Demand Supra7th week: 15 units
X-Trim
8th week: 10 units.
IR , Lot Size & Lead Time
SUPRA: 5, lot4lot (1), 2
X: 5, 25, 1 F: 10, 30, 1 M: 0, 1, 1 W: 2, 12, 3