CHAPTER III
RESEARCH METHODOLOGY
This chapter presents the research methodology which is used as the
framework of this research. It involves the research design, population and
sample, time allocation, instruments used in this research, procedure of the
research, and procedure of data analysis.
Research Design
This research is a quantitative research which employs an experimental
research design. Experimental research design is a study which investigates the
effect of an independent variable on dependent variable (Gay, 1992). In an
experimental research design, there is a manipulated activity called treatment
which is believed to make difference or effect to the dependent variable.
Specifically, this research use a quasi-experimental research design. In this
research design, pre-test and post-test were provided to both experimental and
control group. However, unlike true-experimental research design, the
experimental and the control group in quasi-experimental design had already been
grouped before the research was conducted. As stated by Nunan (1992),
quasi-experimental research contains pre-test and post-test with quasi-experimental and
control groups but no random assignment of subjects.
The formulation of quasi-experimental research based on Cresswell (2003)
is presented in the following table:
Table 3.1
Pre-test Post-test Group Design
Group Pre-test Treatment Post-test
Experimental Group (A) O1 X1,X2,X3,X4,X5,X6 O2
Control Group (B) O1 Placebo-treatment O2
Note:
X : treatment for the experimental group
O2 : post-test of experimental and control groups
From the table, it can be seen that pre-test and post-test were given to both
experimental and control groups. Whereas the experimental group received TPRS
as the treatment, the control group received non-TPRS as the placebo-treatment.
Both of the group were given the treatment in six meetings.
Variables
A variable can be defined as an attribute of a person or of an object which
“varies” from person to person or from object to object (Hatch and Farhady (1982). Moreover, Nunan (1992) states that variable is anything which does not
remain constant.
In quasi-experimental research, there are two major types of variable to be
identified; independent and dependent variable. According to Hatch and Farhady
(1982) Independent variable is the variable which is selected, manipulated, and
measured by the researcher. Meanwhile, dependent variable is the variable which
is observed and measured to determine the effect of the independent variable.
In case of this research, the independent variable is Total Physical
Response Storytelling (TPRS) method, while the dependent variable is the
students’ listening score.
Population and Sample
A population is a theoretical group of all possible scores with the same
trait or traits (Collidge, 2000). According to Nunan (1992) population is a group
of people which share common, observable characteristics that differentiate them
from other groups. In case of this research, the population of this research was the
students of a Primary School in Sukabumi.
Meanwhile, a sample is a subset of individuals from a given population.
School. The students were divided into two classes that were labeled as
experimental and control groups.
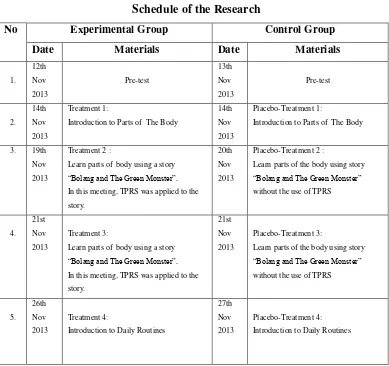
Time Allocation
The time allocation of this research was adjusted with the schedule that
already existed in the school. The research was conducted in eight meetings, the
pre-test, six times treatments, and the post-test. Both experimental and control
groups were given two meetings in a week. Hence, the research was done in one
month. In detail, the schedule of the research can be seen in the following table:
Table 3.2
Schedule of the Research
No Experimental Group Control Group
Date Materials Date Materials
Introduction to Parts of The Body
14th Nov 2013
Placebo-Treatment 1:
Introduction to Parts of The Body
3. 19th Nov 2013
Treatment 2 :
Learn parts of body using a story “Bolang and The Green Monster”. In this meeting, TPRS was applied to the story.
20th Nov 2013
Placebo-Treatment 2 :
Learn parts of the body using story “Bolang and The Green Monster” without the use of TPRS
4. 21st Nov 2013
Treatment 3:
Learn parts of body using a story “Bolang and The Green Monster”. In this meeting, TPRS was applied to the story.
21st Nov 2013
Placebo-Treatment 3:
Learn parts of the body using story “Bolang and The Green Monster” without the use of TPRS
5. 26th Nov 2013
Treatment 4:
Introduction to Daily Routines
27th Nov 2013
6. 28th Nov 2013
Treatment 5:
Learn Daily Routines using story “Bolang The Adventurer Boy”
In this meeting, TPRS was applied to the story
28th Nov 2013
Placebo-Treatment 5:
Learn Daily Routines using story “Bolang The Adventurer Boy” without the use of TPRS
Learn Daily Routines using story “Bolang The Adventurer Boy”
In this meeting, TPRS was applied to the story
4th Dec 2013
Placebo-Treatment 6:
Learn Daily Routines using story “Bolang The Adventurer Boy” without the use of TPRS
8. 5th Dec 2013
Post-test and administering questionnaire and interview.
5th Dec 2013
Post-test and administering questionnaire and interview.
Instruments
Instrument is a device (such as test, questionnaire, or rating scale) the
researcher uses to collect data (Fraenkel, 2006). The test instrument included
pre-test, post-pre-test, and questionnaire. Both pre-test and post-test were given to
experimental and control group. Pre-test was intended to measure the students’
ability before the treatments and to ensure that both control and experimental
group had the equal ability. Meanwhile, post-test was conducted after the
treatments to find out the effect of Total Physical Responses Storytelling in
improving the students’ listening skill. The pre-test and post-test were provided in multiple choice. The questions in pre-test and post-test were different. It was to
avoid the students remembering the answers. However, the level of difficulty was
still equal
In order to answer the second question of this research, questionnaire
technique was used. The questionnaire was conducted only to experimental group.
responses toward the use of Total Physical Response Storytelling in improving
their listening skill. Refer to appendix to see the questions of the questionnaire.
Research Procedures
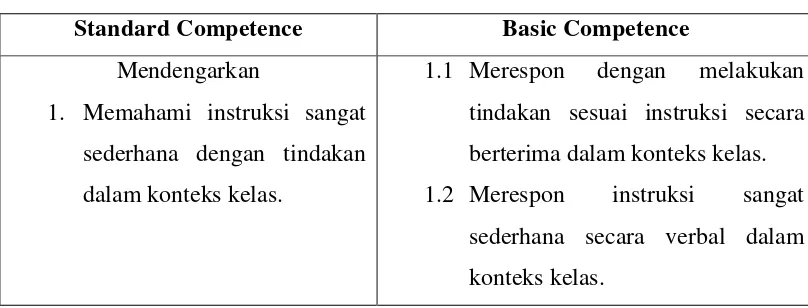
The first step in conducting this research was preparing and creating the
lesson plan. The lesson plan for this research was adjusted with the Standard
Competence and Basic Competence of English (listening) for grade 4 students:
Table 3.3
English Syllabus
Standard Competence Basic Competence
Mendengarkan
1. Memahami instruksi sangat
sederhana dengan tindakan
dalam konteks kelas.
1.1 Merespon dengan melakukan
tindakan sesuai instruksi secara
berterima dalam konteks kelas.
1.2 Merespon instruksi sangat
sederhana secara verbal dalam
konteks kelas.
After the Standard Competence and Basic Competence had been analyzed,
the lesson plan was then created. The lesson plan used Total Physical Response
Storytelling. The activities, materials, and stories used in the lesson plan had been
suited with the level of 4 grade students as well. The lesson plan presented in
Appendix.
The next step was preparing the instruments to be used in collecting data.
The instruments were pre-test, post-test, and interview. However, before
distributing the instruments, a pilot test was conducted to see the reliability and
validity of the pre-test. Pilot testing is important to ensure that the instruments
used are valid and reliable. In this research, pilot test was conducted to a class of
grade 4 students who were not assigned as experimental and control group. The
As soon as the instrument was ready, the pre-test was given to both
experimental and control group. The result of pre-test was very crucial in order to
know the students’ ability before the treatments. Moreover, it was also to ensure
that the students in experimental and control group had equal ability.
The treatments were given in six meetings to the experimental group only.
The treatments were presented using Total Physical Response Storytelling in
different materials and various activities. It was to prevent the students from
feeling bored with the lesson.
After the treatments, the post-test (see Appendix) were then conducted to
experimental and control group. The result of post-test was used to determine the
effect of Total Physical Responses Storytelling in improving the students’
listening skill. Moreover, it was also intended to find out the significance of the
effect.
Lastly, in order to answer the second question of the research,
questionnaire technique was employed. Questionnaire was conducted to
experimental group. The questionnaire was then analyzed to see the responses of
the students toward TPRS. Furthermore, the result of the questionnaire was
presented in the next chapter.
Data Analysis
Test Instrument Analysis
In order to get the valid data collection, the instruments used in the
research has to be valid and reliable. It was supported by Nunan (1992) who said
that to be valid in data collection, every procedure used in collecting data has to
have acceptable validity and reliability. Hence, the validity and reliability of the
instruments of this research were tested through pilot test.
1.7.1.1Validity Analysis
Following Fraenkel&Wallen (1990), an instrument is valid if it measures
was tested using a statistical tool named Karl Pearson Product-Moment. In detail,
the formulation of Pearson Product-Moment can be seen as follows:
Note:
rxy = index correlation
n = number of students
x = total score of each item
y = total score of all student
The data were computed using computer software named Anates V4
and SPSS 18. The computation result was then analyzed to decide if the question
is valid or not. The decision was made by considering the criteria of the
coefficient correlation by Arikunto (2006).
Table 3.4
The Criteria of the Coefficient Correlation (Arikunto, 2006)
Coefficient Interval Interpretation
pre-test, post-test, and questionnaire, AnatesV4 and SPSS 18 were employed.
Furthermore, followingKranzler&Moursand (1999), the reliability value was also
compared to r table to find out the level of reliability.
Pre-Test Data Analysis
1.7.1.1Independent t-test
Pre-test was conducted before treatments to ensure that both control group
and experimental group had relatively equal ability in listening comprehension.
The result of pre-test was analyzed using SPSS 18. The statistical tool which was
used is Independent T-test. The following is the formula of Independent t-test:
� = �̅ − �̅
√[∑ � − ∑ ��� + � −+ ∑ � − ∑ �� ] . [� + � ]
�̅ = the mean of the scores of the first group
�̅ = the mean of the scores of the second group
∑ � =the sum of the squares of the first group
∑ � = the sum of the squares of the second group ∑ � = the square of the sum of the scores of the first group
∑ � = the square of the sum of the scores of the second group
� = the total number of the scores in the first group
� = the total number of the scores in the second group
Normality Test
Normality test was conducted to ensure that the distribution of scores in
the data was normal. To compute the normality of the pretest,
Kolomorgov-Smirnov test in SPSS 18 for windows was employed
Variance Homogeneity Test
Variance homogeneity test was conducted to ensure that the two groups
The variance homogeneity in this pretest then was computed using Levene
formula in SPSS 18 for windows.
Post-test Data Analysis
The data collected from posttest of both groups were analyzed using the
same procedure as pretest which involved Independent t-test, normal distribution
test, and variance homogeneity test. It could be identified then whether there was
a difference between the listening scores of control and experimental group.
Moreover, to find out whether there was a significant difference between
pretest and posttest in each group, a statistical tool which was dependent t-test was
employed. The dependent t-test score was computed using SPSS 18. Meanwhile,
the formulation of dependent t-test is as follows:
� = �̅ − �̅
√∑ � − ∑ ��
� � −
�̅ = the mean of the pre-test score
�̅ = the mean of the post-test score
∑ � = the sum of the squares of the differences between the pre-test and post- test scores
∑ � = the square of the sum of the differences between the pre-test and post- test scores
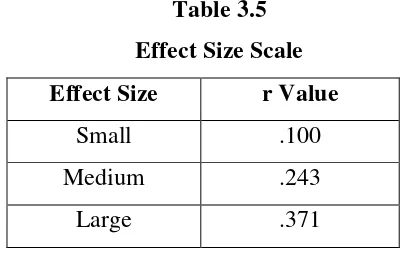
Meanwhile, to measure how significant the effect of treatments to
experimental group, it is important to calculate the effect size (Collidge, 2000).
The following is the formulation of effect size:
� = √� + ���
r = effect size
Table 3.5
Effect Size Scale
Effect Size r Value
Small .100
Medium .243
Large .371
Data Analysis of Questionnaire
Questionnaire was intended to find out students’ responses toward the use
of TPRS in improving their listening skill. The data from questionnaire then were
analyzed and calculated in percentage using SPSS 18 for windows. Moreover, the