CHAPTER III
RESEARCH METHODOLOGY
This chapter presents the procedure in conducting the study. It covers research design include variables; research hypotheses; population and sample; data collection include research location and instrument; and data analysis.
3.1 Research Design
In conducting the research, the quantitative research was applied using quasi experimental as the research design. In this design, the particpants were choosen randomly. According to Creswell (2012), “the most rigorous approach of experimental design is to randomly assign individuals to the treatments” (p. 296). Further, the random assignment deals with random selection. Creswell (2012) states that “quantitative researchers randomly select a sample from a population” (p. 297).
Therefore, there were two groups taken in this research. The first group was experimental group and the second group was control group. The experimental group was given cooperative learning as the teaching method and control group was given the traditional method. Both groups got the pretest and posttest. Below is a quasi-experimental design developed by Creswell (2012, p. 310).
Table 3.1
Quasi-Experimental Design
Pre- and Posttest Design Time
Select Control Group Pretest No Treatment Posttest Select Experimental
Group
Pretest Experimental Treatment
Posttest
3.1.1 Variables
In this quasi experimental research, two variables were used. The variables were independent variable and dependent variable. In this research, the tests were used to measure the students’ writing ability. These tests were aimed to discover the effect of cooperative learning method. Therefore, the dependent variable was the improvement of students’ writing ability and the independent variable was the use of cooperative learning method to improve students’ writing ability.
3.2 Research Hypotheses
Hypothesis is an idea or explanation that researchers then test through study and experimentation (vocabulary.com). According to Sugiyono (2011), the research that formulates hypothesis is the research in which using the quantitative method (p. 64). Thus, this research took null hypothesis (H0) and alternative hypothesis (H1). The hypotheses formulated in this study are:
H0 : There is no significant difference between the posttest mean score of the control and experimental group after the treatment.
H1 : There is significant difference between the posttest mean score of the control and experimental group after the treatment.
3.3 Population and Sample
In this research, the random sampling technique was used based on the knowledge explained by Creswell (2012) who states that “quantitative researchers randomly select a sample from a population” (p. 297). Furthermore, “quasi -experiments include assignment, but not random assignment of participants to groups. This is because the experimenter cannot artificially creating groups for the experiment” (Creswell, 2012, p. 309). Based on the explanations, the research may require using existing classes and designating one as the experimental group and one as the control group. Creswell (2012) adds that in quasi-experimental design, “randomly assigning students to the two groups would disrupt classroom learning” (p. 309).
and XI IIS 3. The classes were chosen based on the writer’s experience on teaching the class which was assumed that the students were more responsive and had not significantly different ability. Also, based on students’ score in the last semester. Class XI MIA 1 was taken as experimental group and class XI IIS 3 as the control group. The total of samples were 58 students, 32 students from class XI MIA 1 and 26 students from XI IIS 3.
3.4 Data Collection
3.4.1 Research Location
This study took place in one high school in Bandung which was located relatively near the downtown in Bandung. The purpose of choosing this school in general because it was the school where the researcher took PPL program. Specifically, the purposes were to see how cooperative learning method can influence students’ writing ability, also to know students’ responses on the implementation of cooperative learning method.
3.4.2 Instrument and Material
There were three techniques of data collection for this research namely pretest, posttest, and questionnaire.
Pretest and posttest were conducted in order to know students’ writing score before and after treatment using the cooperative learning method. The tests were given to experimental and control group. While the questionnaire was conducted in order to observe students’ response to the use of cooperative learning method in the writing class. The questionnaire was only given to the experimental group.
3.5 Research Procedure
This research was conducted in seven steps, those were designing lesson plan, organizing the research instruments, administering the pilot test, administering the pretest, teaching and learning process, posttest, and conducting questionnaire.
3.5.1 Designing Lesson Plan
Before conducting the treatment, the lesson plan had been designed. According to Brown (2000, p. 152) there were two steps in designing lesson plan, those were selecting appropriate materials and organizing the teaching procedures. In selecting appropriate materials step, the procedural text was chosen. The materials of procedural text were given to both experimental and control group. However, the teaching procedure for both groups was different. The experimental group was given the treatment used cooperative learning method, while the control group used traditional method.
3.5.2 Organizing the research instruments
To administer the further research, the research instruments had been organized. In organizing the research instrument, all the aspects from experts’ theories were used. There were three research instruments which had been organized, those were pretest and posttest instrument, and questionnaire. The pre- and posttest instruments were consisted of one question of writing assignment. In the test, the students were asked to write a passage about procedural text. While the questionnaire was consisted of 15 close-ended questions in a form of Likert 4-scale responses. The 4 responses presented in the questionnaire were labeled as “Strongly Agree”, “Agree”, “Disagree” and “StronglyDisagree”.
3.5.3 Administering the pilot test
administering a test. He said that “a test which does not have face validity may not be accepted by candidates, teachers, education authorities or employeers” (p. 33).
The test measured how successful the research instruments could be applied for the further research. In the test, the students were asked to write a simple procedural text in a form of instruction or direction. The test was conducted on Monday, September 7, 2015.
3.5.4 Administering the pretest
After doing the pilot test and the result showed the properness of the research instruments, the pretest was given to both control group and experimental group. This test was given in order to know students’ primary knowledge and to find the initial scores of control group and experimental group. Besides, this test was aimed to make sure that the two groups were not significantly different in their ability before treatment.
3.5.5 Teaching and Learning Process
Teaching and learning process in this research was the main step of collecting the data. This step was conducted after the pilot test and pretest were done. In experimental class, cooperative learning method was used as the teaching method. While in control class, the learning process was running as usual without cooperative learning method.
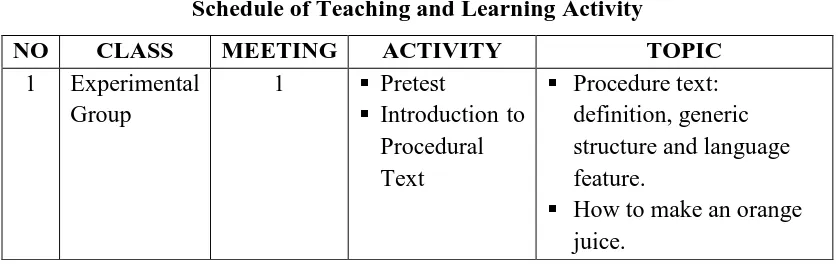
Teaching and learning process were conducted in 3 weeks and hold 3 meetings for each class. The topics of each meeting for both classes were scheduled as follows.
Table 3.2
Schedule of Teaching and Learning Activity
NO CLASS MEETING ACTIVITY TOPIC
1 Experimental Group
1 Pretest
Introduction to Procedural Text
Procedure text: definition, generic structure and language feature.
How to plant Jasmine Wednesday. Time allocation of each meeting was 90 minutes. Each meeting had three stages; pre, while, and post activity. Besides, the learning activity was also including the five stages of learning as arranged in the 2013 curriculum’s rule, namely observing, questioning, exploring, associating, and communicating.
From the table above, it could be seen that in the first meeting, the students in the experimental and control group were given the pretest and the introduction material of procedural text. In this activity, the students were taught about the definition, generic structure, and language features of the procedural text. Besides, the students were also given the example of the text. In the second meeting, the students in both groups were still given the stimulation and more information about the material. While in the third meeting, the students were having the posttest to examine how successful they could master the material.
meeting, the students did the reflections of the group work they had done, and the teacher gave feedback for a better performance. Meanwhile, in the control group, teaching and learning were conducted without a special method. The students worked individually without discussing or sharing with group. The students were forced to pay attention to the teacher’s explanation and did all the assignments individually.
3.5.6 Posttest
After the treatment had been done, posttest was given to all the respondents. This test was aimed to find out students’ final score after getting the treatment. As in pretest, this test also required the students to wrote a procedural text in a good order and structured.
3.5.7 Conducting Questionnaire
The final data collection process was conducting qustionnaire. In conducting questionnaire, the respondents were required to answer the 15 close-ended questions in a form of Likert scale. A “Likert scale” is the sum of responses to several Likert items. A common form of likert data was using 5-scale response, the data were labeled as “Strongly disagree, Disagree, Neutral, Agree, Strongly agree.”
in odd-numbered scales the researchers may not be collecting accurate responses knowing that respondents can assign their own meaning to the mid‐point.
However, the odd-numbered scale still could be used since it also had the positive values. Losby & Wetmore (2012) state that “the decision to go with odd or even can be informed by concerning the purpose, topic, and respondents of the research.”
Based on the explanation above, this study used the 4-point rating of Likert scale which was aimed to avoid the neutral responses. The consideration of using that scale also strengthened by the statement from Johnson (2006):
“Omitting the center point on a rating scale (e.g., using a 4-point rather than a 5-point rating scale) does not appreciably affect the response pattern. Some researchers prefer 5- point rating scales; other researchers prefer 4-point rating scales. Both generally work well” (Johnson, 2006).
Thus, in answering the questions, the respondents had to cirle one response for each item which represents his/her feelings and experiences during the class treatment. This test was only given to the experimental group as the recipient of cooperative learning treatment.
3.6 Data Analysis
To collect the data, the instruments used were pretest, posttest, and questionnaire. It took 3 weeks in collecting the data, start from 31st of August 2015 until 20th of September 2015. After the data needed was collected, the data analysis would be presented as follows.
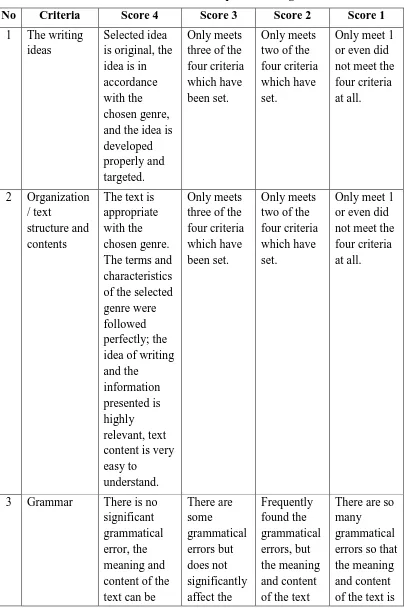
3.6.1 Scoring Technique
Table 3.3
The criteria and technique of scoring
understood
4 Vocabulary The sentences are very
Adapted from: BSE Kemendikbud (2014)
3.6.2 Pilot Data Analysis
Further, the questionnaire was also given to the sample group in pilot test. This test was given in order to know the properness of the questionnaire for further research. Therefore, the validity and reliability test using the SPSS 20 for Windows was used to calculate students’ response on the questionnaire. The result of data calculation would show whether the instrument was valid or not.
3.6.3 Pretest and Posttest Data Analysis
Pretest and posttest was given to the control and experimental group. Then, the students’ scores gathered from both tests were computed using SPSS 20 for Windows. In calculating the result, the analysis had to follow several steps; those were normality distribution test, independent t-test, dependent t-test, and effect size. The further details of statistical procedure were explained as follows:
3.6.3.1Normality Distribution
In this research, Kolmogorov-Smirnov and Shapiro-Wilk test were used to calculate the normality distribution through SPSS 20 for Windows. “This test for normality is based on the maximum difference between the observed distribution and expected cumulative-normal distribution” (NCSS.com, p.2). To make the research easier, some steps in conducting Kolmogorov-Smirnov test were developed. The first step was stating the hypotheses as follows:
H0 : the score of experimental and control group are normally distributed. H1 : the score of experimental and control group are not normally
distributed.
alternative hypothesis was accepted. It means the score of the experimental and control group were not normally distributed.
3.6.3.2Independent t-test
The independent t-test was conducted to investigate the significant difference between the two groups. Further, as cited in Purnamasari (2014) the test was also aimed to analyze relevant relationship between the independent variable (treatment) and the dependent variable (improvement of students’ writing ability) which was measured on the experimental and control group. Then, the four steps in calculating independent t-test were developed. The first step was stating the hypotheses as follows:
H0 : there is no significant difference between the posttest mean score of control and experimental group after the treatment.
H1 : there is significant difference between the posttest mean score of control and experimental group after the treatment.
The second step was setting the alpha level at 0.05. The third step was analyzing the score using independent t-test through SPSS 20 computation. The last step was interpreting the result. The interpretation was done by seeing the score asymp. Sig, if the result ≥ 0.05, the null hypothesis was accepted and alternative hypothesis was rejected. It means that there was no significant difference between the posttest mean score of control and experimental group after the treatment. Meanwhile, if the result < 0.05, the null hypothesis was rejected and alternative hypothesis was accepted. It means that there was significant difference between the posttest mean score of control and experimental group after the treatment.
3.6.3.3Dependent t-test
H0 : there is no significant difference between pretest and posttest score after giving the treatment.
H1 : there is significant difference between pretest and posttest score after giving the treatment.
The next step was selecting the alpha level at 0.05. The third step was analyzing the score using dependent or paired t-test in SPSS 20. The last step was comparing the result with the alpha score to test the hypotheses. If the score of asymp. Sig ≥ 0.05, the null hypothesis was accepted and alternative hypothesis was rejected. It means that there was no significant difference between pretest and posttest score after giving the treatment. Meanwhile, if the score of asymp. Sig < 0.05, the null hypothesis was rejected and the alternative hypothesis was accepted. It means that there was significant difference between pretest and posttest score after giving the treatment.
3.6.3.4Effect Size
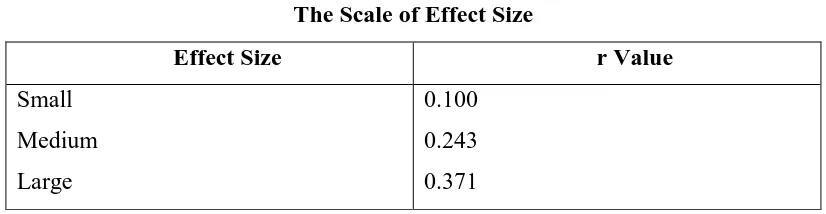
According to Coolidge (2000, as cited in Purnamasari, 2014) the calculation of the effect size was aimed to find out the effect of the influence of independent variable (the use of cooperative learning) upon the dependent variable (the improvement of students’ writing ability) (p. 36). The result of the test will determine how strongly the treatment affected the students’ improvement. The formula of effect size is:
√
(Coolidge, 2000) r = effect size
t = t value from the independent t-test df = degree of freedom (N1+N2-2)
Table 3.4
The Scale of Effect Size
Effect Size r Value
Small Medium Large
0.100 0.243 0.371
(Coolidge, 2000)
3.6.4 Questionnaire Data Analysis
After administering the questionnaire, the data analysis was done by using the formula percentage through SPSS 20 for Windows. There were several steps in calculating the data, those are:
1. Setting variable 2. Inputting data
3. Computing data frequencies 4. Presenting the data into graphs
In setting variable, the data gathered from students’ answers on questionnaire were identified based on the variables. The variables emerged from the questionnaire were amount of respondents and the answers. The answer labeled “Strongly Agree” was scored 4, while “Agree” was scored 3, “Disagree” was scored 2 and “Strongly Disagree” was scored 1.
After that, the scores were inputted to SPSS data view, and then the data was computed using the frequencies data formula. Finally, the data frequencies gained from the computation were presented into graphs in order to clarify the data presentation.
3.7 Concluding Remark