www.elsevier.com / locate / bres
Interactive report
Population coding in spike trains of simultaneously recorded retinal
1ganglion cells
a ,
*
a b c´
¨
Eduardo Fernandez
, Jose-Manuel Ferrandez , Josef Ammermuller , Richard A. Normann
a
´
Department of Histology and Institute of Bioengineering, Fac. Medicina, University Miguel Hernandez, San Juan 03550, Alicante, Spain
b
Department of Biology, University of Oldenburg, Oldenburg, Germany
c
Department of Bioengineering, University of Utah, Salt Lake City, UT, USA
Accepted 16 October 2000
Abstract
To achieve a better understanding of the parallel information processing that takes place in the nervous system, many researchers have recently begun to use multielectrode techniques to obtain high spatial- and temporal-resolution recordings of the firing patterns of neural ensembles. Apart from the complexities of acquiring and storing single unit responses from large numbers of neurons, the multielectrode technique has provided new challenges in the analysis of the responses from many simultaneously recorded neurons. This paper provides insights into the problem of coding / decoding of retinal images by ensembles of retinal ganglion cells. We have simultaneously recorded the responses of 15 ganglion cells to visual stimuli of various intensities and wavelengths and analyzed the data using discriminant analysis. Models of stimulus encoding were generated and discriminant analysis used to estimate the wavelength and intensity of the stimuli. We find that the ganglion cells we have recorded from are non-redundant encoders of these stimulus features. While single ganglion cells are poor classifiers of the stimulus parameters, examination of the responses of only a few ganglion cells greatly enhances our ability to specify the stimulus wavelength and intensity. Of the parameters studied, we find that the rate of firing of the ganglion cells provides the most information about these stimulus parameters, while the timing of the first action potential provides almost as much information. While we are not suggesting that the brain is using these variables, our results show how a population of sensory neurons can encode stimulus features and suggest that the brain could potentially deduce reliable information about stimulus features from response patterns of retinal ganglion cell populations. 2000 Elsevier Science B.V. All rights reserved.
Theme: Sensory systems
Topic: Retina and photoreceptors
Keywords: Neural coding; Visual system; Retina; Neural ensembles; Discriminant analysis; Multineuronal recording
1. Introduction order to understand the coding, decoding, and information processing that occurs in the brain, many researchers are Most of the current knowledge about neurons and their beginning to use techniques that allow them to perform functional properties has been based on single sequential simultaneous recordings of multi-neuronal activity. New recordings of their responses using microelectrode tech- imaging technologies such as multi-channel optical imag-niques. Although these tools have been very useful for ing [3,13,15,17] and multi-site extracellular electrode understanding the cellular and molecular mechanisms arrays [5,7,18,19,24,26,29,33,34,36] are being employed in underlying cell biophysics, it is clear that sensory and order to record neural responses at many sites simul-motor information is processed in a parallel fashion by taneously. While the use of extracellular electrode arrays populations of neurons working in concert [6,28]. Thus, in allows imaging of multineuronal responses with unpre-cedented spatial and temporal resolution, the development of tools used to analyze this multi-neuronal activity is
1
Published on the World Wide Web on 7 November 2000.
generally lagging behind the development of the tools used
*Corresponding author. Tel.: 134-96-591-9439; fax: 1
34-96-591-to acquire this data.
9434.
´
E-mail address: [email protected] (E. Fernandez). One of the basic tools that has been used for the analysis
E. Fernandez et al. / Brain Research 887 (2000) 222 –229 223
of simultaneous recordings of neuronal cells is cross- 2. Methods
correlational analysis [12,24,37,41]. This approach has
mainly been useful for the analysis of synaptic connectivi- 2.1. Experimental procedures ty using pairs of spike trains [41] and for the separation of
individual neurons in multi-unit spike trains [24], but it Extracellular ganglion cell recordings were made in the cannot be directly used to obtain details about the im- isolated superfused turtle Pseudemys scripta elegans retina portant response features used in the stimulus discrimina- using an array of 100, 1.5-mm long electrodes as reported tion task. Other approaches, such as artificial neuronal previously [9,30,34]. After enucleation of the eye, the networks, are able to deal with data from large populations eyeball was hemisected with a razor blade, and the cornea of neurons [9,23,34,38,40], but their behavior is highly and lens were separated from the posterior half. The retinas dependent upon the models chosen. This dependency were isolated from the pigment epithelium and mounted on limits the application of artificial neural networks to the a glass slide photoreceptor side down. The retina was then realistic analysis of simple ensembles or to the non- superfused with ringer solution [32] and the electrode array mechanistic analysis of complex systems. These tech- was lowered into the tissue.
niques have been used to demonstrate that a population The electrode arrays contained 100 electrodes, and were code can provide a more accurate prediction of perform- built from silicon on a square grid with a 400mm pitch as ance than the individual elements that constitute the described elsewhere [16]. The distal 50mm of the needles, population [9,22,23]. However, these approaches do not metallized with platinum, form the active site of each provide a direct way to study how a population of neurons electrode. The remaining parts of the silicon array were can collectively represent the complexities of a multi- insulated with polyimide. Impedance measurements were dimensional stimulus like that used to excite the retina in performed on the electrode array prior to each experiment
this study. to insure ensure the integrity of the polyimide coating. The
This paper explores the question of how an ensemble of electrode array was connected to a 100-channel amplifier retinal ganglion cells might encode the wavelength and (low and high corner frequencies of 250 and 7500 Hz) and intensity of a variety of full field monochromatic stimuli. a digital signal processor based data acquisition system Specifically, the broad and highly overlapping spectral [14]. For the present experiments, light stimuli were sensitivity curves of the cone photoreceptors, and their produced from a 100-W tungsten lamp. Flashes with a sigmoidal shaped intensity–response curves cause stimulus duration of 0.2 s, followed by a 0.24-s period of darkness, wavelength and intensity to be dependent variables. As the were used as typical stimuli. Wavelength selection (400, intensity of a monochromatic stimulus is changed, the 450, 488, 514, 546, 577, 600, 633 and 694 nm) were differential excitation of the three classes of cone photo- achieved with narrow band interference filters, and inten-receptors changes, changing the perceived hue and satura- sities were controlled with neutral density filters. They tion of the stimulus. Thus, how groups of retinal ganglion were changed in steps of 0.5 log units from maximum cells encode a broad range of colors of differing intensities intensity down to24.0 log relative intensity, depending on is a challenging and unresolved question. the exact experiment. For each wavelength, the intensities Although the visual scene is conveyed to the brain in were measured with a calibrated photodiode and expressed parallel by the spike trains of all ganglion cells, most of as log relative intensity. Maximum quantum fluxes (log. what we know about retinal cell signaling is derived from rel. int.50) at the different wavelengths were: 400 nm,
13 2 13
recordings of single retinal ganglion cells (see Ref. [23] for 1.3310 quanta / s per cm ; 450 nm, 1.8310 quanta / s
2 13 2
a review). The assumptions underlying this hypothesis are per cm ; 488 nm, 1.7310 quanta / s per cm ; 514 nm,
13 2 13
that the population code can be understood from the 0.7310 quanta / s per cm ; 546 nm, 1.2310 quanta / s
2 13 2
analysis of single cell responses, and that the brain decodes per cm ; 577 nm, 1.6310 quanta / s per cm ; 600 nm,
13 2 13
the stimulus features from the simultaneous firing of many 0.8310 quanta / s per cm ; 633 nm, 1.1310 quanta / s
2 13 2
neurons in the ganglion cell population that essentially per cm ; 694 nm, 1.3310 quanta / s per cm . The operate independently of each other. Whether or not background was complete darkness. Each set of stimuli ganglion cells act as independent encoders is important was presented 8 times.
because it bears on the experimental strategy one might The electrode array was lowered into the retina, and use to deduce the retinal code. Thus the specific questions when responses were recorded on a maximal number of addressed in this study were: (1) how does the ability to electrodes, the array’s position was fixed. While stable estimate stimulus features based on populations of gang- recordings could be made using this preparation in retinas lion cells compare with estimation based on single cells? that had been isolated for over 8 h, the retinas used for and (2) what response features are most important in these experiments were typically limited to 4 h post-estimation of stimulus wavelength and intensity?. We isolation. In each experiment we recorded neural activity investigate these questions with the use of discriminant from about 80–90 electrodes. In general, multi-unit signals analysis, a tool developed to reveal complex dependencies were obtained from most of the electrodes and often single
13–15 prototypes which were unequivocal in terms of both can be computed. They are all uncorrelated with each other amplitude and shape [9,30]. All the selected channels of and maximize the ratio of between groups to within groups data plus one stimulus channel were digitized with a sums of squares. The first function
commercial multiplexed data acquisition system (Bionic
Z15W X11 11W X12 21 ? ? ? 1W X1p p1C Technologies, Salt Lake City, UT) and stored in a
Pen-tium-based class computer. A custom analysis program gives the maximum possible difference between groups. sampled the incoming data at 30 kHz, plotted the The second one,
waveforms on the screen, and stored the record for later
analysis. Z25W X21 11W X22 21 ? ? ? 1W X2p p1C
captures as much as possible of the group differences not 2.2. Discriminant analysis
displayed by Z ; Z reflects as much as possible of the1 3 group differences not displayed by Z and Z ; and so on.1 2 Canonical discriminant analysis was carried out on
The hope is that the first few functions are sufficient to simultaneously recorded neuronal spike activity
(extracel-account for almost all the important group differences. lular action potentials) in order to classify the luminosity,
Thus, information contained in multiple independent vari-chromaticity and temporal aspects of the light stimuli that
ables is summarized in a single index, called discriminant evoked the responses. From each individual presentation of
score, and serves as the basis for assigning cases to groups. the light stimuli, the number of spikes and the time of
It should be stressed that usually the discriminant occurrence time of each spike were extracted for each of
functions fit the sample from which they have been derived the identified and classified single units using a
custom-better than they will fit another sample from the same designed program. For the present study we only used the
population. Thus, the percentage of cases classified cor-number of spikes during the light-ON period (mean rate),
rectly by the discriminant functions is an inflated estimate the timing of the first and the second spike relative to the
of the true performance in the population [31]. To over-stimulus onset, and the time interval between the first two
come this bias we have used what is called ‘jackknife spikes as the discriminant variables. We did not use
classification’. It involves allocating each individual light information from any other spikes evoked by the stimulus,
presentation to its closest group without using that in-because under our stimulus conditions, many responses
dividual (but the remaining n21 cases) to calculate the showed at most two spikes after light onset. This procedure
discriminant functions, and then classify the left out case. resulted in a data vector of 60 quantitative variables (four
Since the case which is being classified is not included in variables315 cells) for each light presentation. Two
addi-the calculation of addi-the functions, addi-the observed misclassifica-tional elements, coding wavelength (nine categories) and
tion rate is a less biased estimate of the true one. intensity (nine categories) were also included in the data
All the statistical analysis were performed using the set.
SPSS / PC 8.0 software package (SPSS). Whereas detailed discussion of discriminant analysis and
its application to the analysis of spike trains is available elsewhere [1,8,20,27,31,35], here we briefly describe for
3. Results
those unfamiliar with the technique, the basis of the method we have used throughout this study for those
For many stimulus conditions and many ganglion cells unfamiliar with the technique. Discriminant analysis
al-only a few spikes were evoked in response to light-ON. lows us to effectively separate two or more groups of
Fig. 1 shows an example of simultaneously recorded individuals (stimulus parameters in this study), given
responses from 15 electrodes to eight consecutive flashes measurements of several variables for these individuals.
of 633 nm, 2.6 mm diameter, log. relative intensity5 20.5. The usual approach involves taking a linear combination of
For each electrode, close inspection of the firing patterns to the X variables
repeated identical stimuli, showed some degree of vari-Z5W X1 11W X2 21 ? ? ? 1W Xp p1C
ability, introducing uncertainty in the code. Thus it seems where the W , W , . . . W1 2 p are discriminant coefficients very unlikely that the features of a visual stimulus can be reflecting the unique contribution of each variable (X ,1 derived exclusively from the activity of single ganglion X , . . . X ) to the classification task and C is a constant.2 p cells. This suggests that the concerted activity of many Groups can be well separated using Z if its mean value cells rather than individual activity of single neurons is changes considerably from group to group, with the values encoding visual stimulus features.
E. Fernandez et al. / Brain Research 887 (2000) 222 –229 225
Fig. 1. Example of simultaneously recorded extracellular responses from 15 ganglion cells to eight consecutive and identical flashes of 633 nm, 2.6 mm diameter, intensity equal to 0.5 units of attenuation. The top trace shows the timing of light stimulus.
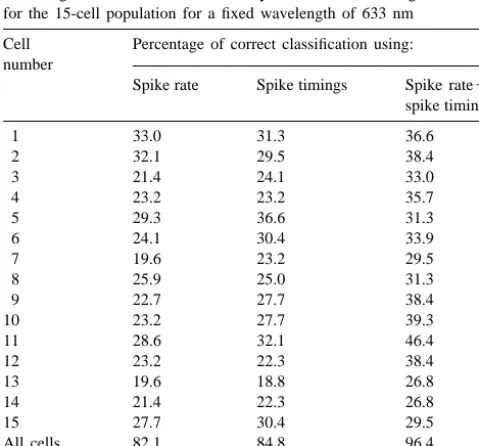
correct stimulus intensity discriminations in a typical although to a varying degree. All of the units were above experiment when the wavelength is kept constant. Correct chance level (12.5% in this case, since eight intensities classification using various coding models to estimate the were tested) and relatively good classification scores were intensity of the stimuli are showed separately. On average, achieved by using spike rate, spike timings or spike rate1
all single units were far below ideal discrimination, spike timings.
When we analyze all the recordings together, not one at a time, the discrimination improved significantly achieving
Table 1
96.4% correct discrimination when all the variables were
Percentage of correct stimulus intensity classification for single cells and
used (Table 1). For this classification, the analysis
ex-for the 15-cell population ex-for a fixed wavelength of 633 nm
tracted seven discriminant functions (one less than the
Cell Percentage of correct classification using:
number of intensities being classified). Table 2 displays the
number
amount of variance explained accounted for by each
Spike rate Spike timings Spike rate1
spike timings discriminant function. It can be seen that the first dis-criminant function accounts for 52.8% of the variance. The
1 33.0 31.3 36.6
second function contributes with an additional 21.2% of
2 32.1 29.5 38.4
3 21.4 24.1 33.0 the variance and so on. Thus, the first three discriminant
4 23.2 23.2 35.7 functions taken together were able to explain most of the
5 29.3 36.6 31.3
observed variance (86.4%). Table 2 also shows for each
6 24.1 30.4 33.9
discriminant function the eigenvalue or ratio of between
7 19.6 23.2 29.5
groups to within groups sums of squares and the canonical
8 25.9 25.0 31.3
9 22.7 27.7 38.4 correlation that represents the proportion of total variability
10 23.2 27.7 39.3 ‘accounted for’ by differences between groups.
11 28.6 32.1 46.4
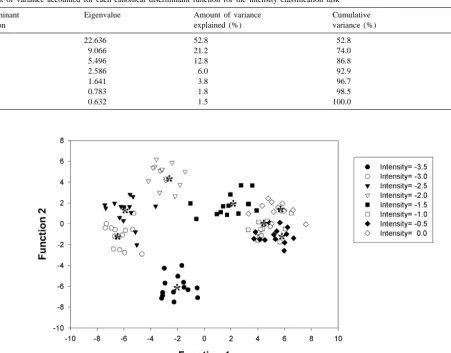
To see how much different groups overlap and to
12 23.2 22.3 38.4
examine the distribution of the discriminant scores, it is
13 19.6 18.8 26.8
useful to plot the discriminant function scores for the
14 21.4 22.3 26.8
15 27.7 30.4 29.5 groups. Fig. 2 plots 112 light presentations with a fixed
All cells 82.1 84.8 96.4 wavelength of 633 nm against their values for the first two, together
Table 2
Amount of variance accounted for each canonical discriminant function for the intensity classification task
Discriminant Eigenvalue Amount of variance Cumulative Canonical
Function explained (%) variance (%) correlation
1 22.636 52.8 52.8 0.979
2 9.066 21.2 74.0 0.949
3 5.496 12.8 86.8 0.920
4 2.586 6.0 92.9 0.849
5 1.641 3.8 96.7 0.788
6 0.783 1.8 98.5 0.663
7 0.632 1.5 100.0 0.622
Fig. 2. Scatter plot values of the first two canonical discriminant functions for a fixed wavelength of 633 nm, showing the distances among different intensity groups. The average score for each group, named the group centroid, is indicated by an asterisk.
parameters. The higher intensities appear on the right-hand discriminant functions we can use their standardized side, middle intensities in the center, and the lower coefficients. Another way to examine the contribution of intensities on the left-hand side of the figure. The average the different variables to the classification task is to run the score for each group is called the group centroid and is discriminant analysis with only some selected variables indicated by an asterisk. Whereas these discriminant func- and compare their classification results. Table 3 shows the tions are good enough to separate low intensity groups, importance of the different variables for the discrimination there are some overlaps, especially for high intensities, so of the intensity of the stimulus using the whole ganglion that it is not possible to correctly classify all the groups on cell ensemble. The results show that all the variables tested the basis of only these two functions and additional were not of equal importance for the discrimination. Spike discriminant functions are needed. rate (rate in Table 3) was the most important variable for To assess the contribution of each variable to the the discrimination task and 86.7% mean correct
discrimi-Table 3
Relative importance of various response parameters and combination of parameters for discriminating intensity (values are given in percentage)
Wavelength Rate t1 t2 Int. Rate Rate Rate t11t2 Rate Int. All
(nm) 1t1 1t2 1Int. 1t11t2 1t11t2
400 93.5 97.8 65.2 56.5 97.8 95.7 97.8 100 100 100 100
488 89.3 75.0 67.9 67.9 94.0 96.4 96.4 89.3 98.8 96.4 98.8
546 83.5 76.9 61.5 54.9 95.6 91.2 91.2 90.1 98.9 95.6 98.9
600 80.6 78.6 55.1 41.8 91.8 93.9 83.7 95.9 99.0 98.0 100
694 86.7 78.3 72.3 60.2 100 96.4 98.8 92.8 100 97.6 100
E. Fernandez et al. / Brain Research 887 (2000) 222 –229 227
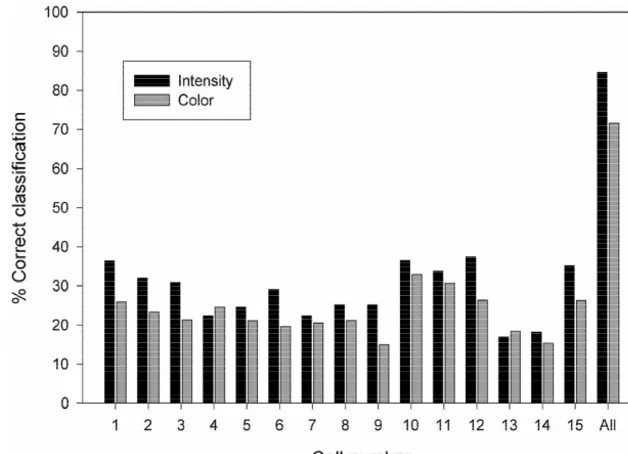
Fig. 3. Comparison of intensity and wavelength discrimination using the same set of ganglion cells.
nation was obtained using only this variable. The follow- when we asked the discriminant analysis to correctly ing next most important variable for the discrimination was classify nine different wavelengths, classification could the timing of the first spike (t1) so that 81.3% of the also be based on minor intensity differences. Fig. 3 shows stimuli were correctly classify using only this variable. The the performance of the same set of ganglion cells for timing of the second spike (t2) and the time difference classifying all the intensities and wavelengths using the between spike one and spike two (Int. in Table 3) were of full 60 parameters. As can be seen, some neurons were less importance for the classification. The best perform- better classifiers of intensity while others were better at ance was reached by using all variables together (99.5% classifying wavelength. Again the population discrimina-correct classifications). An important finding was that the tion was fairly good for this more complex classification intensity of visual stimuli could be correctly classify by task: 71% for wavelength discrimination and 86% for using either a rate code or a temporal code, which could intensity discrimination.
imply some redundancy in the code. Discriminant analysis can also allows be used to
Wavelength discrimination was more complex than evaluating the misclassification results. Table 4 shows the intensity discrimination, because intensity, expressed as performance of a network of 15 ganglion cells in
classify-2
number of quanta / s per mm cannot be kept exactly ing the wavelength of the stimulus. Correctly classified constant for all wavelengths at the level of the photo- cases appear on the diagonal of the table since the receptors. Therefore, discrimination was based on a mix- predicted and actual groups are the same. For example the ture of two changing stimulus parameters. In this sense, wavelength of 400 nm is classified correctly 75% of the
Table 4
Summary of the classification results for color wavelength classification (log intensity5 21)
a b
Actual Predicted group membership color
400 450 488 514 546 577 600 633 694
400 75.0 5.0 20.0 – – – – – –
450 4.8 90.5 – 4.7 – – – – –
488 3.6 21.4 75.0 – – – – – –
514 9.4 4.8 4.8 81.0 – – – – –
546 – – – 9.5 76.2 4.8 9.5 – –
577 – – – – 4.8 85.7 9.5 – –
600 – – – – – – 90.5 – 9.5
633 – – – 4.8 – 4.7 4.8 85.7 –
694 – – – – – 9.5 4.7 4.8 81.0
a
Real wavelength.
b
times, although sometimes the analysis classifies a wave- reliable information about stimulus features from response length of 400 nm as being of 450 nm (5% of the times) or patterns of retinal ganglion cell populations [9,22,30]. as being of 488 nm (20% of the times). Table 4 illustrates Thus, the neural coding could be organized to seek two important features. First, as the wavelength of the covariation in its input, such as it is represented in parallel stimulus is increased, the analysis generally predicted that analyzers [21,39].
a higher wavelength was used to evoke the responses. Since our stimulus intensities were not equated for Second, although sometimes there are misclassifications, quantum catch across the wavelength spectrum, our results the results are generally centered around the actual value. for wavelength discrimination could be based, at least in part on changes on intensity. Although at present we could not entirely reject this possibility, under the stimulus
4. Discussion conditions used in this study for wavelength discrimina-tion, the quantum flux falling onto the retina was very Relatively little is known about how the brain encodes similar for 400 and 694 nm (and very similar for 546 and and represents even single aspects of the outside world. 633 nm, and 514 and 600 nm, and other pairs and triples). Part of the reason is certainly the complexity of the many Thus, if intensity were classified, these wavelengths should feedback and feedforward neural pathways. However, be largely confused. Since this is clearly not the case (see other important factors contribute, such as the necessity of Table 4) our results support the view that the ganglion collecting and analyzing large numbers of responses, and cells can effectively discriminate between lights of similar extracting from these responses the meaningful informa- quantum flux, but different wavelengths.
tion that pertains to the stimuli [6]. Discriminant analysis Finally in this paper we report classification of intensity is a mathematical method, that uses linear combinations of and wavelength based on a total of 15 well isolated retinal the predictor variables as the basis for separating two or ganglion cells. However the conclusions have been sub-more groups of individuals (see Ref. [27] for a review) stantiated in several other identical experiments, with best and, as we have shown here, it can be very useful to in classification scores ranging from 70 to 99% [9,30]. These getting insights about how a population of retinal ganglion results demonstrate the utility and richness of knowledge cells can encode certain stimulus features like intensity or obtainable from ‘many-neuron’ ensemble recording
tech-wavelength. niques and show that appropriate application of
discrimin-In order to get as much information as possible about ant analysis can be used to analyze the large volume of the nature of the neural code, raw data should be used. One data generated in these studies. We propose that discrimin-needs to construct models based on data sets and not ant analysis, in addition to the other approaches currently assume a priori the important variables nor the form of the used (neuronal networks, information theory, principal models. It is not known in advance which of the possible component analysis, etc.) can be very useful in obtaining variables are important for group separation and which are, insights into the mechanisms underlying neuronal coding. more or less useless. In this context discriminant analysis
provides an excellent exploratory tool. This tool allows
one to analyze all the variables and recordings as a unified Acknowledgements
set, not one at a time. By considering all the variables
simultaneously, we are able to obtain insights about their This research is being funded by CICYT SAF98-0098-possible relationships. Since the data for a discriminant CO2-02 to E.F. and J.-M. F., NSF grant[IBN 9424509
functional analysis do not need to be standardized to have and SFB 517 to J.A. and by a State of Utah Center of zero means and variances prior to the start of the analysis, Excellence Grant and a NSF grant IBN94-24509 to R.A.N. the outcome of a discriminant function analysis is not
affected in any important way by the scaling of individual
variables [20]. References
The discriminant analysis, as applied in the current
study, detected patterns of covariance between neurons in [1] S.V. Afanas’ev, B.F. Tolkunov, A.A. Orlov, E.V. Selezneva, Collec-tive responses of neostriatal (putamen) neurons during alternaCollec-tive
the ensemble and determined which combination of
neu-behavior in monkeys, Neurosci. Behav. Physiol. 28 (1998) 231–
rons and variables were more effective for discriminating
237.
these patterns. Rate and spike timing were chosen as [2] M. Berry, D.K. Warland, M. Meister, The structure and precision of discrimination variables because was there is ample evi- spike trains, Proc. Natl. Acad. Sci. USA 94 (1997) 5411–5416.
dence from different neural systems that show that these [3] G.G. Blasdel, G. Salama, Voltage-sensitive dyes reveal a modular organization in monkey striate cortex, Nature 321 (1986) 579–585.
are important variables for encoding [2,4,6,11,22,
[4] W. Bialek, F. Rieke, Reliability and information transmission in
25,27,28]. Although this does not mean that the brain is
spiking neurons, Trends Neurosci. 15 (1992) 428–434.
using these variables, and we do not know at present if [5] D.A. Borkholder, J. Bao, N.I. Maluf, E.R. Perl, G.T.A. Kovacs, indeed the brain used exclusively these variables, our Microelectrode arrays for stimulation of neural slice preparations, J.
E. Fernandez et al. / Brain Research 887 (2000) 222 –229 229
[6] A. Borst, E. Theunissen, Information theory and neural coding, Nat. retina: acquisition and analysis, J. Neurosci. Methods 51 (1994)
Neurosci. 11 (1999) 947–957. 95–106.
[7] M. Brosch, R. Bauer, R. Eckhorn, Stimulus-dependent modulations [25] J.C. Middlebrooks, L. Xu, A.C. Eddins, D.M. Green, Codes for of correlated high-frequency oscillations in cat visual cortex, Cereb. sound-source location in nontonotopic auditory cortex, J.
Neuro-Cortex 7 (1997) 70–76. physiol. 80 (1998) 863–881.
[8] S.A. Deadwyler, T. Bunn, R.E. Hampson, Hippocampal ensemble [26] K. Najafi, K.D. Wise, An implantable multielectrode array with activity during spatial delayed-nonmatch-to-sample performance in on-chip signal processing, IEEE J. Solid-State Circuits 21 (1986) rats, J. Neurosci. 16 (1996) 354–372. 1035–1044.
[9] J.M. Ferrandez, J. Ammermuller, R.A. Normann, E. Fernandez, [27] M.A. Nicolelis (Ed.), Methods for Neural Ensemble Recordings, Management of color and luminance information by a network of CRC Press, Boca Raton, FL, 1998, 272 pp.
ganglion cells in turtle retina, in: Lecture Notes in Computer [28] M.A. Nicolelis, A.A. Ghazanfar, C.R. Stambaugh, L.M. Oliveira, M. Science, Vol. 1607, Springer, Berlin, 1999, pp. 289–298. Laubach, J.K. Chapin, R.J. Nelson, J.H. Kaas, Simultaneous encod-[10] R.A. Fisher, The utilization of multiple measurements in taxonomic ing of tactile information by three primate cortical areas, Nat.
problems, Ann. Eugenics 7 (1936) 179–188. Neurosci. 1 (1998) 621–630. ¨ ¨
[11] E. Funke, F. Worgotter, On the significance of temporally structured [29] C.T. Nordhausen, E.M. Maynard, R.A. Normann, Single unit activity in the dorsal lateral geniculate nucleus (LGN), Prog. recording capabilities of a 100 microelectrode array, Brain Res. 8
Neurobiol. 53 (1997) 67–119. (1996) 129–140.
¨
[12] G.L. Gerstein, A.M. Aertsen, Representation of cooperative firing [30] R.A. Normann, D. Warren, J. Ammermuller, E. Fernandez, S. activity among simultaneously recorded neurons, J. Neurophysiol. Guillory, High spatio-temporal mapping of visual pathways using 54 (1985) 1513–1528. multi-electrode arrays, Vis. Res. (2000) in press.
[13] A. Grinvald, R.D. Frostig, R.M. Siegel, E. Bartfeld, High-resolution [31] M.J. Norusis, in: Statistics Package for the Social Sciences (SPSS), optical imaging of functional brain architecture in the awake Professional Statistics, 6.1, SPSS Inc, Chicago, 1994.
monkey, Proc. Natl. Acad. Sci. USA 88 (1991) 11559–11563. [32] I. Perlman, R.A. Normann, J.P. Chandler, L.E. Lipetz, Effects of [14] K.S. Guillory, R.A. Normann, 100-channel system for real time calcium ions on L-type horizontal cells in the isolated turtle retina,
detection and storage of extracellular spike waveforms, J. Neurosci. Vis. Neurosci. 4 (1990) 53–62.
Methods 91 (1999) 21–29. [33] P.J. Rousche, R.S. Petersen, S. Battiston, S. Giannotta, M.E. [15] A. Hirota, K. Sato, Y. Momose-Sato, T. Sakai, K. Kamino, A new Diamond, Examination of the spatial and temporal distribution of simultaneous 1020-site optical recording system for monitoring sensory cortical activity using a 100-electrode array, J. Neurosci. neural activity using voltage-sensitive dyes, J. Neurosci. Methods 56 Methods 90 (1999) 57–66.
¨
(1995) 187–194. [34] S. Shoham, R. Osan, J. Ammermuller, A. Branner, E. Fernandez, [16] K.E. Jones, P.K. Campbell, R.A. Normann, K.W. Horch, R.B. Huber, R.A. Normann, The classification of spatial, chromatic, and intensity A glass / silicon composite intracortical electrode array, Ann. features of simple visual stimuli by a network of retinal ganglion Biomed. Eng. 20 (1992) 423–437. cells, in: Lecture Notes in Computer Science, Vol. 1240, Springer, [17] H. Kawaguchi, K. Fukunishi, Dendrite classification in rat hip- Berlin, 1997, pp. 44–53.
pocampal neurons according to signal propagation properties. Ob- [35] J. Stevens, in: Applied Multivariate Statistics for the Social Sci-servation by multichannel optical recording in cultured neuronal ences, Lawrence Erlbaum, Hillsdale, NY, 1992.
`
networks, Exp. Brain Res. 122 (1998) 378–392. [36] L. Stoppini, S. Duport, P. Correges, A new extracellular multirecord-[18] J. Kruger, Multi-microelectrode investigation of monkey striate ing system for electrophysiological studies: application to hippocam-cortex: link between correlational and neuronal properties in the pal organotypic cultures, J. Neurosci. Methods 72 (1997) 23–33. infragranular layers, Vis. Neurosci. 5 (1990) 135–142. [37] D.J. Surmeiller, R.J. Weinberg, The relationship between cross-[19] E.M. Maynard, N.G. Hatsopoulos, C.L. Ojakangas, B.D. Acuna, J.N. correlation measures and underlying synaptic events, Brain Res. 331
Sanes, R.A. Normann, J.P. Donoghue, Neuronal interactions im- (1985) 180–184.
prove cortical population coding of movement direction, J. Neuro- [38] W.M. Usrey, R.C. Reid, Synchronous activity in the visual system, sci. 19 (1999) 8083–8093. Annu. Rev. Physiol. 61 (1999) 435–456.
[20] B.J.F. Manly, in: Multivariate Statistical Methods: A Primer, [39] D.I. Vaney, A.A. Hughes, Is there more than meets the eye, in: C. Chapman and Hall, London, 1986. Blakemore (Ed.), Vision: Coding and Efficiency, Cambridge Uni-[21] D.M. McKay, Vision — the capture of optical covariation, in: J.D. versity Press, Cambridge, 1990, pp. 74–83.
Pettigrew, K.J. Sanderson, W.R. Levick (Eds.), Visual Neuroscience, [40] D.K. Warland, P. Reinagel, M. Meister, Decoding visual information Cambridge University Press, Cambridge, 1986, pp. 365–373. from a population of retinal ganglion cells, J. Neurophysiol. 78 [22] M. Meister, Multineuronal codes in retinal signaling, Proc. Natl. (1997) 2336–2350.