LOCALIZATION OF PATHOLOGY ON COMPLEX ARCHITECTURE BUILDING
SURFACES
A. A. Sidiropoulos a,*, K. N. Lakakisa, V.K. Mouzab
a Laboratory of Geodesy & Geomatics, Department of Civil Engineering, Aristotle University of Thessaloniki, Thessaloniki, 54124, Greece, [email protected], [email protected]
b Master of Science on Protection, Conservation and Restoration of Cultural Monuments, Aristotle University of Thessaloniki, Thessaloniki, 54124, Greece, [email protected]
Commission II
KEY WORDS: Laser Scanning, Point Cloud, Heritage, Complex Architecture, Pathology
ABSTRACT:
The technology of 3D laser scanning is considered as one of the most common methods for heritage documentation. The point clouds that are being produced provide information of high detail, both geometric and thematic. There are various studies that examine techniques of the best exploitation of this information. In this study, an algorithm of pathology localization, such as cracks and fissures, on complex building surfaces is being tested. The algorithm makes use of the points’ position in the point cloud and tries to distinguish them in two groups-patterns; pathology and non-pathology. The extraction of the geometric information that is being used for recognizing the pattern of the points is being accomplished via Principal Component Analysis (PCA) in user-specified neighborhoods in the whole point cloud. The implementation of PCA leads to the definition of the normal vector at each point of the cloud. Two tests that operate separately examine both local and global geometric criteria among the points and conclude which of them should be categorized as pathology. The proposed algorithm was tested on parts of the Gazi Evrenos Baths masonry, which are located at the city of Giannitsa at Northern Greece.
1. INTRODUCTION
Laser scanners are able to visualize areas, buildings and monuments at very short periods of time and provide both of their geometric and thematic information. The combination of precise XYZ positioning in 3D space to the RGB information has been proved a very important tool for the most scientific fields that heritage preservation depends on. The contribution of laser scanning to heritage documentation is more obvious in cases of big monuments, which contain complicated surfaces that are difficult to be reconstructed by topographic methods and laser scanners provide higher accuracy than photogrammetry.
The working principle of laser scanners that are mainly being used in heritage documentation is based on time measuring. There are two kinds of time measuring scanners. The first emits a pulse towards the object of interest and measures directly the time between the emission and the reception of it (time of flight scanners). The second kind (phase comparison scanners) measure the time by emitting the pulse as a continuous wave and comparing the phase of the emitting wave to the wave that is being received. For both kinds, the knowledge of time concludes to the calculation of distance between the instrument and each one of the points of interest. Simultaneously to this procedure, the device records the horizontal and vertical angles that lead to the calculation of the 3D coordinates of the points.
Laser scanners measure very large number of points at very short periods of time. The measuring rate starts from a few thousand points per second and reach the number of hundreds of thousands points per second. It is inevitable that the data at the end of a project will contain millions of points and this fact necessitates the development of tools that will extract the important information. Also, depending on the project, maybe the creation of the solid 3D model of the area under investigation is required. Despite the fact that this is the case in many applications, thanks
to the very dense point clouds that laser scanners provide, many results can be exported directly from the point cloud.
In this study, two main tools are being combined so the localization of building pathology (cracks and fissures) can be achieved. These are the k nearest neighbors algorithm and the Principal Component Analysis (PCA). The idea of neighborhood is very helpful to analyzing point clouds because it aids to understand the relations between points or even groups of points that are either very close or very far to each other. Also, the implementation of the k nearest neighbors algorithm is mandatory for the use of PCA on point clouds. PCA is a statistical procedure that can point out information of data that is not immediately obvious. In the current case, PCA is being implemented for the calculation of normal vectors on neighborhood of points that can be considered as planes. So, PCA
results to the acquisition of the point clouds’ normal vectors at
each of their point and the knowledge of the curvature changes. Exploiting this information and the knowledge of the point density at each specified neighborhood it is possible to categorize points in two groups; pathology and non-pathology. Thus, it is possible to localize many cracks and fissures on building masonry because at these locations an inevitable change of curvature happens. The recognition of a point as non-pathology is achieved through two tests that operate separately and use both local and global criteria. The proposed algorithm was tested on the walls of the Gazi Evrenos Baths which are located at the city of Giannitsa at Northern Greece.
study which deals with more complex architecture surfaces, that study focused on planar parts of the walls of the monument. (SanJosé et al, 2007) used 3D laser scans to evaluate the structural damages of the gothic church of Villamoron (Burgos, Spain). They created the global model of the monument and interactively selected slices on it. Exporting slices to CAD models and by simple inspection they identified the pathology of the building. For solving visualization problems of subclouds of points that were exported by the global model the authors developed the software UVACAD. (Baptista, 2013) is an example of how geometric documentation methods interact and that they provide a better result when combined. Author used close range photogrammetry and 3D laser scanning to document the Theatre Guaira Cultural Centre in Curitiba, Brazil. Despite the fact that high resolution scans made an ideal record of the monument there were tiny cracks at the exterior façades that required the implementation of close range photogrammetry. The same idea is supported by (Altuntas, 2015), who used both laser scanning and image based modelling to achieve a better result for visualization of complex details of historical buildings. This study was performed on the front façade of the Sultan Selim mosque, Konya, Turkey. A comparison of two different methods (active and passive sensors) on detecting pathologies in historical buildings made by (Del Pozo et al, 2015). The authors used active laser scanner FARO Focus 3D and passive Nikon-5000 and 6-bands Mini-MCA multispectral camera to conclude that the best solution for pathology detection is a sensor combination with laser scanning as a primary method. (Kersten et al, 2015) used laser scanning and digital photogrammetry for geometric documentation of the Al Zubarah fortress, Qatar. The comparison of these methods showed that the resulted products (point clouds and surface models) of images did not achieve the geometrical accuracy of laser scanning.
2. EXPERIMENT
2.1 Method
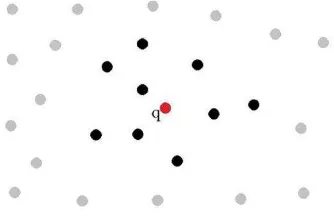
The method that is being described in this paper is based on two main tools. The k nearest neighbors algorithm examines the relations between a point and the k closest points to it. The idea of neighborhood is very useful to point cloud elaboration because it aids the user to acquire important information that exists among its points or between the neighborhood itself and other neighborhoods of the point cloud. The number of points that exist in a neighborhood is n = k + 1, because the query point should also be included (Figure 1).
Figure 1. A neighborhood of n = 10 points, k = 9. (Sidiropoulos et al, 2016)
There are many metrics that can define the closeness of a point to its neighbors. The most common, which also is being used here, is the Euclidean distance. Because of the fact that the data are 3D so is the calculated distance. Depending on the 3D
Euclidean distance the algorithm defines as neighbors of a query point those points that are found with the k smallest distances from it. It is obvious and inevitable that a point is neighbor to more than one of the other points. This means that the points belong to more than one neighborhoods and of course that the neighborhoods overlap each other. If a point q belongs to the neighborhood of a point q1, it does not mean that q1 necessarily belongs to the neighborhood of q.
Once the neighborhoods of the points have been defined, the procedure can continue using the Principal Component Analysis (PCA) for the calculation of the normal vectors for every point of the point cloud. A normal vector of a plane is the geometric entity that defines that plane’s orientation. Considering a plane P in
Because of the fact that a normal vector cannot be calculated for point clouds, a surface should be defined so the normal vector will refer to it. This is the reason why neighborhoods of points are very useful. A plane can be fitted to each neighborhood and thus the normal vector at each point will refer to its respective plane. It is obvious that the plane that will be fitted is sensitive to the number k of the neighbors which should be selected carefully. Some parameters that influence the selection of k are
The plane fitting and definition of the normal vectors is achieved by PCA. The PCA is being implemented for every neighborhood that has been previously defined. The data available for PCA
For each coordinate the mean value is being calculated using (2).
μx=∑ni=1xi
mean centered data the variance-covariance matrix C is being
The fact that the points in the neighborhoods lie close to a plane means that two out of three eigenvalues of the 3x3 variance-covariance matrix will be large and the remaining one will be small, compared to the other two. The eigenvector that corresponds to the minimum eigenvalue is the normal vector of the fitted plane. The other two eigenvectors lie on the plane.
Once the PCA has been completed for the whole point cloud, the orientation derived by the calculated normal vectors is known for every point in it. Combining the orientation knowledge to the neighborhoods information and introducing the appropriate criteria, the localization of cracks and fissures on building walls becomes possible.
The two tests that are being conducted aim to categorize each point as a pathology or non-pathology point. These tests operate independently from each other. Totally, for a point to be categorized as pathology (meaning that it exists on or close to a crack or fissure) the parameters that are being examined are four and are based on both local and global criteria. The local criteria are those that express relations between a query point and its neighbors and the global criteria examine the relationship between the query point and the whole point cloud that is under investigation. The values attributed to the parameters are user sensitive and are related to the structure of the point cloud and the results that the user wishes to acquire.
The first test checks three out of four criteria and is mandatory that they should be met simultaneously. The first two criteria are local and evaluate the angles that are being created between the normal vectors of the points in the neighborhoods. The angle between two normal vectors is calculated by the use of dot product. So, considering a neighborhood around a point q, the number of angles that should be calculated are k and of course the first angle must equal zero because is the angle between the normal vector at point q and itself. The first criterion specifies that in the neighborhood of point q, if the angle ω(q,q�), between the normal vector of q and the normal vector of a point qi exceeds a user-defined value then, point qi should be treated as
“suspicious”, giving to it a negative vote. The second criterion, which is also local, requires the calculation of the mean angle between the query point and its neighbors (6).
ωμ=∑ ω(q,qi)
Each individual angle ω(q,qi) is then compared to the respective
neighborhood’s mean angle and if it exceeds the value of
equation (7) then point qi takes another negative vote as
“suspicious” that is pathology point.
ω(q,qi) > ωμ + c1 * st ω (7)
where st ω is the standard deviation of the angles and c1 is a user-defined coefficient. Usually, for the tests that were conducted, c took the values 1, 2 or 3.
During the development of the current method and the trials that have been made on the walls of the Gazi Evrenos Baths it has been noticed that at the locations of cracks and fissures, the point density is lower than at other locations of the point cloud. This was a fact even for locations of curvature change without the existence of pathology. This is probably occurred because of the
inability of the laser scanner’s pulse to reach the whole surface
of the crack or fissure. This was considered as an opportunity to introduce the third criterion of first test for pathology localization. This criterion is global and compares the point density within a neighborhood to the global mean density of all the neighborhoods across the point cloud (Equation 8).
di < c2 * md (8)
where di is the point density of the ith neighborhood, md is the mean point density of all neighborhoods and c2 is a user-sensitive coefficient.
The smaller the value for c2 the user chooses, the bigger the noise removal from pathology category is achieved. However, the definition of c2 should be made carefully so as not to remove useful data that in other case would be categorized as pathology. The third criterion operates as a filter to those points that already have been voted twice as pathology.
During the second test, the whole point cloud is checked for pathology detection and not just the points that provided by the first test. It is a totally separate test that contributes to the general pathology recognition. This test compares all of the mean angels that were calculated for the second criterion of the first test to their mean value, similarly to Equation 7. In this case, the coefficient that standard deviation is being multiplied with, is c3.
2.2 The Gazi Evrenos Baths
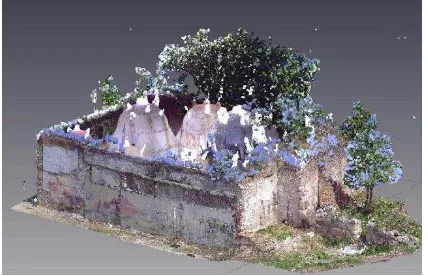
The algorithm was tested on the masonry of the Gazi Evrenos Baths. This monument is placed at the city of Giannitsa at Northen Greece (Figure 3). The Baths were constructed at the end of the 14th century and they are of the oldest that were constructed in Greek area. Nowadays the building has suffered many alterations at the exterior (Mouza, 2012).
Figure 3. The whole point cloud of the Gazi Evrenos Baths, Giannitsa, Greece
documentation is part of the restoration study that has been conducted for the monument.
2.3 Results
The algorithm was tested for various values of the user adjustable parameters of the criteria. This happened to evaluate its efficiency under different executions and to find, if possible, recommended values for many applications. The examples that are being presented here are point clouds from the interior of the
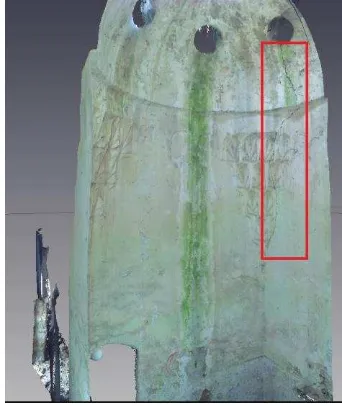
monument. The first is a part of one of the monument’s domes
that presents curvature (Figure 4).
a)
b)
Figure 4. a) Part of one of the monument’s domes. The crack which begins from the middle top of the part and reaches its
middle bottom is the main focus here b) This part presents curvature and thus is more complex than a flat part
Table 1 shows two cases of the criteria parameters and Figure 5 their respective point clouds for wall part of Figure 4.
Criterion 1 (angle)
Test 1
Criterion 2 (c1) Test 1
Criterion 3 (c2) Test 1
Criterion 4 (c3) Test 2
1st case 10o 1 0.25 2
2nd case 10o 1 0.25 3
Table 1. Parameters of the criteria for wall part of Figure 4
In the case of the part of Figure 4, the parameters of the first test remained constant in both executions. The difference was made on test two, where the values 2 and 3 were attributed to the coefficient c3 of the standard deviation.
a)
b)
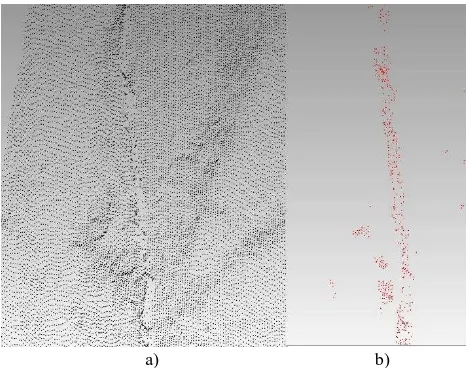
Figure 5. The two cases of pathology identification for a wall part that is not flat a) First case (c3 = 2) b) Second case (c3 = 3)
In the first case, the number of points that were found as pathology is 6641 and in the second case 3535. It is obvious that the first case identifies the crack better than the second but in the same time introduces points that are not part of the specific crack.
The second wall part that is under examination is more complex. It contains parts with curvature, flat parts and decorative motifs (Figure 6).
After many trials for the values of the parameters, the preferred and suggested are once again those of the two cases of Table 1. Although it introduces noise, a little bit favor is given to the first case of Table 1 because it recognizes the cracks better. Figure 7 shows a detail of the complex masonry of Figure 6.
a) b)
Figure 7. a) Detail of Figure 6 with complex surfaces and decorative motifs and b) the result of pathology detection
Despite the fact that the surfaces of Figure 7 are complex and there are many curvature changes, the algorithm manages to localize the crack satisfying and do not include to pathology other entities, such as decorative motifs.
3. CONCLUSIONS
This paper develops an algorithm that is able to localize and detect pathology on complex surfaces of buildings. Cracks and fissures are distinguished among other entities that exist in point clouds that were measured by a laser scanner. Despite the fact that the parameters of the algorithm are user-sensitive, an effort has been made to standardize their values and increase the automation. It is important to notice that the specified values of the parameters may not operate that efficiently for other point clouds, derived by another instrument, of different point density and distribution. In that case the user should adjust the parameters to the demands of each project.
It is important to develop methods that exploit the large amount of information that is being provided by devices like the laser scanners. Laser scanners are very useful to heritage restoration and other construction applications but the time that is being spent to the elaboration of the data is disproportionate to the time of data collection. Tools that limit the human intervention of the data elaboration to the level of control and increase automation should be encouraged, improved and included to processing software.
ACKNOWLEDGMENTS
We would like to thank the State Scholarship Foundation for the
program “IKY FELLOWSHIPS OF EXCELLENCE FOR
POSTGRADUATE STUDIES IN GREECE – SIEMENS
PROGRAM”.
REFERENCES
Altuntas, C., 2015. Integration of point clouds originated from laser scanner and photogrammetric images for visualization of complex details of historical buildings. 3D Virtual Reconstruction and Visualization of Complex Architectures, 25-27 February, Avila, Spain, Volume XL-5/W4, pp. 431-435
Baptista, M. L. V., 2013. Documenting a complex modern heritage building using multi image close range photogrammetry and 3D laser scanned point clouds. XXIV International CIPA Symposium, 2 – 6 September, Strasbourg, France, Volume XL-5/W2, pp. 675-678
Corral, M., 2008. Vector Calculus
Del Pozo, S., Herrero-Pascual, J., Felipe-García, B., Hernández
-López, D., Rodríguez-Gonzálvez, P., González-Aguilera, D., 2015. Multi-sensor radiometric study to detect pathologies in historical buildings. 3D Virtual Reconstruction and Visualization of Complex Architectures, 25-27 February, Avila, Spain, Volume XL-5/W4, pp. 193-200
Kersten, T., Mechelke, K., Maziull, L., 2015. 3D model of Al Zubarah fortress in Qatar – terrestrial laser scanning vs. dense image matching. 3D Virtual Reconstruction and Visualization of Complex Architectures, 25-27 February, Avila, Spain, Volume XL-5/W4, pp. 1-8
Mouza, V., 2012. Ottoman Bath of Gazi Evrenos at Giannitsa - Restoration Study, Master Thesis
SanJosé, J. I., Fernández-Martín, J. J., Pérez-Moneo, J. D., Finat,
J., Martínez-Rubio, J., 2007. Evaluation of structural damages from 3D laser scans, XXI CIPA International Symposium: Anticipating the Future of the Cultural, Athens