Runoff simulation using distributed hydrological modeling approach, remote sensing and GIS
techniques: A case study from an Indian agricultural watershed.
V.M.Chowdary1*, V.R.Desai2, Mukesh Gupta2, A.Jeyaram1, Y.V.N.K.Murthy3
1Regional remote Sensing Centre (East), NRSC, ISRO Kolkata, India -700156 2Department of Civil Engineering, IIT, Kharagpur, India- 721302
3DDRC, National remote Sensing Centre, Hyderabad, India
*Corresponding author ([email protected]; [email protected])
Working Group, Theme: VIII/4:Water
Keywords: Distributed hydrological model, GIS, Remote sensing, Curve number, Muskingum-Cunge technique
ABSTRACT:
Distributed hydrological modeling has the capability of simulating distributed watershed basin
processes, by dividing a heterogeneous and complex land surface divided into computational
elements such as Hydrologic Response Units (HRU), grid cell or sub watersheds. The present study
was taken up to simulate spatial hydrological processes from a case study area of Kansavati
watershed in Purulia district of West Bengal, India having diverse geographical features using
distributed hydrological modelling approach. In the present study, overland flow in terms of direct
runoff from storm rainfall was computed using USDA Soil Conservation Services (SCS) curve
number technique and subsequently it served as input to channel routing model. For channel flow
routing, Muskingum-Cunge flood routing technique was used, specifically to route surface runoff
from the different sub watershed outlet points to the outlet point of the watershed.
Model
parameters were derived for each grid cell either from remote sensing data or conventional maps
under GIS environment. For distributed approach, validation show reasonable fit between the
simulated and measured data and CMR value in all the cases is negative and ranges from 0.1 to
-0.3. Further, this study investigates the effect of cell size on runoff simulation for different grid cell
sizes of 23, 46, 92, 184, 368, 736, 1472 m resolution. The difference between simulated and
observed runoff values increases with the increase of grid size beyond 184 m more prominently.
Further, this model can be used to evaluate futuristic water availability scenarios for an agricultural
watershed in eastern India.
1. INTRODUCTION
Hydrological behaviour of any watershed can be predicted through modeling. Particularly, the conversion of excess rainfall into surface runoff is traditionally analyzed by means of lumped models and these models assume that excess rainfall and physiographical conditions over a watershed are uniform. Thus errors can be introduced while simulating rainfall–runoff process using lumped models. Hence to overcome this difficulty, distributed modelling approach was proposed (Diksi et al., 1984). This approach has the capability of simulating the heterogeneity of both rainfall spatial distribution and catchment characteristics, may offer a better approach for runoff hydrograph simulation. Recent developments in the remote sensing technology and geographical information systems make it possible to capture and manage a vast amount of data of spatially distributed hydrological parameters and variables. Linking GIS and the hydrological modeling is very essential to
achieve the desired objectives. As distributed models are more widely use in practice, the need of scientific principal relating to spatial variability, temporal and spatial resolution, information content and calibration become more apparent.
One of the most widely used techniques for estimating direct runoff depths from storm rainfall is the United States Department of Agriculture (USDA) Curve Number (CN) method (SCS 1972). Greene and Cruise (1995) and Ponce and Hawkins (1996) identified the CN method as one of the most popular tools for calculating runoff depths. The description of the flow process in the numerous distributed rainfall-runoff models may be classified into two basic kinds (Beven, 1985). One is the kinematic wave approach for simulating the overland and channel flow (Abbott et al., 1986; Morris, 1980). The other is the conceptual storage approach (Diskin et al., 1984; Beven et al., 1984). Yu (1990) has a detailed literature review of the distributed rainfall runoff models. The conventional
Muskingum-Cunge model is based on kinematic wave theory and is available alternative to the classical Muskingum method (Chow, 1959) particularly for the cases where hydrologic data i.e. stream flow data are not available, but where hydraulic data (cross sectional data and channel slopes) can be readily ascertained. In many instances, the Muskingum-Cunge method is also an alternative to the more complex dynamic wave models, while lack robustness and have significant data requirements.
Advances in distributed parameter hydrologic modelling and its integration with Geographical Information Systems (GIS) have led to the development of powerful tools for predicting runoff and simulating the physical, chemical and biochemical processes that govern the transport of contaminants in watersheds. Many researchers (White 1988; Stuebe and Johnston 1990; Chowdary et al., 2004; Pandey et al., 2008) used land use/land cover information derived from satellite data of Landsat, SPOT, and Indian Remote Sensing Satellite (IRS) and integrated them with GIS to estimate SCS CNs and runoff. Several hydrologic models include ANSWERS (Areal Nonpoint Source Watershed Environment Response Simulation) (Beasely et al., 1980), AGNPS (Agricultural Nonpoint Source Pollution) Young et al., 1987), WEPP (Water Erosion Prediction Project) (Foster and Lane, 1987), and SWAT (Soil Water Assessment Tool) (Arnold et al., 1995) are extensively being used for runoff and sediment simulation.
The present study was taken with a specific objective of runoff simulation from ungauged lateral inflows from sub watersheds into main channel using USDA SCS-CN technique. In addition, the Muskingum-Cunge method, which continues to be popular for routing of runoff in river networks, was used to route surface runoffs from different sub basin outlet points up to the outlet point of the catchment. Effect of model grid sizes on runoff simulation was also studied with varied grid sizes of 23, 46, 92, 184, 368, 736, 1472 m resolution.
2. METHODOLOGY
In the present study, overland flow in terms of direct runoff from storm rainfall was computed using USDA Soil Conservation Services (SCS) curve number technique and subsequently it served as input to channel routing model. For simulation of overland flow, spatially distributed curve numbers for different antecedent moisture conditions serve as major input to SCS-CN technique. For channel flow routing, Muskingum-Cunge flood routing technique was used, specifically to route surface runoff from the different sub watershed outlet points to the outlet point of the watershed. Muskingum technique allows the entire hydrograph to be obtained at required cross sections instead of requiring solution over entire length of channel for each time step as in kinematic wave method. The ability of the proposed distributed rainfall-runoff model to simulate spatial hydrological processes are verified using storm events. Four of them were arbitrarily chosen for model calibration and the others were used for model verification. RMSE and CMR most widely used statistics reported for hydrology model calibration and validation were used in the present study.
2.1 Overland flow using SCS-CN technique
One of the most widely used technique for estimating storm runoff depths; USDA Soil Conservation Service (SCS) Curve
Number (CN) method was adopted. The basic assumption of the SCS curve number is that, for a single storm event, potential maximum soil retention is equal to the ratio of direct runoff to available rainfall. This relationship, after algebraic manipulation and inclusion of simplifying assumptions, results in the following equations (USDA-SCS, 1972), where curve number represents a convenient representation of potential soil retention (Ponce and Hawkins, 1996). SCS-CN method is given as follows:
where, P is rainfall in mm Q is runoff in mm, S is potential maximum soil retention in mm and CN is Curve Number ranges from 0 to 100, whose values were developed from annual flood rainfall–runoff data from the literature for a variety of watersheds generally less than one square km in area (USDA-SCS, 1972) for different combinations of land use and soil.
After assigning the curve number for a unique combination of soil hydrologic group, land use/cover and Antecenedent moisture conditions, the potential maximum soil retention (S) was calculated for each Hydrologic Response Unit (HRU). Initially, the study watershed was decomposed into sub watersheds and subsequently, sub watershed was delineated into Hydrologic Response Unit (HRU) (Maidment, 1991), which involves the aggregation of areas located with a unique combination of soil and land use regardless of their spatial position in the watershed in the GIS environment. An HRU does not correspond to a physical location in the watershed, routing between these units cannot be simulated. The estimated runoff from each HRU is simply added together to obtain the estimated flow at the watershed outlet.
2.1.1 Curve numbers adjusted with Antecedent Moisture Condition (AMC)
The curve number varies for different antecedent moisture conditions (AMC) and these conditions reflect the impact of previous rainfall events on the soil’s moisture holding capacity. The curve number shown in the equation 2 is for normal antecedent moisture condition (AMC II), for dry condition (AMC I) and wet condition (AMS III), equivalent curve numbers can be computed by
)
2.2 Muskingum-Cunge channel flood routing technique
The Muskingum-cunge method is a variant of the Muskingum method (Chow, 1959) developed by Cunge (1969) and documented in the Flood Studies report (Natural Environment
Research Council, 1975). The Muskingum-Cunge is a viable alternative to particularly for the cases where hydrologic data i.e. stream flow data are not available, but where hydraulic data (cross sectional data and channel slopes) can be readily ascertained. Ponce and Yevjevich (1978) expressed the routing parameters of the Muskingum-Cunge method in terms of the Courant and cell Reynolds numbers, two physically and numerically meaningful parameters. This method involves use of a finite difference scheme to solve the Muskingum equation where the parameters in the Muskingum equations are determined based on the grid spacing for the finite difference scheme and channel geometry characteristics. The Muskinghum equation represents the relationship between reach storage and discharge as flood wave propagates through a reach. Assuming that cross sectional area of the flood flow is directly proportional to the discharge at the section, total section is:
S = K [XI + (1-X) O] (Eq. 5)
Where S is the total storage in reach ( m3), I inflow in reach (m3/s), K is a proportionality constant known as Muskingum
travel time (unit of time) and X is a weighting factor ranges between 0 to 0.5 (dimensionless).The equation of continuity for the reach is given as follows:
I – Q = dS/dt (Eq.6)
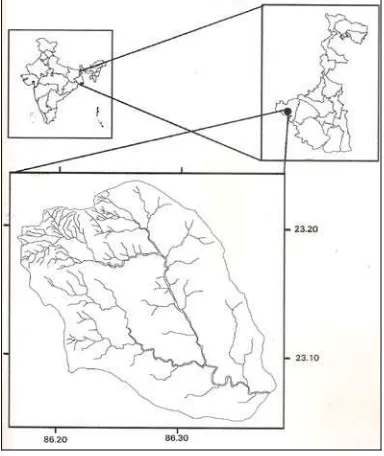
3. STUDY AREA DESCRIPTION
Rangagora watershed located in the catchment of Kangsawati river is considered for the present study (Figure 1). Mainly three rivers namely Kansai, Kumari and Tongo are contributing the flow in Kansavati river watershed. Geographically, the study area is located between 86o 10’ and 86o 23’ East longitude and 27o 14’ and 23o 04’ North latitude. Average annual rainfall of
the study area is around 1300 mm and its elevation ranges between 200 to 640 m. Major portions of the study area is occupied by loamy silt soils with slope varying between 1 to 15%.
Figure 1. Location map of the study area
3.1 Data used
3.1.1 Hydro-meteorological data
Storm rainfall data at 3 hrs interval for few rainfall events and at daily interval for five years from Central Water Commission (CWC), Midnapore, West Bengal were collected. Daily discharge data at outlet of reservoir for five years was collected from Water Commission (CWC), Midnapore, West Bengal.
3.2.2 Satellite data
IRS -1D LISS III (Linear Imaging Self Scanner) data acquired on 23rd October, 2000 was used for generation of Land sue/cover map.
3.2.3 Spatial inputs
SCS-CN method in combination with Muskingum-Cunge routing technique requires a detailed knowledge of several spatially distributed parameters affecting runoff viz., soil, land use, antecedent soil moisture conditions, channel information etc. Hence these model parameters were derived for each hydraulic response unit (HRU) either from remote sensing data or conventional maps under GIS environment, which can handle voluminous input and output data. Using the digitized contour map of the Kansavati watershed, Digital Elevation Model (DEM) was produced with a grid size of 23 m × 23 m, and subsequently stream network was generated under GIS environment that facilitated the delineation of the study watershed into sub watersheds. The land use/land cover map was generated using IRS 1D- LISS III sensor data. Model grid sizes were found to be the most important factor affecting runoff and the model parameter database was computed for grid cell sizes of 23, 46, 92, 184, 368, 736, 1472 m resolution.
4. RESULTS AND DISCUSSION
Spatial hydrological processes were simulated using distributed hydrological approach involving SCS-CN method and Muskingum-Cunge technique and are validated using stream gauging data for few storm events. In the present study overland flow was estimated using both distributed and lumped approach respectively. These runoff depths serve as inputs to the channel routing model. Simulated runoff hydrographs have been generated at main outlet of the watershed. Four storm periods have been used to develop and validate the results of runoff hydrograph. Runoff hydrograph for the study area was generated by using Muskingum-Cunge flood routing technique and is shown in figure 2. The estimated and observed hydrographs presented in figure show good simulation for all the storm events considered. The simulated and observed runoff discharge rates have been plotted as 1:1 line for both distributed and lumped approach. It was observed from these figures that simulated discharge rates using distributed approach are uniformly scattered around 1:1 line, while scattered away from the 1:1 line in case of lumped approach. CMR and RMSE most widely used statistics reported for hydrology model calibration and validation show reasonable fit between the simulated and measured data. For distributed approach CMR value in all the cases is negative and ranges from -0.1 to -0.3. In lumped approach CMR value is always positive and ranges from 0.4 to 0.6. This indicates underestimation of runoff in case of lumped approach. Similar trend was found for all the storm events considered. The present analysis indicated that distributed
Figure 2. Simulated runoff hydrograph for the rainfall event on 21-6-96
approach gave good results in respect of watershed response against rainfall as compared to the lumped approach. The model simulated the heterogeneity of catchment characteristics and provided reasonable prediction, although the spatial distribution of rainfall is only given by five recording raingauge stations. Further, degree of spatial variability in a watershed can be represented by number of unique combinations of soil type and land use in the watershed but this methodology may fail if different combinations of soil and land use result in virtually equivalent curve numbers (Manguerra and Engel, 1998). However, this problem can be eliminated by using the curve number as the final measure of the watershed’s spatial variability.
For evaluation of grid size on the runoff depth, spatially distributed curve numbers were generated for different grid sizes of 23, 46, 92, 184, 368, 736 and 1472 m. and the resulting runoff for these grid resolutions was shown as figure 3. From the figure it is observed that the difference between simulated and observed runoff increases with the increase of grid size beyond 184 m. It may be observed that with increased grid resolution, response of watershed to hydrological process tend to be lumped. However, simulation of watershed with small grid size is more complex as spatial variation of hydrological parameters is high. Increasing grid size helps in simpler analysis with increased assumptions at the cost of accuracy in the results. Hence, sensitivity analysis of effect of grid size on runoff depth is a complex phenomenon and needs to make balance between computational time and accuracy. An analysis more detailed than manual methods is possible using a GIS integrated with distributed hydrological model offering crucial insight into effects of cell size. Thus, the grid cell size should be chosen such that the flow-path lengths in the drainage network are closely approximated. The modelling approach is capable of continuously simulating flow in distributed fashion for analyzing the impact of land use changes and as well as climate variability. Further, this model can be used to evaluate a futuristic water availability scenario for an agricultural watershed in eastern India.
Figure 3. Effect of grid resolution on runoff coefficient
5. CONCLUSIONS
The main advantage of distributed modeling is that the spatial variation of parameters is incorporated into the model response. Runoff prediction is a major component of watershed hydrologic modelling whether for resource conservation or environmental protection. In the present study, the distributed hydrological modelling approach considered the heterogeneity of catchment characteristics and provided reasonable prediction, although the spatial distribution of rainfall is only given by five recording raingauge stations. Advances in continuous time, distributed parameter hydrologic modeling as well as its integration with Geographical Information Systems (GIS) have led to the development of powerful tools for predicting runoff from watersheds. Particularly, GIS allowed the combination of remotely sensed data with spatial data forms such as topography, soil maps, and hydrologic variables such asrainfall distribution and soil moisture. This study has described the importance of parameterization issues involved when predicting watershed stream runoff.
6. REFERENCES
Abbott, MB, Bathurst, JC, Cung JA., O’Connell, PE, Rasmusses, J., 1986. An introduction to the European Hydrological System-Systeme. Hydrologique European SHE 2: Structure of a physically based distributed modelling system. J.
Hydrolo, 87, 61-77.
Beven, KJ. 1985. Distributed Model, In: MG Anderson and TP Burt (eds.), Hydrological Forecasting, Wiley
Beven, KJ,, Kirby, MJ., Schofield, N., Tagg AF., 1984. Testing a physically based flood forecasting model (TOPMOEL) for three UK catchments, J Hydrol. 69:119-143.
Arnold, JG., Williams, JR., Srinivasan, R., and King, KW., 1995. SWAT: Soil Water Assessment Tool, Texas A&M University, Texas Agricultural Experimental Station, Blackland Research Center, 808 East Blackland Road, Temple, Texas.
Beasley, DB., Huggins, LF., and Monke, EJ., 1980. ANSWERS: A Model for watershed planning. Transactions of
the ASAE. 23(4):938-944.
Chow, VT., 1959. Open-Chanel Hydraulics. Mcgraw–Hill, Newyork.
Chowdary, VM, Yatindranath, Kar, S and S.Adiga. 2004. Modelling of Non-point source pollution using GIS and Remote Sensing. Indian Journal of Remote Sensing. 32(1):59-73.
Cunge, JA., 1969. On the subject of a flood propagation computation method (Muskingum method). J. Hydraul. Res. 7(2):209-230.
Diskin, MH.,Wyseure, G., Feyen, J., 1984. Application of a cell model to the Bellebeek watershed, Nordic Hydrology, 15:25-38.
Diskin, MH., and Simpson, ES., 1978. A quasi –linear spatial distribution cell model for the surface runoff system, Water
Resource Bull.14:903-918.
Dooge, JC, 1973. Linear theory of hydrologic systems, US Dep.
Agric. Bull., 1468, 322 pp.
Foster, GR. and Lane, LJ., 1987. User Requirements USDA – Water Erosion Prediction Project (WEPP). NSERL Report No.1, National Soil Erosion Research Laboratory, West Lafayette, Indiana, 43 pp.
Greene, RG., Cruise, JF., 1995. Urban watershed modeling using geographic information system. J. Water Resour Plann
Manag, ASCE 121(4):318–325.
Maidment, DR., 1991. GIS and hydrologic modelling. In: Proceedings of the First International Conference/Workshop on Integrating Geographical Information Systems and Environmental modelling. Boulder, Colarado, September 15-19, 1991. Oxford Univ. Press, Cary North Carolina.
Morris, EM., 1980. Forecasting flood flows in grassy and forecasted catchments using a deterministic distributed mathematics model, IAHS Publ. No. 129 pp 247-255.
Natural Environment Research Council, 1975, Flood Studies Report. Vol III. Natural Environment Research Council, London.
Pandey, A., Chowdary, VM., Mal, BC., Billib, M. 2008. Runoff and sediment yield modeling from a small agricultural watershed in India using WEPP model. J.Hydrology (Elsevier), 348:305-319.
Ponce, VM., Hawkins, RH., 1996. Runoff curve number: has it reached maturity? J Hydrol Eng. 1(1):11–19
Ponce, VM. and Yevjevich, V, 1978. Muskingum-Cunge method with variable parameters J. Hydraulic. Div. ASCE, 104(HY12):1663-1667.
SCS, 1972. National engineering handbook, sec. 4: hydrology, soil conservation service (SCS). USDA, Washington, D.C.
Stuebe, MM., Johnston, DM., 1990. Runoff volume estimation using GIS technique. Water Resour Bull, 26(4):611–620
US Army Corps of Engineers, 1990. HEC-1, Flood Hydrograph package: User’s manual version 4, 1990, US Army Corps of Engineers, Hydrologic Engineering Center, Davis, CA.
Young, RA., Onstead, CA., Bosch, DD. and Anderson, WP., 1987. AGNPS, Agricultural Non-point Source Pollution Model: A large watershed Analysis Tool. USDA –ARS, Conservation Research Report 35, Washington DC., 77 pp.
Yu, PS., 1990. Real time grid based distributed rainfall-runoff model for flood forecasting with weather radar, PhD Thesis. Dept of Civil Engineering. Univ. Of Birmingham, U.K.