THE URBIS PROJECT: IDENTIFICATION AND CHARACTERIZATION OF
POTENTIAL URBAN DEVELOPMENT AREAS AS A WEB-BASED SERVICE
Nina Manzkea, Martin Kadab, Thomas Kastlera, Shaojuan Xua, Norbert de Langea, Manfred Ehlersa
a
Institute of Computer Science, Universität Osnabrück, Germany {firstname.lastname}@uni-osnabrueck.de
b
Institute of Geodesy and Geoinformation Science, Technische Universität Berlin, Germany [email protected]
Commission IV, WG IV/5
KEY WORDS: Open Data, Information Services, Urban Atlas, Spatial Database, Vacant Land
ABSTRACT:
Urban sprawl and the related landscape fragmentation is a Europe-wide challenge in the context of sustainable urban planning. The URBan land recycling Information services for Sustainable cities (URBIS) project aims for the development, implementation, and validation of web-based information services for urban vacant land in European functional urban areas in order to provide end-users with site specific characteristics and to facilitate the identification and evaluation of potential development areas.
The URBIS services are developed based on open geospatial data. In particular, the Copernicus Urban Atlas thematic layers serve as the main data source for an initial inventory of sites. In combination with remotely sensed data like SPOT5 images and ancillary datasets like OpenStreetMap, detailed site specific information is extracted. Services are defined for three main categories: i) baseline services, which comprise an initial inventory and typology of urban land, ii) update services, which provide a regular inventory update as well as an analysis of urban land use dynamics and changes, and iii) thematic services, which deliver specific information tailored to end-users' needs.
1. INTRODUCTION
Urban sprawl is a serious problem in many European cities. One objective of the European Union is to reduce the land take and counteract the proceeding sprawl (Couch et al., 2007). In terms of sustainable urban planning, the identification of development potentials inside existing urban structures is required to foster a densification of the urban area. Also the preservation of green urban areas and the enhancement of the green infrastructure in cities facilitate sustainable planning. Suitable sites which can be regarded as Potential Development Areas (PDA) may be found focussing on, e.g., vacant or underused land, brownfields, gaps in built-up areas, or other open spaces.
Initiatives like the European Open Data Strategy and INSPIRE emphasise the relevance of free and open data, which is an important requirement for a publicly accessible information system in Europe (Craglia and Annoni, 2007). In this context, the Urban Atlas as part of the Copernicus Land Monitoring Services provides promising opportunities. Also Earth observation (EO) data and crowd sourced information from OpenStreetMap offer a valuable contribution for an information system and services with a Europe-wide applicability.
The development, implementation and validation of services related to vacant land or PDA in European Functional Urban Areas (FUA) is the main objective of the URBIS project. The developed user-oriented decision support information system facilitates the identification of gaps and green spaces in urban structures as well as the evaluation of suitable sites for redevelopment and land recycling based on objective criteria, with the intention of mitigating urban sprawl in Europe. In compliance with open standards and INSPIRE principles, the results are provided through web services and are compatible with standard GIS technology. Moreover, the URBIS
information system offers online tools which support end-users to evaluate suitable sites tailored to their specific needs. The URBIS project, which is funded by the EU FP7 ICT PSP as part of the Competitiveness and Innovation Framework Programme, started in April 2014 and has a scheduled duration of three years. Partners from four nations are participating in the project: GISAT S.O.R (Czech Republic), Systèmes d’Information à Référence Spatiale (SIRS) SAS (France), Universität Osnabrück (Germany), Universita Degli Studi Di Genova (Italy), Projektgruppe Stadt und Entwicklung (Germany), Agence de Développement et d’Urbanisme du Grand Amiénois (France).
The implementation, testing, and validation of the URBIS services are conducted in three selected pilot studies, representing areas with a specific need for vacant land monitoring:
Greater Amiens (France)
City of Osnabrück (Germany)
Moravian-Silesian Region (Czech Republic)
In this paper, the overall concept of the URBIS services is outlined and the current status of the implementation of the web-based services is presented. The first prototype of the baseline services has been implemented, whereas the implementation of the update and thematic services is currently in progress.
2. RELATED WORK
URBIS aims to provide services that can be applied on a local and regional level as well as is transferable to FUAs across Europe. Several other projects on a European level have developed web-based information systems and databases enabling urban planners and related stakeholders to explore and The International Archives of the Photogrammetry, Remote Sensing and Spatial Information Sciences, Volume XLI-B4, 2016
integrate geo-information related to specific topics. For example, the services of the DECUMANUS project contain spatio-temporal mappings of urban areas and imperviousness with an emphasis on climate change (Maroncini et al., 2015). The TIMBRE project implemented a “Site Assessment Tool” indicating relevant factors for redevelopment, and a “Brownfield Prioritization Tool” to map the potentials of unused urban space (Pizzol et al., 2016). The CircUse project mainly focuses on circular flow land use management (Ferber et al., 2011).
On a national or regional level, a number of operational information systems cover the topic of urban development potential. They are often confined to a state territory or a local region and focus on special contextual aspects which hampers the comparability among them. Examples for national initiatives are the BBSR-Study recording the infill development potentials in Germany (Schiller et al., 2013), the National Database of Brownfields of the Czech Republic (Klusáček et al., 2013), and the National Land Use Database comprising an inventory of land use in Great Britain (Casettari, 2003). An example for a regional system providing an inventory and information about gap sites and vacancies is the BLK, which is limited to the use in municipalities in the German federal state of Lower Saxony (LGLN, 2013).
3. CONCEPT OF URBIS SERVICES
Developing and implementing services on the basis of open geospatial data on a European scale is a challenging task due to the heterogeneity and varying availability of data. In scope of the project, a concept has been elaborated considering the use of a variety of data sources and the implementation of a harmonized spatial database as a basis for the provision of services related to specific domains.
3.1 Source datasets
The main objective of URBIS is to develop services on the basis of open geospatial data. In particular, data provided by the Copernicus Land Monitoring Services from the European Environment Agency is utilized. Among others, especially the HR Imperviousness Layer and the Urban Atlas have a high relevance for the project.
The Urban Atlas (UA) provides land use maps that cover many FUAs across Europe (EEA, 2014). It is available for reference determining site characteristics. Potential development areas can exhibit various types of land cover and can originate from a variety of previous land uses. Therefore, many UA classes might include potential sites of interest for redevelopment. As another primary data source, original UA satellite images (SPOT5 images with spatial resolution of 2.5 meters) are processed to demonstrate the potential of EO data in the URBIS context.
OpenStreetMap (OSM) serves as an additional valuable open data source. It allows to extract information about site characteristics, e.g. existing buildings, connectivity to transportation networks, etc. Since OSM data is mostly provided by volunteers and does not follow specified update intervals, reliability is a considerable issue and data items, especially from other object classes than the street network data,
have to be used with care. For the URBIS project, the street network, which is generally regarded as sufficiently complete in urban regions (Neis et al., 2011), is used for calculating criteria for sites of interest. Also building footprints from OSM are considered as an information source, but their use for URBIS is restricted to selected cities, as the coverage of mapped buildings has been still lacking in recent years also for several larger cities (Hecht et al., 2013).
Additionally, for the determination of more specific criteria it is necessary to integrate ancillary data which might not always be openly available. Examples are 3D point clouds or Digital Surface Models originating for instance from laser scanning data. In order to demonstrate the potential of these datasets for the characterization of PDAs, e.g. with regards to volumes of buildings or tall vegetation, datasets provided by URBIS pilot studies' partners are used.
3.2 URBIS service domains
Within the scope of the URBIS services, three separate layers providing information in different domains have been defined: Green Layer, Grey Layer, and Urban Land Use Typology and Dynamics (ULUTD) Layer. The Green Layer includes information about urban "green" sites which are regarded as urban gaps and open spaces. These sites are often characterized by the absence of buildings and are usually covered by vegetation, but can be also covered by non-vegetated bare ground or sealed surfaces. The Green Layer contains sites which have a potential for future developments as well as for permanent green areas that e.g. form the green infrastructure within the urban environment. The latter are often not available for urban development measures, but should rather be buildings. They can also be partly covered by vegetation. Their appearance strongly depends on the type of brownfield which is mainly defined by the previous type of use, for example industry, commercial, military, or residential use.
While the Green and Grey Layer provide a basic inventory of urban sites, the Urban Land Use Typology and Dynamics Layer describes the internal structure of urban land and their spatial patterns in a wider context, allowing the analysis and comparison of regions at a national or European level.
3.3 Data processing
For the creation of the above mentioned URBIS layers, an exhaustive information extraction is required: The underlying spatial references have to be defined, which can be provided by already existing datasets including spatial objects (e.g. geographical features within user-provided datasets). Datasets are also created by selecting spatial objects based on certain criteria, which may be confined to sites located inside the urban area. In addition, a large number of objective criteria and indicators are calculated which allow a detailed characterization of the sites of interest. Besides common vector data analysis techniques, methods of the following domains are applied to the creation of the URBIS services:
Image classification and multi-temporal analysis
The UA 2012 product has a minimum mapping unit of 0.25 ha for urban classes. With the goal to reduce the minimum mapping unit and thus enhance the accuracy of the extracted The International Archives of the Photogrammetry, Remote Sensing and Spatial Information Sciences, Volume XLI-B4, 2016
information, a central part of URBIS is the processing of EO imagery. By means of advanced image analysis techniques, three derived products are produced based on original UA imagery:
land cover classification of SPOT5 images;
imperviousness map, indicating sealed areas, at 5m spatial resolution;
vegetation map, indicating vegetated areas;
URBIS green/open spaces map, containing pixel-wise information on green and open spaces in urban areas. A multi-temporal analysis is performed to detect changes between different reference years. All image analysis outcomes are in raster format and serve as intermediate products for further calculations.
3D point cloud / DSM processing
The processing of 3D point clouds from laser scanning data or Digital Surface Models is performed for the computation of site specific criteria for which 3D information is needed. The developed methodology includes classification (ground, high vegetation, and buildings), building and vegetation outline extraction, and volume estimation. The extracted information is particularly relevant for the Grey Layer since it allows an estimation of potential demolition costs. As this type of data is not available as open data in the required resolution, datasets delivered by the pilot studies' partners are needed.
3.4 URBIS service categories
The URBIS core services are provided as baseline and update services. Within the scope of these services, a status quo analysis is implemented for the three layers introduced in section 3.2 to provide basic information about sites in the urban area that could have a potential for future redevelopment, including a detailed characterization of these sites. For each baseline service layer, a regular update complementary to the Urban Atlas update interval is planned and implemented as URBIS update services. The update services also include the monitoring of changes between two reference years. In addition to the baseline services, several thematic services are derived that provide specific information to certain topics, according to the end-users' needs.
3.4.1 Baseline services: The URBIS baseline services compile a basic inventory and typology of urban land, including sites that might have a potential for redevelopment as well as sites that should be preserved. As part of the information services, a status analysis is performed to provide a detailed characterization of the sites or areas of interest. To be compliant with the Urban Atlas products, which serve as the primary data source, the status analysis is performed for the reference year 2012 (i.e. the latest available Urban Atlas product).
The general workflow for the creation of each URBIS baseline service layer consists of three stages: First, a set of spatial objects, which are individual sites of interests or analytical units at larger scales, represented by polygonal geometries, is compiled. Then, for each spatial object, a comprehensive set of criteria and indicators is calculated; and finally, the sites are evaluated based on their properties with regards to their potential for future redevelopment.
To obtain the initial layers in the first stage, the basic spatial objects (usually given as polygons or grid cells), which can be spatial reference units at different scales, are compiled. The spatial reference units considered in URBIS include individual sites of interests, functional urban blocks, 1km grid cells, sub-city districts, and local administrative units (LAU). Due to the
flexibility of the developed approach, spatial reference units are not limited to the listed ones, but are exchangeable.
Within the second stage, the defined spatial references are enriched by calculated status criteria and indicators. A comprehensive list of criteria and indicators has been prepared based on the evaluation of end-user requirements and outcomes from other existing initiatives. Specific criteria describe the properties of individual sites of interest or functional urban blocks at a local level, and are grouped into eight categories, namely physical properties, shape characteristics, land cover, land use, existing development, existence of infrastructural networks, surrounding local context, and environmental conditions. The indicators serve for larger analytical units; categories are land use structure, sprawl indicators, and fragmentation/connectivity. Based on a feasibility evaluation, each criterion and indicator was labelled as either mandatory or optional, depending on the availability of the required source datasets and reliability of methods suggested for the criteria calculation. Criteria and indicators classified as mandatory are based on datasets which are generally available for all pilot sites as well as for other European cities, mainly Urban Atlas thematic layers, Urban Atlas imagery, and OSM data. They are calculated for the respective spatial reference units, as there are no constraints for their calculation. Criteria classified as optional are usually based on ancillary source datasets, which are not available for all pilot sites and not available all over Europe. Their coverage may be incomplete, or in-situ information is needed for the calculation of those criteria. The third stage in the workflow comprises the evaluation of individual sites of interest which are part of the Green and the Grey Layer. In a rule-based approach, the sites of interest are assessed with regards to predefined scenarios as well as based on user-defined selections. The implementation of the third level is approached with the URBIS thematic services, which provide for example a specific Evaluation Tool (see section 3.4.3).
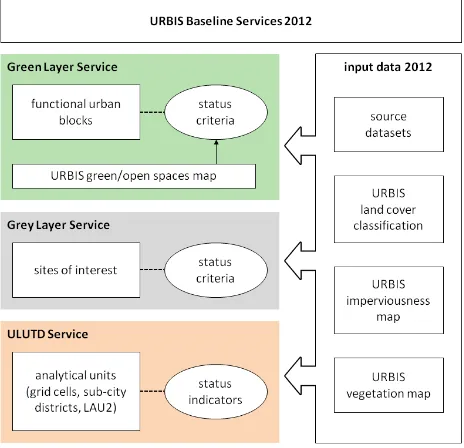
Figure 1. Structure of the URBIS Baseline Services
An overview of the structure of the baseline services 2012 is given in Figure 1. The URBIS Green Layer baseline service focuses on information about green and open spaces in the urban area. With the integration of land cover classification results and Urban Atlas polygons, which were selected based on specific rules, a green/open spaces raster map as an The International Archives of the Photogrammetry, Remote Sensing and Spatial Information Sciences, Volume XLI-B4, 2016
intermediate outcome is produced, containing pixel-based information on green/open space in the urban area. Applying object-based image analysis techniques, each "green" pixel is assigned to a type of green/open space: Depending on the size of the "gap" and land use class of the Urban Atlas polygon where the pixel is located, pixels are assigned to vacant or underused land, gap in built-up area, urban green, non-urban green, or greenfield. For the Green Layer service, the basic spatial objects are functional urban blocks, provided by selected polygons extracted from the Urban Atlas. These urban blocks are enriched by the calculation of a number of criteria. A particular focus is on criteria which characterize the green/open space inside each urban block. This includes for example the dominant type of green/open space or the size of the largest green/open space patch.
In order to build up an inventory of brownfield sites for the URBIS Grey Layer baseline service, the access to existing data about brownfields is necessary. The heterogeneity of the appearance of brownfield sites is the reason why it is nearly impossible to detect them using the available satellite images with a resolution of 2.5m pixel size and the Urban Atlas alone. Thus, local brownfield datasets, provided by URBIS pilot users, are the basis for the compilation of the Grey Layer's basic spatial objects. Equivalent to the Green Layer, a large set of criteria is calculated to provide detailed information reflecting the sites' status. As an intermediate product which results from the processing of the SPOT5 images, an enhanced describing status phenomena dedicated to the categories land use structure, sprawl indicators, and fragmentation/connectivity are calculated based on the Urban Atlas thematic layers and ancillary data like socio-economic statistics.
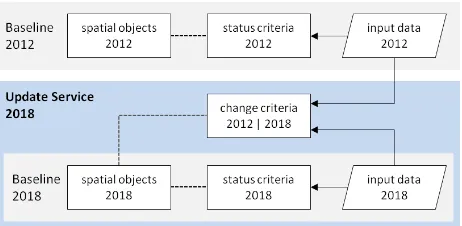
3.4.2 Update services: The URBIS update services regularly update the URBIS baseline layers in sync with upcoming updates of the Urban Atlas. They include the maintenance of the current spatial database following the same workflow as the baseline services, and the identification of changes compared to the previous year of reference. The schema of the URBIS update services is illustrated in Figure 2.
Within each update, new baseline layers are created for the update reference year. This includes a spatial update with regards to the basic spatial objects as well as a temporal update of the status criteria. A spatial update is needed because the spatial extent of the sites and thus the delineation could have changed compared to the previous baseline reference year. The status criteria are calculated based on input datasets with the update year as reference year.
As a supplement to the updated baseline layers, a change detection is performed and a set of change criteria is calculated in order to describe quantitative changes between two consecutive reference years (e.g. 2012 and 2018). In case of individual spatial objects, the change criteria are calculated only with reference to the current spatial objects of the update year. Since the shape of spatial objects may have changed compared to the baseline service layers, it would not be reasonable to simply compare the status criteria of the two years. Instead, the change criteria are calculated based on the input data from both reference years, not on the status criteria itself. If for example a regular grid with a given cell size is applied, the spatial reference remains the same and thus a comparison of the status
criteria and indicators of several years is possible without considering an update of spatial objects.
Figure 2. General structure of the URBIS update service
Since the first update is scheduled for the future year 2018, the applicability of the approach is demonstrated with the implementation of an URBIS "backdate" service for the reference year 2006, which is in line with the first Urban Atlas product. In general, the proposed update services concept is adapted without modifications. A spatial and temporal backdate is performed for the reference year 2006, producing the baseline status layers for 2006. Change criteria are then related to spatial objects of 2012 and calculated based on input data of 2006 and 2012.
3.4.3 Thematic services: URBIS thematic services are defined as services related to specific topics and are derived from the baseline and update layers as downstream services, prepared for scenarios and tailored to specific needs of end-users. Additional thematic information is prepared by implied specific local data. In particular for the pilot studies, the thematic services are implemented by enriching the baseline inventory with information from additional datasets which are exclusively available from the pilot studies' partners, like 3D point clouds from laser scanning data. For instance, the estimation of demolition costs is one thematic service related to Grey Layer sites.
In addition, web tools are implemented and provided. The URBIS Evaluation Tool allows end-users to explore URBIS results in detail and evaluate them by using advanced filtering functions. Thus, individual priorities of end-users can be considered. The URBIS Integration Tool offers advanced analysis functionalities, e.g. for the benchmarking of different analytical units or for the integration of user-provided data.
4. WEB-BASED INFORMATION SYSTEM
The URBIS information system has been designed and implemented as a web-based solution according to the requirements of an interoperable system. The client-server architecture is mainly built on free and open source software and complies with open standards. A central component of the system is the PostgreSQL/PostGIS spatial database in which all data compiled for the URBIS services is stored and processed. The GeoServer software is utilized as the server component to manage the data provision and access. One objective of the project is to provide the developed services and the prototype of the system in accordance with INSPIRE principles. In order to fulfil this aim, the data is provided through OGC web services and metadata is integrated following INSPIRE guidelines to ensure a certain level of interoperability.
Figure 3. Prototype of the URBIS Evaluation Tool
Via the URBIS Evaluation Tool (Figure 3), the information and data produced with the URBIS services can be visualised and explored by end-users in an online map tool that can be used even without having specific GIS skills. Moreover, the URBIS Integration Tool provides extended data access and advanced capabilities, in order to fulfil more specific requirements.
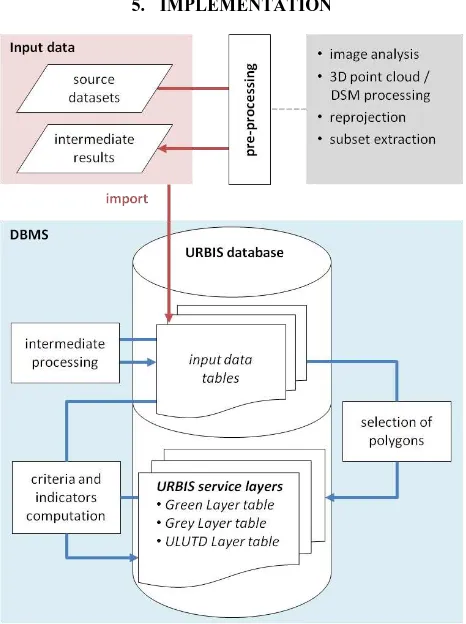
5. IMPLEMENTATION
Figure 4. Implementation of the URBIS services
The URBIS project aims at a service implementation in which most of the data transformations, computations, and service layer generation steps are performed inside the spatial database system. Due to the heterogeneity of the source datasets, several pre-processing tasks have to be performed before importing relevant data into the spatial database. The pre-processing includes for example the reprojection of data into the target coordinate reference system or the extraction of subsets from large datasets like the OSM data. Highly complex tasks like the classification of remote sensing images cannot be done inside the database system and have to be implemented externally using specific software. The outcomes are then imported as
intermediate results into the URBIS database. The selection of polygons for the initial URBIS layers as well as the calculation of criteria and indicators are implemented inside the database management system. Figure 4 shows the workflow of the URBIS service implementation.
5.1 Image analysis of remote sensing data
The main outcome of the processing of high resolution multi-spectral imagery are thematic land cover classification maps with a spatial resolution of 2.5 meters, containing the automatically detected classes "buildings", "paved surfaces", "low vegetation", "tall vegetation", and "bare soil", and additional classes imported from the Urban Atlas layers: "water surfaces", "railroads", and "road network". The classification is based on feature extraction and pixel-wise classification methods. Besides the images which are classified (SPOT 5 images of the URBIS pilot sites; 2.5 meter pixel spacing), features extracted from these images, Urban Atlas layers and training maps are involved. In scope of the URBIS update services, multi-temporal techniques are employed to detect temporal changes. A more detailed overview about the applied image analysis methodology is presented by Moser et al. (2015).
5.2 Spatial database
The core part of the system is a PostgreSQL/PostGIS spatial database performing the storage of all relevant data for the URBIS service implementation. The source datasets which are processed inside the database for information extraction, e.g. the UA layers, are imported into the database and stored as input data tables. Also intermediate products from pre-processing tasks are imported into the database, for instance, classification maps or imperviousness maps from image processing. Thus, the spatial database stores data as vector geometries as well as raster images. The goal is to integrate and make all required data available for the criteria calculations used by URBIS services as input database tables, so that no additional access to data stored externally in the file system is necessary.
5.3 Criteria calculation
The computations on the input data, in particular the criteria calculations, are implemented in PL/pgSQL, a procedural language for PostgreSQL. This results in a flexible service implementation with a high degree of automation. Procedures are implemented only once and reused several times without or with little human interactions, and input data can be easily exchanged. The processing is based on vector and raster data stored in input tables inside the spatial database and follows standard geospatial workflows. Actions or sequences of actions that would otherwise be manually performed in a GIS environment are translated into SQL queries. Some of the criteria calculations are implemented simply using existing PostGIS functions: a) functions based on geometric features, like for the determination of the area of a polygon or its shape, and b) functions based on rasters, like the determination of the degree of vegetation coverage or the degree of soil sealing. The computations of other criteria require more complex set-ups. For example, for the calculation of the minimum distance to items of the transportation system (motorway junction; main road; railway station), a routing on the OSM street network is performed, utilizing the open source routing library pgRouting. This implies a pre-processing of the raw OSM data in order to The International Archives of the Photogrammetry, Remote Sensing and Spatial Information Sciences, Volume XLI-B4, 2016
produce the street network's topology, implemented in URBIS with the osm2po converter tool (Moeller, 2015).
6. RESULTS OF PILOT STUDIES
The URBIS baseline services have been implemented for Amiens, Osnabrück and Ostrava, as they are the core cities of the three pilot study regions. Figure 5 shows the URBIS green/open spaces map for a district in Ostrava. Pixels of the map are classified according to the type of green/open space patch they belong to.
Figure 5. URBIS green/open spaces map (Ostrava)
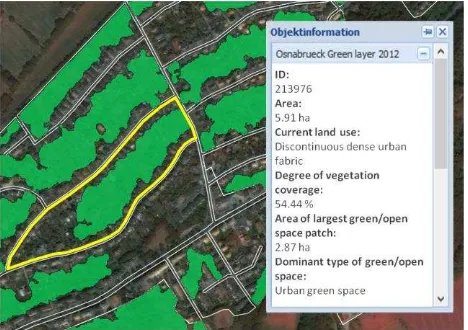
The highlighted Green Layer site in Figure 6 is a favourable example for the occurrence of green/open space inside urban fabric blocks. The site is classified in UA as "discontinuous dense urban fabric". The large green patch which is surrounded by residential buildings constitutes 49% of the total area of the block. An evaluation of the site characteristics based on the calculated criteria allows an assessment about the actual suitability for a densification of the urban fabric.
Figure 6. URBIS Green Layer: site-specific information with focus on green/open space inside UA block (Osnabrück) (background image ©Google)
In scope of the URBIS Grey Layer service, in particular criteria that provide information about existing man-made structures, e.g. buildings or sealed areas, have been implemented in order to characterize brownfield sites. The site-specific information can be either explored in the URBIS online tool or retrieved as a polygon layer containing the brownfields with the dedicated attributes through a Web Feature Service. The highlighted site in Figure 7 shows an area in Osnabrück that was formerly used by the military and which is planned to be redeveloped in a
conversion process in the next years. For instance, the number and volume of buildings as well as the total area of sealed soil are important criteria in terms of estimating potential demolition costs.
Figure 7. URBIS Grey Layer: site-specific information for a former military used area (Osnabrück) (background image ©Google)
7. DISCUSSION & CONCLUSION
The implementation and testing of the baseline services in the three pilot studies showed that crucial factors for their applicability are the availability, spatial resolution and completeness of the underlying data. The Urban Atlas as the central data source fulfils the requirements for a European-wide applicable information system as it is available for many urban areas across Europe. In scope of the URBIS Green Layer service, valuable information could be derived for the production of green/open space maps in urban areas. In particular in combination with the processing of high resolution satellite images, an enhancement of the minimum mapping unit compared to UA sites and thus a refinement of individual urban green sites has been achieved.
Concerning the URBIS Grey Layer service, the lack of available open data with a sufficient spatial resolution hampers the detection of brownfields in urban areas. User-provided information about the locations of potential brownfields is still an essential requirement. Thus, the URBIS Grey Layer service is mainly focused on the calculation of objective criteria. For the implementation of the URBIS pilot studies, some datasets were exclusively provided by local pilot users, like high resolution Digital Surface Models originating from aerial laser scanning data. The provision of these datasets enables the development and implementation of sophisticated methods which enhance the characterization of PDAs.
The URBIS information system is potentially applicable to all European FUAs covered by the Urban Atlas product. This enables the comparison of urban regions not only on a national but also on a European level. All URBIS information that is solely based on Urban Atlas and OSM data, which are both open and area-wide available, can be derived and processed with a high degree of automation. For the ancillary datasets, in particular high resolution satellite images, specific conditions for the procurement, licensing costs, and processing issues have to be considered individually.
The presented results reflect the current implementation status of the URBIS services. The upcoming project phase focuses on The International Archives of the Photogrammetry, Remote Sensing and Spatial Information Sciences, Volume XLI-B4, 2016
the enhancement of the baseline services based on end-users' feedback, and the implementation of the update services. Also the thematic services will be further implemented and especially the URBIS online tools will be optimized according to the users' needs.
ACKNOWLEDGEMENTS
The URBIS project has received funding from the EU FP7 ICT Policy Support Programme as part of the Competitiveness and Innovation Framework Programme under Grant Agreement No. 621125. The authors also thank all project partners.
REFERENCES
Cassettari, S., 2003. A new generation of land use mapping in the UK. In: The Cartographic Journal, Vol. 40(2), pp. 121-130.
Couch, C., Leontidou, L., Petschel-Held, G. (Eds.), 2007. Urban sprawl in Europe: landscape, land-use change and policy. Blackwell, Oxford.
Craglia, M., Annoni, A., 2007. INSPIRE: An innovative approach to the development of spatial data infrastructures in Europe. In: H. Onsrud (Ed.), Research and Theory in Advancing Spatial Data Infrastructure Concepts. ESRI Press, Redlands, pp. 93-105.
EEA, 2014. Urban Atlas. http://www.eea.europa.eu/data-and-maps/data/urban-atlas/ (24.03.2016).
Ferber, U., Jackson, J. B., Starzewska-Sikorska, A., 2011. Circular Flow Land Use Management. In: Proceedings of 16th International Conference on Urban Planning, Regional Development and Information Society, Essen, Germany, pp. 95-103.
Hecht, R., Kunze, C., Hahmann, S., 2013. Measuring Completeness of Building Footprints in OpenStreetMap over Space and Time. In: ISPRS International Journal of Geo-Information, Vol. 2(4), pp. 1066-1091.
Klusáček, P., Krejčí, T., Martinát, S., Kunc, J., Osman, R., Frantál, B., 2013. Regeneration of agricultural brownfields in the Czech Republic–Case study of the South Moravian Region. In: Acta Universitatis Agriculturae et Silviculturae Mendelianae Brunensis, Vol. 61(2), pp. 549-561.
LGLN, 2013. Baulücken- und Leerstandskataster (BLK) – Leitfaden.
http://www.gll.niedersachsen.de/download/73496/Leitfaden_St and_11.2013_.pdf (04.04.2016).
Marconcini, M., Metz, A., Zeidler, J., Esch, T., 2015. Urban monitoring in support of sustainable cities. In: Proceedings of Joint Urban Remote Sensing Event (JURSE'15), 30 March - 1 April, Lausanne, Switzerland.
Moeller, C., 2015. osm2po. http://osm2po.de/ (13.04.2016).
Moser, G., Krylov, V., De Martino, M., Serpico, S., 2015. The URBIS Project: Vacant Urban Area Classification and Detection of Changes. In: Proceedings of Joint Urban Remote Sensing Event (JURSE'15), 30 March - 1 April, Lausanne, Switzerland.
Neis, P., Zielstra, D., Zipf, A., 2011. The street network evolution of crowdsourced maps: OpenStreetMap in Germany 2007–2011. In: Future Internet, Vol. 4(1), pp. 1-21.
Pizzol, L., Zabeo, A., Klusáček, P., Giubilato, E., Critto, A., Frantál, B., Martinát, S., Kunc, J., Osman, R., Bartke, S., 2016. Timbre Brownfield Prioritization Tool to support effective brownfield regeneration. In: Journal of Environmental Management, Vol. 166, pp. 178-192.
Schiller, G., Oertel, H., Blum, A., 2013. Innenentwicklungspotenziale in Deutschland – Ergebnisse einer bundesweiten Befragung. In: G. Meinel, U. Schumacher, M. Behnisch (Eds.), Flächennutzungsmonitoring V - Methodik, Analyseergebnisse, Flächenmanagement. Rhombos-Verlag, Berlin, IÖR Schriften 61, pp. 51-59.