COMPUTING AND MONITORING POTENTIAL OF PUBLIC SPACES BY SHADING
ANALYSIS USING LIDAR DATA IN 3D CITY MODELS
A. Zwolińskia * , M. Jarzemskib
a WPUT, Institute of Architecture and Spatial Planning, Cyber Urban Centre, PL71-210 Szczecin, Poland - [email protected] b LINUS – Spatial planning, GIS, programming, PL70-454 Szczecin, Poland - [email protected]
Commission VI, WG VI/4
KEY WORDS: public spaces, tall buildings, 3D city models, shading analysis, GIS, LIDAR data
ABSTRACT:
The paper regards specific context of public spaces in “shadow” of tall buildings located in European cities. Majority of tall buildings in European cities were built in last 15 years. Tall buildings appear mainly in city centres, directly at important public spaces being viable environment for inhabitants with variety of public functions (open spaces, green areas, recreation places, shops, services etc.). All these amenities and services are under direct impact of extensive shading coming from the tall buildings. The paper focuses on analyses and representation of impact of shading from tall buildings on various public spaces in cities using 3D city models. Computer environment of 3D city models in cityGML standard uses 3D LiDAR data as one of data types for definition of 3D cities. The structure of cityGML allows analytic applications using existing computer tools, as well as developing new techniques to estimate extent of shading coming from high-risers, affecting life in public spaces. These measurable shading parameters in specific time are crucial for proper functioning, viability and attractiveness of public spaces – finally it is extremely important for location of tall buildings at main public spaces in cities. The paper explores impact of shading from tall buildings in different spatial contexts on the background of using cityGML models based on core LIDAR data to support controlled urban development in sense of viable public spaces. The article is prepared within research project 2TaLL: Application of 3D Virtual City Models in Urban Analyses of Tall Buildings, realized as a part of Polish-Norway Grants.
* Corresponding author
1. CONTEXT 1.1 No-shadow urban challenge
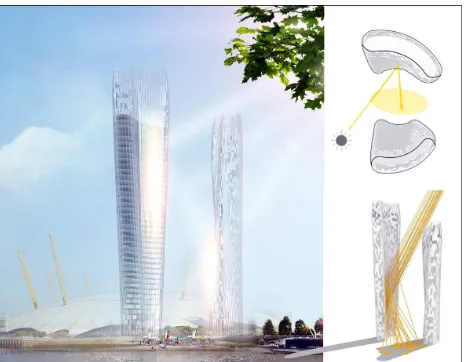
This has been over two centuries of urbanization processes in Europe. The process was driven at its beginning in the 19th century by prosperous Dutch and English economies, but later over time urbanization has flooded entire area of Europe. In sense of urban development it is inseparable with increasing density of built-up areas of European cities. Important determinants of intensity of this process are prognoses, that until year 2025 over 60% of world’s population will live in cities – already in year 2008, the world’s population in cities have reached level of 50%. Urbanization process is apparent in cities in many spheres and aspects (Zwoliński, 2015). One of the focuses in continuous challenge for quality of life in cities is standard of space between buildings (public spaces) in sense of physical structure and perception of its users. The quality is not only about aesthetics, but presently has become environmental efficiency, economic profitability, social coherence etc. Tall buildings play in this process crucial role because of its impact on urban areas. Skyscrapers present high efficiency in sense of space management (occupy limited areas against high intensity ratio), but its impact in other aspects can be observed in scale of entire city landscape. One of those is shadowing and occlusion. Too much shadow in European climate, mostly in mid-north parts is a problem, turning public spaces into uncomfortable dark areas. The “no-shadow” challenge for tall buildings is very actual and represented by very recent No-shadow Tower concept by Christian Coop (NBBJ) in London. It just proves, that comfort of space between buildings is highly demanded.
Figure 1. No-shadow tower concept by Christian Coop, NBBJ, 2015, by: www.wired.com
1.2 Tall buildings in Europe
landmarks and proof of greatness of American cities. The entire urban process of densification and rapid urban development has come with the delay to Europe. Regardless specific restrictions of historical urban structure, intensity of tall buildings development in centres of European cities raises exponentially in last half of century (Fig. 2).
Figure 2. Development of European tall buildings in time-line since 1952, by: CTBUH Journal, 2013 Issue II Nowadays, the most intensified process of skyscrapers development has moved to Arabic states and Far East. However, the data from 2006 indicate a balance between Europe, Asia and North America in development rate. Recent development of tall buildings clearly shows increased attention to environmental context, urban climate issues and policies, high technology and architectural form. The already reached European tall buildings height of 360m (Moscow), soon will be raised to 460m (St. Petersburg).
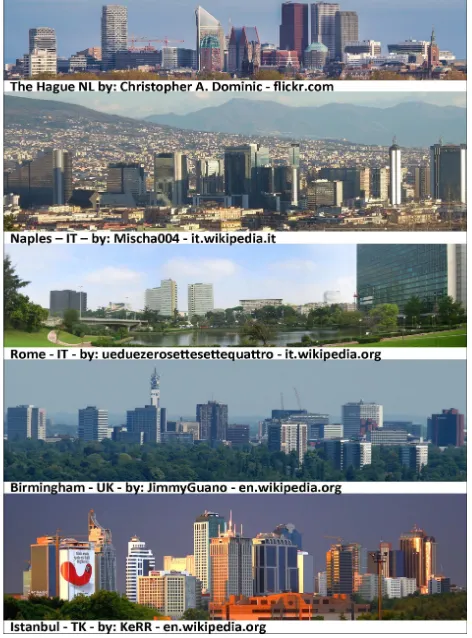
Figure 3. Comparison of cityscapes of European cities affected by location of tall buildings, by: author
Presently, it is more than 350 buildings over 140m height, together with those under construction. Tall buildings affect cityscape of majority of European cities (Fig. 3). Regardless undisputed urban landmark and representative features, the tall buildings have crucial impact on entire urban structure of cities and public spaces beneath. Despite difficulties in precise measurement of the impact, such aspects as perception of public spaces, thermal comfort, sunlight access and others are clearly affected by location of tall buildings. The aspects of shadow coming to open spaces and occlusion by skyscrapers within city centres in sense of possibilities of measurement using virtual city models based on LiDAR data is put under observation in the article.
1.3 Virtual city models.
Urbanization processes need the city, the city needs techniques and tool to be managed, controlled, observed, presented and analysed. Computer industries are still in chase to develop and offer more and more complex computer tools for such tusks. One of such challenges are geovirtual environments to explore, analyse and manage space we live in. Specific component are virtual city models, which are in fact composition of: digital terrain models (DTM), building models, street-space models, green-space models etc (Döllner, Kolbe, Liecke, Sgouros, Teichmann, 2006). Virtual city models and related tools and continuously under intensive development. The main challenges so far are accessibility of 3D models, data exchange platform and storage of enormous amount of data. The common spheres on development are: standardization of spatial data with prospective cityGML standard for virtual city models (part of general XML language), introducing semantics to virtual city models to provide recognizable structure of multi-use spatial data – not only for commercial visualization purposes, integration of data exchange platforms to assure possibility of updating virtual city models, automation of operation on 3D city models to overcome effect of scale in amount of data. However, it is initially important to recognize process of development of virtual city models. Development of models stored in cityGML format is mainly driven by processes and techniques from sphere of GIS computer systems and techniques. There are following types of core data used for development. The Cadastre data is key component to get such information as footprints of buildings and structures in cities, as well as recognizing the ownership structure of urban areas – plots. The Digital Terrain Model (DTM) in high resolution with complementary aerial photography to cover the DTM with textures are the other type. Finally, combination of LiDAR data coming from airborne laser scanning and advanced analysis of ortophotography coming from HRSC (High Resolution Stereoscopic Camera). The last mentioned analysis provides possibility of texturing models, automated generation of roof types using additional footprint data. One of important computer tools for cityGML models generation is Building Reconstruction developed by virtualCITYsystems, Berlin.
2. LIDAR & CITYGML
2.1 LiDAR - core data for cityGML models
The case of Bavarian State Office for Surveying and Geoinformation project for development of over 8 million buildings virtual city model based on cityGML exchange interface is very interesting to present relation between initial LiDAR data for cityGML standard (Aringer, Roschlaub, 2012). The Bavarian project used specific combination of initial data – cadastre information on floor plans and categorized roofs delivered to database serving the project and on the other side airborne LiDAR data was used in form of point cloud to generate DEM and DSM. Geometric Delaunay triangulation was applied to generate parts of the model (mainly roofs). Matching point cloud to cadastre data updated by terrestrial measurements allowed further operations for automated generation of the model. The Building Reconstruction software by VCS was used in process of converting LiDAR data into 3D model. In extension, updating of the model – particularly in sense of outdated LiDAR data was programmed on the basis of high-quality photogrammetry flights and image matching. Technical specification of LiDAR data and process of conversion was presented in other documents (Aringer, Roschlaub, 2012), but the case shows compatibility of cityGML interface with LiDAR technology and appropriateness of using virtual city models for many analytic purposes. It is important, that LiDAR is a discrete type of data and has to be processed into a continuous model – cannot provide shadows directly.
2.2 cityGML – perspective standard for virtual city models
Initially virtual city models were introduced for visualization of spatial data with possibility of exploring the virtual environment. Close to computer games industry, 3D city models were interesting new world to shape and visualize. The context has completely changed, because new challenges coming from urban development forced new perspectives for virtual city models to be applied in analytic, management and environmental purposes. Introduced by Open Geospatial Consortium (OGC) cityGML owes its presence to XML language. There is many, but one crucial issue is standing for cityGML as perspective data interface for virtual city models – semantics. The cityGML concept introduces logical divisions for objects in form of normative class definitions for objects within the 3D model (Kolbe, 2009). CityGML is established on 4 main components: semantics, topology, geometry and appearance. The semantic structure of abstract data representing real objects open possibilities of multi-use of virtual city models to different stakeholders and it bases on ISO standards. In sense of geometry in delivers GML3 classes for 0-3D geometric primitives and aggregates. The geometry remains in cityGML in hierarchic structure between primitives and upper level aggregates. Topology in cityGML is crucial to keep all geometric content correctly. The sense of topology is to provide proper relations between geometric components and to establish rules for connection of geometries. Topology is a feature contributing to many analytic applications of virtual city models, because analyses can use different types or levels of geometry (some will base on nodes, some on lines, solids etc.). The compatibility of cityGML data with other computer tools allows many types visualization of data, however the standard has capacity to store georeferenced textures of objects. The appearance of model depends on application needs – analytic applications in scale of entire cities use mainly geometric models (LOD2 is the most appropriate). The entire structure of
cityGML virtual city models is very coherent in many aspects and indicates high sustainability of the standard. The other very important aspect of cityGML is its LOD concept of multi-scale representation data stored in virtual city model. The LOD stands for Level of Detail marked 0-4, which in fact is different levels of accuracy in 3D model (from single box-type of representation of buildings, through precise representation with roofs and architectural details, to interior structures stored in LOD4). What is the best of connection of cityGML with GIS is database serving virtual city model. The flexibility and compatibility of data stored in direct database to the model opens analytic applications based on precise georeferenced data. The examples of computer platforms operating on cityGML data can be popular Sketchup environment and more professional applications as Revit, AutoCAD, QGIS. The analysis of parameters related to shadow and occlusion by tall buildings undertaken in this article uses as examples different types of datasets for shadow analysis (some data in LOD1 and some in LOD2). LOD1 is enough for representation of shadow in general on floor plan of public spaces, LOD2 was used for more precise calculations of shadowing and occlusion. LOD3 was not used, but it can be used for very accurate analysis of façades (including all architectural details), as well as specific detailed places within public spaces. For sample analytic application in this article cityGML models of Rotterdam, Delft, Frankfurt and Berlin were used (mainly areas of city centres where tall buildings are located).
3. TALL BUILDINGS SHADOW IN PUBLIC SPACE
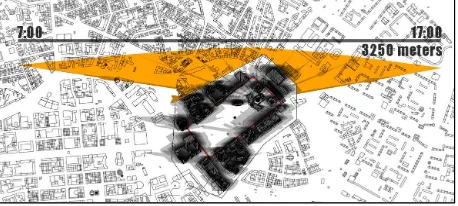
Contemporary cities have become very complex and expanded urban structures. None of the urban factors influencing urban development can be investigated separately. This has partly forced demand for common and continuously updated platform of spatial data about cities for much more purposes than virtual exploration and visualization. The concept of advanced virtual environment for cities and monitoring of urban space become very actual challenges. Unquestionably computer tool have capacity to complete new tasks. The presented cityGML virtual city models interface is a perspective solution for observation and analysis of different processes occurring in urban areas. The structure of such models is suitable for multi-aspect analytic applications. The 2TaLL project, being in implementation stage at WPUT (West Pomeranian University of Technology Szczecin) with participation of author of this paper, is focused on analyses of impact of tall buildings on city in local scale and on entire cityscape. The problem of shadowing and occluding public spaces by tall buildings is a specific aspect of the impact put under observation in this paper. The shadow from tall buildings stretches out on big areas of cities affecting localization and attractiveness of services and functions in public spaces remaining in shadow. Figure 5 shows over 3km of daytime range of shadow coming from TV tower on Berlin.
Analysis of shadow in public spaces can be performed in two technical approaches within 3D models – in top view to assess range, pattern and intensity of floor shadow, in 3D perspective view for assessing shadow data on different elements of public spaces –surrounding walls, recreation places with equipment, urban details etc. The availability of cityGML open data for virtual city models allowed using for observation and comparative study 3D models of such city centres as Rotterdam, Berlin, Delft and Frankfurt. The majority of cityGML models were used in LOD2, as well some single examples in LOD1. Firstly, the preliminary observation of appearance, type and intensity of shadow due to geometric location disposal of tall buildings was performed. The general observation of range, intensity and pattern of shadow (with focus on areas where tall buildings are located) is presented in three different cases of Delft, Netherlands (Figure 6), city centre of Frankfurt (Figure 7) and area called Stadsdreihoek in Rotterdam (Figure 8). Calculation was performed using cityGML models converted into Sketchup environment and put under calculation using free LSS Chronolux tool. Calculations for shadow were simulated for day-long period using 1/4h, 1/2h or 1 hour steps.
Figure 6. Single tall building case in uniform urban structure – Tower of Nieuwe Kerk in Delft (cityGML – LOD1), by: author The case of Delft presents specific situation of single dominant tower of Nieuwe Kerk located in legible rectangular urban interior surrounded by uniform buildings type of city centre. This particular cityGML model was in LOD1 so the church tower has simplified geometric representation. However, the analysis shows in lighter tones the most comfortable areas at the church. It also indicates, this particular spatial dimensions of urban interior and buildings in Delft is minimal to delimit area of full sunlight time available daytime (white and close to white tones). For comparison the only bigger interior in this part of the city (related to street junction) shows clearer area free of shadow. The uniform intensity of shadow and regularity in shadow patterns, visible particularly along two main parallel streets, respond directly to uniform scale and typology of buildings in this part of city. Delft is a city of very uniform and balanced height of buildings in the centre area, so the shadow pattern extended over the edge of selected 3D model shows clearly difference between shadow impact of typical buildings and the dominant tower. Apart from difficulty in precise measurement and analysis of perception of space, the raster image of shadow hidden between buildings shows general level of comfort within public spaces in sense of available natural light in specific public spaces.
The second case of Frankfurt carries interesting information on two aspects: range of shadow in context of city space and
shadowing public space beneath concentrated skyscrapers area. Frankfurt city centre model was compound of LOD2 tall buildings. Figure 7 (upper part) presents pattern of shadow coming from numerous skyscrapers surrounding green space with Beethoven monument. In this type of concentration, height and layout of tall buildings, practically there is no place without shadow except few pieces of land within the area.
Figure 7. Frankfurt – shadow in main green public space by concentrated tall buildings (cityGML – LOD2), by: author The second aspect is range of shadow in city scale. We have a case of concentration of tall buildings around main green public space. Calculated pattern of shadow from tall buildings was cleared and confronted with accurate map of the city centre. This picture shows, that clear shadow in the most unfavourable sun position could reach range of up to 10 urban blocks affected by shadow from tall buildings. The regular concentration and arrangement of tall buildings assures differentiated situation of sunlight coming the green public space – also very changing in daytime. In this case, amount of sunlight delivered to public space in Frankfurt is very important because function of public park with recreational equipment.
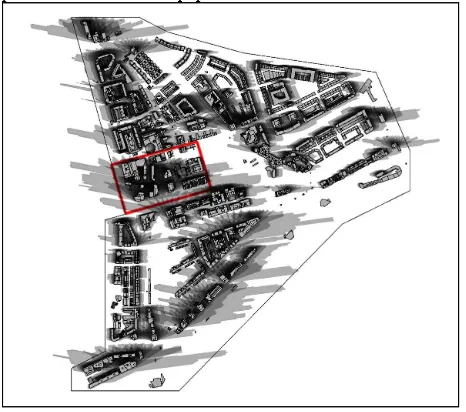
Figure 8. Shadow pattern in Rotterdam Stadsdreihoek – case of irregular height structure. Concentration of tall buildings
for error in sense of areas of maximum (day-time) exposition to sun (market white on Figure 8) because the presented LOD2 model does not include footprints of internal canals cutting in Dutch way part of the area. However, Rotterdam clearly shows the most uncomfortable public space in sense of shadowing exactly in the place where most of Rotterdam’s tall buildings are located. This case will be brought back to be examined by sun hours and SVF later on in the article.
4. ANALYSIS AND SIMULATION USING VIRTUAL CITY MODELS
Parametric measuring of quality of public space itself is a difficult challenge, because strongly depends on individual perception. However, thermal comfort, climate and accessibility to sunlight are in fact representing friendliness of open spaces directly related to notion of quality of space. Obviously, this aspect can be interpreted completely different in different world's locations because of climate issues. One of possibilities for analysis of this factor within cityGML models is automated calculation of number of hours when sun light is available for certain place in city. This analysis is called later on sunhours calculation (SH) and can be performed on any selected face of cityGML model representing urban floor, walls or other components of urban space.
4.1 Quality of public space by sunhours calculation (SH)
The general approach to observation of sunhours in public spaces beneath tall buildings in centres of European example cities was: analysing existing quality of space by calculating SH time – AIT (Average Insolation Time) as well as checking impact of spatial changes by simulation of new buildings with recalculating AIT. The process was also supported by LSS Chronolux application on cityGML model. The tool allows both, graphic representation of analyses (in this article), and parametric interpretation by numeric matrix of SH data. Figure 9 depicts graphic representation of SH calculation for area within city centre of Rotterdam (cityGML, LOD2). One important remark is, that calculation can be performed for any time during calendar year and using different precision of SH grid used for gradient representation of sunhours time. The analyses performed in this article base on yellow to red tones – yellow for areas of the longest time of insolation, red for areas of shortest time of exposition to sunlight (Figure 9).
Figure 9. Representation of Average Insolation Time (AIT) for area in Rotterdam city centre by sunhours calculation (cityGML
– LOD2), by: author
Sunhours factor calculated for groundSurfaces in cityGML defines the most attractive places within public space for location of specific functions taking advantage of sunlight in urban space. The same calculation for wallSurfaces can be used for definition of the most favourable parts of facades in buildings around public spaces (e.g. for location of such functions as restaurant terraces etc.).
Comparable analysis of sun hours was performed for two different areas in Berlin and Rotterdam. The areas are different because of urban density and scale of urban interiors. The one day long calculation of AIT shows similar result for about five hours but the distribution of values significantly differ.
Figure 10.Comparison of different shadow patterns in public spaces at similar AIT rate – Berlin, Alexanderplatz and Rotterdam, Stadsdreihoek (cityGML – LOD2), by: author The case shows, that even if the calculated AIT result is the same or similar the AIT values can be spatially distributed in many different ways (Figure 10).
4.2 Simulation
The performed simulations were intended to indicate impact on shadow and occlusion of public spaces by changing urban structure of buildings – simulating new tall buildings in the area. Differences between AIT results were taken into consideration in changing urban context of analysed public spaces. The interesting case was selected from city centre area of Berlin (represented in cityGML, LOD2) – the Pariser Platz, because of its very recognizable shape and legible urban composition of regular interior with the Brandenburg Gate enclosing symmetrical composition axis. Presently, there is no tall buildings in direct surrounding of Pariser Platz.
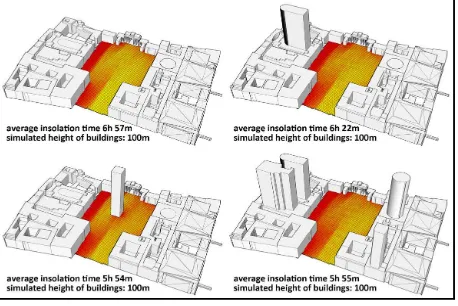
Figure 11. Public space insolation patterns in existing and simulated urban structure around Pariser Platz in Berlin
(cityGML – LOD2), by: author
In case of central square of Delft (cityGML, LOD1), additional calculation was performed for wallSurfaces – building facades (top of Figure 12). The simulation was performed for location of one new tall building opposite to existing church tower, with the same height. The initial AIT calculation was at 3h 55m – so shorter than in earlier cases. Simulation of new tall buildings has changed SH result by around 15% - 30 minutes. It is not presented on figure below, but the simulation has also significantly affected AIT for surrounding facades in place of simulation.
Figure 12. Insolation pattern for existing and simulated public space in centre of Delft with additional tall building (cityGML
– LOD1), by: author
4.3 Quality of public space by Sky View Factor (SVF)
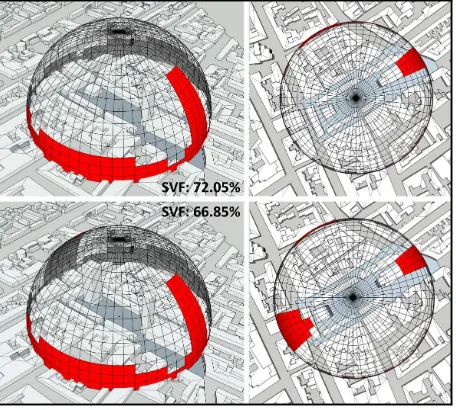
The second part of analytic observation of public spaces in shadow of tall buildings in European cities was directed towards parametric measurement of degree of occlusion coming from tall buildings into public spaces. For this purpose analysis called Sky View Factor (SVF) was applied. The main concept of analysis is about using public space user position (defined as a X,Y,Z point in any place of space between buildings) within cityGML model and generating geometric hemisphere for mapping barriers in view towards sky measured by raytracing method. The hemisphere can be defined with any radius according to urban structure and height of tall buildings surrounding. Additionally the density of grid on hemisphere can be also defined for increasing accuracy of mapping of SVF. The analyses were performed also using LSS software. The result of calculations is mapped as percentage solid fill area on hemisphere against total hemisphere area. In fact it defines what percentage of free view towards open sky is blocked by urban structures – in this case tall buildings. In case of SVF, the approach was similar to SH – analysing existing situation and simulating changes in urban structure by new tall buildings. The case put under observation and analysis by SVF was city of Delft – the same main square at Nieuwe Kerk as in case of SH analysis. The analysis was performed for sky view hemisphere of 180m radius and 60 slices / 360o. The user point was located in geometric centre of the square. The case of Delft shows low
impact of tall buildings on the selected area. The existing SVF for the user located in the middle of the square is at 72,05% - which means, that existing church tower and surrounding buildings (here geometrically represented only in LOD1) occlude views from the main public space of Delft in around 28%. The results are presented in airborne perspective and planar top view (Figure 13). Red fields on hemisphere show occluded areas. Simulation of new tall building located in opposite to church tower lowered SVF to 66,85%.
Figure 13. Sky View Factor (SVF) for existing and simulated tall buildings structure in city centre of Delft (cityGML –
LOD1), by: author
The case of Frankfurt city centre with concentration of tall buildings was used to point out difference between planned and protected green open space and space arisen between new tall buildings in sense of Sky View Factor. The performed analysis indicates how important is space management in intensively built-up city areas. The park surrounded by group of tall buildings has such combination of its dimensions and intensity of tall buildings (location, number, heights), that the result for SVF on 300m radius hemisphere is at 63% for the user located in the middle of green public space (Figure 14).
Figure 14. Impact of tall buildings on perception of public spaces by Sky View Factor (SVF) for two different locations in
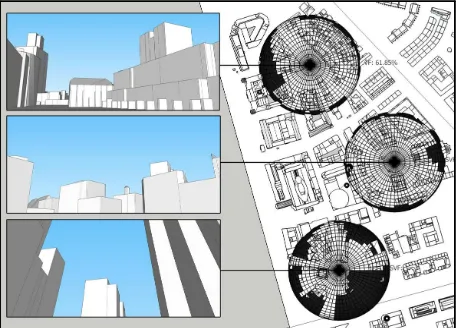
person perspective view towards sky for user beneath these buildings is occluded. The last, but not least case put under analysis was Stadsdreihoek area in Rotterdam (cityGML, LOD2). In this case, results from SH analysis were used for selection of sample 3 locations of different AIT to observe relation between occlusion by tall buildings and sun hours calculated for these locations (Figure 15).
Figure 15. Comparison of SVF for three public spaces in tall buildings area of Rotterdam (cityGML – LOD2), by: author The calculations of SVF indicate, that generally results for user points located between buildings are double less than in other open areas between regular buildings. In case of 3 selected areas results in Rotterdam were 37% (location between tall buildings), 65% and 62% for other squares with regular surrounding buildings. For better understanding this difference and importance of SVF for measuring impact of tall buildings, visualizations from selected viewpoints showing perception of space in place of analysis were generated (Figure 16). The picture at the bottom shows impact on perception at SVF 37% in comparison to locations without tall buildings (upper and middle view – fig. 16).
Figure 16. Relation between SVF and perception from user POV (point of view) – 3 locations within public spaces in centre
of Rotterdam (cityGML – LOD2), by: author
SUMMARY
The undertaken problem of impact of tall buildings on surrounding public spaces in cities is very actual because of present rapid development of such buildings. Observation of shadowing and occluding open areas by skyscrapers can be measured and visualized by computer tools. Virtual city models based on the cityGML interface are perspective and capable platform for analytic applications. The LiDAR technology standing behind data acquisition for cityGML responds to challenge of completeness and updating spatial data. The presented specific and selected analyses (SH, SVF) were performed on the basis of existing computer tools, however cityGML allows development of new individual techniques. The sample analysis presented in the article indicates potential of using virtual models to measure impact of new tall buildings
on existing city structures. Calculations of sunhours (SH) allow detailed monitoring of specific places within public spaces for qualitative evaluation of changing predispositions for open space public functions which demand comfort and friendliness. Such functions as playgrounds, recreational spaces, outdoor restaurants are strongly sensitive to issue of sunlight in terms of comfort for users and the shadow from tall buildings affects large areas of public spaces. Changes in parameter of average insolation time (AIT) for specific public areas are also linked with thermal parameters, which is not under analysis in this paper. Simulating height of location of new tall buildings we can monitor and decide unambiguously which parts of city will suffer from reduced number of sunhours under such developments. The issue of sky view factor (SVF) gives in parametric way answer to general perception of space for its users. It is quite difficult to measure feelings of users in parametric way, but such elements of urban perception as safety, ease of orientation in space, effect of claustrophobia in urban interiors etc. are relevant to impact of tall buildings in cities which can be visualized and anticipated by SFV analysis. The presented cases of Rotterdam and Frankfurt show how radically changes perception of space from user’s point of view in terms of spatial comfort related to possibility of open view towards sky while changing location of user from typical average-height urban built-up area to public space between skyscrapers (fig. 16). SFV has also great potential of measuring pollution of visual field from positions of users in public spaces – one of examples would be exploring concentration of commercial in public spaces surrounding potential user inside. Last, but not least perspective for further application of SFV is research on orientation and visual connectivity between different public spaces in terms of spatial continuity of public spaces systems. The presented and other types of analytic applications should be used not only to monitor development of tall building but also any changes in urban areas. The challenge of virtual environments requires such approach.
ACKNOWLEDGEMENTS
The article is prepared within research project 2TaLL: Application of 3D Virtual City Models in Urban Analyses of Tall Buildings, realized as a part of Polish-Norway Grants.
REFERENCES
Aringer, K., Roschlaub, R., 2013. Calculation and update of a 3D building model of Bavaria using LIDAR, image matching
and cadastre information. ISPRS Annals of the
Photogrammetry, Remote Sensing and Spatial Information Sciences, Volume II-2/W1, Istanbul, Turkey.
Czyńska, K., 2015, Attractiveness of urban landscape versus tall buildings – on the example of selected European cities. Space&FORM, issue 24/2015, e-ISSN 2391-7725, ISSN 1895-3247, WPUT, Szczecin – in edition
Döllner, J., Kolbe, T., Liecke, F., Sgouros, T., Teichmann, K., 2006. The virtual 3D city model of Berlin - managing, integrating and communicating complex urban information. Proceedings of the 25th International Symposium on Urban Data Management UDMS, Aalborg, Denmark.
Kassner, R., Koppe, W., Schüttenberg, T., Bareth, G., 2008. Analysis of the solar potential of roofs by using official LIDAR data. The International Archives of the Photogrammetry, Remote Sensing and Spatial Information Sciences. Vol. XXXVII. Part B4, Beijing, China.
Kolbe, T., 2009. Representing and exchanging 3D city models with cityGML. In: 3D Geo-Information sciences by Lee, Jiyeong, Zlatanova, Siyka, Springer, ISBN 978-3-540-87395-2, chapter 2, pages 15-31.
Liang-Chien Ch., Tee-Ann T., Jiann-Yeou R., Jin-King L., Wei-Chen H., 2005. Building reconstruction from LIDAR Data and aerial imagery.
Rottensteiner, F., Briese, Ch., 2003. Automatic generation of building models from lidar data and the integration of aerial images. In: International Archives of Photogrammetry, Remote Sensing and Spatial Information Sciences, Dresden, Germany, Vol. XXXIV, Part 3/W13, pp. 174-180.
Rubinowicz, P., 2012. Various Aspects of Urban Structure Analysis while Assessing the Friendliness of a Place. In: The Urban Landscape Renewal ULAR6, Silesian University of Technology Vol. 2, pp. 345-349. ISBN 978-83-926402-7-1.
Vosselman, G., 2002. Fusion of laser scanning data, maps and aerial photographs for building reconstruction. IEEE International Geoscience and Remote Sensing, Symposium, 24- 28 June, Toronto, Canada, CD-ROM
Zisko, A., 2008. Knowledge-based model for integrated tall building design factors. University of Illinois, U.S.