USING LATTICE TOPOLOGY INFORMATION TO INVESTIGATE PERSISTENT
SCATTERERS AT FACADES IN URBAN AREAS
L. Schack and U. Soergel
Institute of Photogrammetry and GeoInformation, Leibniz Universit¨at Hannover, 30167 Hanover, Germany - (schack, soergel) @ipi.uni-hannover.de
Commission VII/2
KEY WORDS:High resolution, SAR, Urban, Pattern, Data, Fusion
ABSTRACT:
Modern spaceborne SAR sensors like TerraSAR-X offer ground resolution of up to one meter in range and azimuth direction. Buildings, roads, bridges, and other man-made structures appear in such data often as regular patterns of strong and temporally stable points (Persistent Scatterer, PS). As one step in the process of unveiling what object structure actually causes the PS (i.e., physical nature) we compare those regular structures in SAR data to their correspondences in optical imagery. We use lattices as a common data representation for visible facades. By exploiting the topology information given by the lattices we can complete gaps in the structures which is one step towards the understanding of the complex scattering characteristics of distinct facade objects.
1 INTRODUCTION
The most prominent motivation for the fusion of SAR and opti-cal data is the combination of the advantages of both sensor types. A combined data analysis promises the weather independence of SAR with the high-resolution and straightforward interpretability of airborne optical imagery. Also the broad field of change detec-tion or natural disaster management offer many applicadetec-tions for a methodology of fusing SAR and optical data. Due to the oblique sensing geometry, especially facades are visible in SAR acquisi-tions as well as in oblique aerial imagery considering urban ar-eas. Since modern spaceborne SAR sensors like TerraSAR-X or CosmoSkyMed offer ground resolutions of up to one meter in range and azimuth direction, facade objects like single windows or balconies can be distinguished as separate Persistent Scatter-ers. Those points are temporally stable and do have a dominant contribution to the signal of it’s resolution cell (Ferretti et al., 2001). Many of those PS exist especially in urban areas where man-made structures like window corners lead to a strong and temporary stable radar return. Deformation analysis in urban ar-eas based on a network of PS allows accuracies of few mm per year (Ferretti et al., 2001). We use Persistent Scatterers as the object representation of structures at a facade in the SAR data. The regularity of PS caused by structures like facades is reflected in an equidistant spacing of its forming elements (e.g. window corners) in SAR geometry (i.e. range, azimuth coordinate).
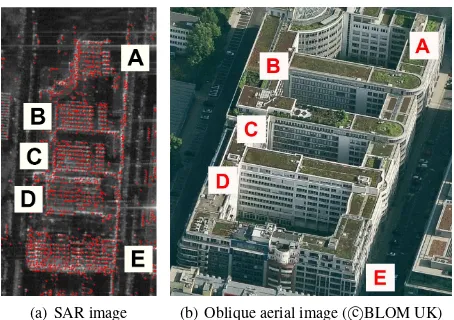
Figure 1 shows an example of a building complex with five clearly distinguishable facades. The SAR image of Figure 1(a) is over-layed with the PS as red dots. It strikes the eye that their twodi-mensional alignment in the SAR geometry is not random. Rows along facade structures of the same height as well as regularites along consecutive levels are recognizable. Comparing these reg-ularities with the oblique aerial image of Figure 1(b) makes ob-vious that the same kind of regularity can also be found in the alignment of windows at the facades on the one hand. But on the other hand, some PS seem to miss at positions which appar-ently do have the same correspondence in the optical image as positions which do have a Persistent Scatterer.
The fusion of SAR data to optical imagery needs a high level of abstraction due to the different imaging geometries. A common representation for facades are lattices which can be extracted in
(a) SAR image (b) Oblique aerial image ( cBLOM UK)
Figure 1: A building complex in the city center of Berlin in a SAR and oblique optical image. The regular facade patterns can be seen in both data types.
optical as well as in SAR data (Schack et al., 2012a). A lattice is given by the following form:
Pnm=n~t1+m~t2+t~3 with n, m∈Z (1)
wheret~1 andt~2 are the two lattice spanning vectors. t~3 is the origin of the lattice. The full integers n and m are bounded by the size of the lattice. Every position Pnm is one node of the lattice. Finding missing PS of the lattice than means to check all valid combinations of n and m. The validity in this case is simply given by the extension of the lattice. To determine the subset of PS belonging to regular facade structures means to conclude for all points if they are part of a lattice or not.
2 OBTAINING LATTICE TOPOLOGY INFORMATION BY GROUPING OF PERSISTENT SCATTERERS
percep-X
Figure 2: Sketch of the two different imaging geometries. Two important characteristics of the SAR mapping are exploited: a) Vertical aligned point scatterers are depicted into the same az-imuth coordinate and b) rectangular patterns are depicted into a sheared rectangular.
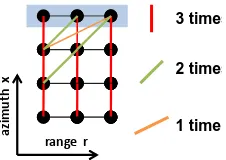
Figure 3: Schematic view of the counting algorithm to retrieve the lattice spanning vector corresponding to the horizontal alignment of PS in a regular alignment. The blue shaded row does belong to PS with the same planimetric position. Counting all directions of rows going through points belonging to this row, yields the numbers on the right hand side.
tion of recognizing regular structures in an disorderly surround-ing (Gestalt Theory). This theory defines rules which are used in a production system to aggregate points to rows which are then grouped to lattices (Schack et al., 2012b). We also exploit knowl-edge about the SAR imaging geometry. Figure 2 shows the op-tical and SAR imaging geometry schemaop-tically. Due to the fact that the SAR mapping can be seen as a cylindrical projection of the real world, vertical aligned objects are depicted into the same azimuth coordinate. Therefore PS belonging to windows of con-secutive levels which have the same planimetric position but dif-ferent height do have the same azimuth coordinate in the SAR geometry. The second characteristic which helps grouping the PS is that the cylindrical mapping is homeomorphic and there-fore preserves the topology. The rectangular alignment of the PS at a facade is mapped into a sheared rectangular. The angle of shearαof the mapping is proportional to the angle between the facade’s normal and the sensor’s line of sight projected to the ground (angleβin Figure 2).
To obtain the lattice spanning vector corresponding to the hori-zontal alignment of PS at the facade we need a simple assump-tion: Given a facade with a regular alignment of it’s windows, we assume that every column does have the same number of win-dows. This assumption holds for the majority of facades which are big enough to extract lattices in the SAR geometry. We then use a straightforward algorithm which counts the number of rows with the same direction in SAR geometry of all PS belonging to a row with the same azimuth coordinate (see Figure 3).
In this paper we use a combined approach where the minimum description length (MDL) principle (e.g. (Barron et al., 1998)) is used to support the production system by evaluating the grouping result. The MDL principle aims at finding the most compressed
range
Figure 4: The MDL principle to evaluate the grouping of PS. (a) 12 randomly distributed PS. The proposed model simply stores all 12 two-dimensional coordinates. (b) 12 PS aligned in a lattice structure. The more sophisticated model describes the PS by the lattice’ origin (blue), two spanning vectors (red) and two replica-tion vectors (green) which define the size of the lattice.
description of all PS coordinates in SAR geometry. In short, this theory measures the coding length of a model and the data given this model to store the information. If there is any regularity in the data it can be exploited to define a combined model and data representation which has a shorter coding length and therefore a smaller description length. High regularity in the data corre-sponds to a short description length. Figure 4 illustrates this prin-ciple schematically. Imagine 12 randomly distributed points in a plane as in Figure 4(a). If there is no regularity at all, the smallest amount of data to describe this points is to directly store the co-ordinates. Assumed that storing a three-dimensional point with a defined precision would need C bit, the MDL is
MDLa= 12C bit. (2)
Given a pattern of 12 regular aligned PS, as in Figure 4(b), a more sophisticated model can be introduced to decrease the MDL. The lattice is than described by its origin (blue vector), two spanning vectors (red) and two replication numbers which define how often the spanning vectors are repeated to form the entire lattice (com-pare equation 1). Assuming that storing the replication numbers (e.g. two variables of data type integer) needs less information than storing a three-dimensional point (e.g. three variables with double precision), we see that describing the lattice needs only
MDLb<5C bit. (3)
This simplified illustration of the MDL does not take into account the amount of information needed to code deviations of the true point positions with respect to their positions formed by equation 1. It also neglects the fact that storing the vector corresponding to the vertical alignement needs less information due to the ex-ploitation of the SAR imaging geometry (compare Figure 2).
In our case we are interested in the geometrical regularity of three-dimensional points in the SAR geometry. Note, that the sketches in this paper only show two dimensions due to better readability. Figures 5 and 6 show results of the grouping algo-rithm.
(a) Oblique aerial image ( cBLOM UK)
(b) SAR image
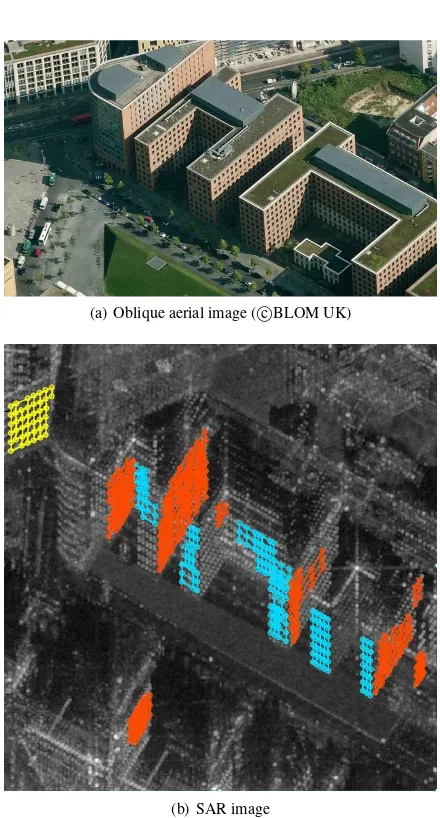
Figure 5: The Paul-L¨obe-Haus in Berlin. The roof consits of con-crete and glass. The resulting PS signature appears randomly. No lattice can be extracted. At the facades lattices can be aggregated.
(a) Oblique aerial image ( cBLOM UK)
(b) SAR image
Figure 7: Principle of inferring missing PS from the local neigh-bourhood.
1.144 1.146 1.148 1.15 1.152 1.154 1.156 x 10⁴ 1340
1350 1360 1370 1380 1390
range
azmiuth
Figure 8: Lattice in SAR geometry. The red dots are Persistent Scatterers. Blue shows the aggregated lattice structure obtained by our production system approach. The green circles mark gaps in the lattice structure where no valid PS could be found in the neighborhood of the corresponding lattice position.
the originating point. Therefore the prediction of possible PS po-sitions is system intrinsic. If a PS at a predicted position can be found it is added to a row of PS and later aggregated to a lattice. If no PS can be found, the predicted position is stored. The vot-ing takes then place over all binned positions where no PS could be found. Figure 7 shows this procedure schematically. The PS in the middle is missing and the four neighboring PS (red) vote for that position. The binning can either be performed by sim-ple thresholding the three-dimensional predicted positions or the lattice topology can directly be exploited by using equation 1 for all valid n and m. In the example of figure 7 the inference of PS A, B, C and D would lead to a voting of 4 for the missing point if the distance of their predicted positions would be smaller than the threshold. Setting the threshold depends on the resolution of the SAR stack and the typical spacing of windows at a facade.
Figure 8 shows an example of PS aggregated to a lattice by an production system as described in (Schack et al., 2012b). The green circles mark lattice positions in which neighborhood no valid PS could be found. Only PS are added to the lattice that have valid geocoded coordinate distances to its lattice neighbors. The validity depends also on the mentioned threshold. Further-more model knowledge can be introduced by forcing the plani-metric position of vertical aligned PS to be the same and horizon-tally aligned PS to have the same height. The geocoded positions are then improved in a common adjustment using the above men-tioned geometrical constrains.
3 EXTRACTING LATTICES IN OBLIQUE AERIAL IMAGES
In order to unveil the physical nature of Persistent Scatterers we extract lattices in optical images and aim at matching them to the lattices extracted in PS point sets. Facades in oblique aerial imagery are represented as dense matrices of colored or gray scaled pixel values. Single objects of the facades like window corners can be found via simple corner detectors like the very of-ten used by Harris (Harris and Stephens, 1988). To form those
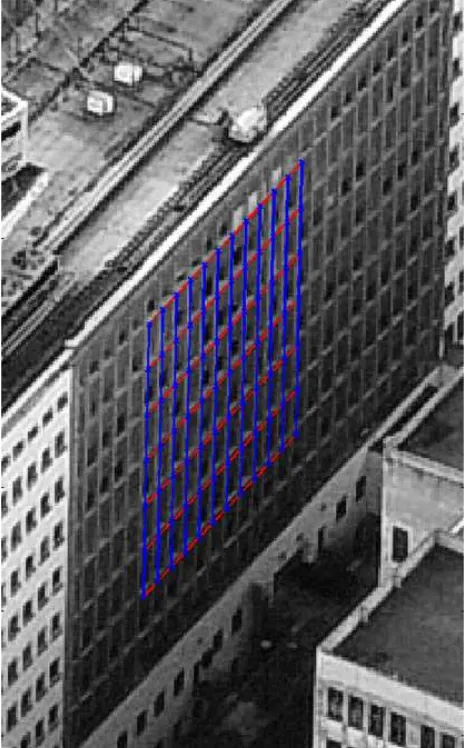
Figure 9: Result of lattice extraction in oblique optical image. The red vector correspond to the horizontal, the blue to the verti-cal alignment of the lattice nodes.
points to lattices we adopted an approach described in (Schindler et al., 2008). The key idea is that all point positions of any shear mapped lattice are integer values if an arbitrary subset of three L-forming adjacent points of this lattice is located on integer po-sitions as well. As a first step a clustering of the Harris points is needed to seperate different corners of the same object (e.g. the four corners of a window). For every cluster of the extracted Harris points, we randomly draw one point and perform an affine mapping of the two closest L-forming neighbors onto a regular (0,0); (1,0); (0,1)-grid. All points of the cluster are transformed with these parameters. If the transformed position of a point falls on an integer value (including a small tolerance) this point votes for the lattice candidate which is defined by the randomly drawn shape. The drawing is repeated several times and the three L-forming points with the majority of votings selected. Figure 9 shows an example of a lattice extracted in an optical image with this approach.
4 USING LATTICE TOPOLOGY INFORMATION
Figure 10: Lattice in oblique aerial image. Red: geocoded lattice; nodes are PS found in SAR geometry. Green: lattice positions without corresponding PS. The line of sight of the SAR sensor is roughly identical with the viewing direction of the airborne camera.
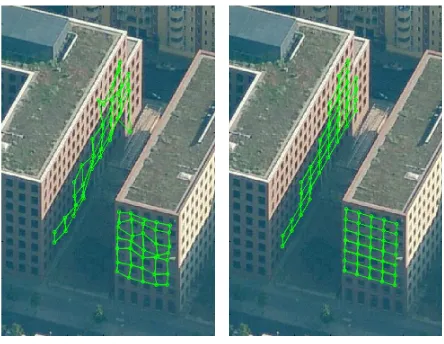
(a) Without geocoding adjustment. (b) With geocoding adjustment.
Figure 11: Improvement of two facades at site Park Kolonnaden, Berlin
does not change its appearance between the SAR acquisitions. Another reason for missing PS in a lattice is occlusion. Parts of buildings or other objects can be situated between the sensor and the object.
Figure 10 shows the geocoded and adjusted lattice of Figure 8 projected into an oblique aerial image. The green circles mark lattice positions where no valid PS in the SAR geometry could be found. In the optical image no evidence can be seen what prevents the corresponding window corner to cause a PS.
5 CONCLUSION AND OUTLOOK
We showed how lattice topology information can be deduced by aggregating single PS to lattices. The grouping algorithm uses a Production System and evaluates the results with the Minimum Description Length Principle. The lattice topology information helps to improve the geocoding of PS-lattices which is an impor-tant step in the process of matching them to lattices extracted in oblique optical imagery. The lattice topology information also helps directly the interpretation of SAR images.
At the moment we only use the MDL principle to evaluate the
grouping result. The lattice forming production system which produces the lattice candidates still uses a parameter to decide whether two predicted positions are the same or not. In future work we aim at replacing this threshold with a complete MDL framework to group the lattices in the SAR data. A big distance of the two predicted positions would correspond to a longer coding length. The MDL approach would therefore penalize big thresh-olds. Also the occurrence of gaps in a lattice structure could be coded in the MDL approach. Filling the gap could then decrease the MDL value.
Another important step towards the lattice matching is to define the matching framework itself. Due to the different imaging pro-cesses, the lattices have different geometric accuracies and also the number of columns and rows can be different. This leads to many challenges but also great potentials.
ACKNOWLEDGEMENTS
We greatfully thank Ralf Schroth from BLOM Romania SRL and Jason Crossley from BLOM UK for providing the oblique aerial imagery. We also thank Dr. Stefan Gernhardt and the Lehrstuhl f¨ur Methodik der Fernerkundung, TU M¨unchen, for the PS point set.
REFERENCES
Barron, A., Rissanen, J. and Yu, B., 1998. The minimum de-scription length principle in coding and modeling. Information Theory, IEEE Transactions on 44(6), pp. 2743 –2760.
Ferretti, A., Prati, C. and Rocca, F., 2001. Permanent scatterers in sar interferometry. IEEE Trans. on Geoscience and Remote Sensing 39(1), pp. 8–20.
Harris, C. and Stephens, M., 1988. A Combined Corner and Edge Detection. In: Proceedings of The Fourth Alvey Vision Confer-ence, pp. 147–151.
Schack, L., Schunert, A. and Soergel, U., 2012a. Lattice de-tection in persistent scatterer point clouds and oblique aerial imagery. In: Geoscience and Remote Sensing Symposium (IGARSS), Proceedings of 2012 IEEE Interantional, pp. 451 – 454.
Schack, L., Schunert, A. and Soergel, U., 2012b. A two-dimensional production system for grouping persistent scatterers in urban high-resolution sar scenes. In: Pattern Recognition in Remote Sensing (PRRS), 2012 IAPR Workshop on, pp. 1 –4.
Schindler, G., Krishnamurthy, P., Lublinerman, R., Liu, Y. and Dellaert, F., 2008. Detecting and matching repeated patterns for automatic geo-tagging in urban environments. In: IEEE Conf. on Computer Vision and Pattern Recognition, 2008., pp. 1 –7.