www.elsevier.comrlocateratmos
Raindrop size distributions in convective clouds
over Cuba
Daniel Martinez
a,), Enrico G. Gori
ba
Instituto De Meteorologia, Ministerio De Ciencia, Tecnologia Y Medio Ambiente, Ap. 17032, CP 11700, HaÕana 17, Cuba
b
Istituto Di Fisica Dell’atmosfera, Consiglio Nazionale Delle Ricerche, Italy
Received 6 May 1998; accepted 3 March 1999
Abstract
Raindrop size distributions, measured in the warm sector of convective clouds over Camaguey,¨
Cuba, are analyzed; a wide range of rainfall rates is present in the dataset. Mean spectra are presented and examined separately for updrafts and downdrafts, with additional information about vertical velocities and cloud water content. Large drop sorting has been detected; its sense and degree depend on rainfall rate and cloud dynamic characteristics. No significant small drop sorting has been found. Mean spectra for individual clouds and for groups of clouds with the same rainfall rate category have been calculated and fitted by different models; the best fits have been obtained with a least square gamma function model. An alternate analytical procedure has been presented, resulting appropriate to estimate rain water content and accurate in the sense of mean error. Negative form factors, associated with upward concavity are obtained in most cases, because of the presence of relatively high concentrations of small and large drops. q1999 Published by
Elsevier Science B.V. All rights reserved.
Keywords: Raindrop size distributions; Convective clouds; Cloud physics; Cloud water content; Rain water
content
1. Introduction
Ž .
The raindrop size distribution RSD is one of the most important parameters in cloud microstructure, because it is related to most physical processes in the cloud and to most integral parameters used for the cloud–environment interaction and for remote sensing
Ž . Ž .
techniques. These are the rain water content RWC , the radar reflectivity factor Z , the
Ž . Ž . Ž .
rainfall rate R , the microwave attenuation A , the optical extinction coefficient S
)Corresponding author. E-mail: [email protected]
0169-8095r99r$ - see front matterq1999 Published by Elsevier Science B.V. All rights reserved.
Ž .
and others. The knowledge of RSD is of particular importance for modeling clouds and larger scale systems, for the interpretation of radar and radiometric measurements, as well as for applications in telecommunications, airborne transport and construction industry. Many RSD measurements have been made at ground level. However, most of the above-mentioned applications require the knowledge of the RSD above the ground and inside the clouds. Consequently, in-cloud and sub-cloud measurements have been
Ž
made using airborne spectrometers Klazura, 1971; Mazin and Shmeter, 1977; Carbone
.
and Nelson, 1978; Willis, 1984 .
One of the main objectives of the study of RSD both at ground and aloft has been the search of analytical expressions reproducing the expected spectral densities from known integral rainfall parameters, especially rainfall rates. The most widely used RSD model in the last decades has been the exponential distribution, proposed by Marshall and
Ž .
Palmer 1948 . Its general form is:
N D
Ž .
sN exp0Ž
ylD.
Ž .
1Ž .
where D is the drop diameter or equivalent diameter, in non-spherical large drops ;
Ž .
N D is the drop concentration per diameter interval, or drop spectral density; N and0 l
are constants for a particular RSD. For this analytical form, the RSD log–linear plot should be a straight line with intercept N and negative slope0 l. According to Marshall and Palmer’s results, the intercept is a constant for any type of rain or rainfall rate, and the slope is a function of rainfall rate.
In general, N has been found to depend on R, and the functional dependence of0 l
with R may vary. These variations can be considerable, even within the same rainfall event, if variations in air mass stability occur. For convective rain, the form of the RSD generally shows deviations from the exponential, though it has been successfully used
Ž .
sometimes Pruppacher and Klett, 1997, pp. 35–36 .
Ž .
The Joss–Gori S parameters were shown to depend only on the form of the RSD. It
Ž .
can be seen that S PQ s1 corresponds to an exponential distribution, S-1 to a
Ž
concave downward and S)1 to a concave upward distribution, respectively in
. Ž .
log–linear coordinates . Joss and Gori 1978 found both types of cases, though the
Ž .
S PQ -0 case was the most commonly found.
Ž .
Ulbrich 1983 proposed the use of the gamma distribution to fit RSD, considering that the exponential can be obtained as its particular case, and that a series of mathematical advantages can be obtained. The proposed function is of the form:
N D
Ž .
sN Dg mexpŽ
LD ; 0.
FDFDmax,Ž .
4where m is a real number and the units of N are: mg y3 mmy1ym. Here, m can be interpreted as the slope that would have the spectrum for the small drop region if plotted in a log–log diagram. If it is positive, it implies the existence of an internal mode for a
Ž .
diameter greater than the minimum Dmin and, consequently, a concave downward form, even in log–linear coordinates. For a negative m, no internal mode occurs in the model curve, which is concave upward. The parameter L is interpreted as the slope of the plot in log–linear coordinates, for the large drop part of the spectrum. N , in general,g has no useful physical meaning and shows a wide range of variation, in dependence to
m. Using a theoretical expression for the relation between any pair of integral parameters
Ž .
of the gamma distribution, and a group of empirical Z–R relations, Ulbrich 1983 estimated m for a variety of rain types. A great variability was found, with prevailing negative m for orographic rain, and positive for thunderstorm rain. For stratiform rain and showers both negative and positive values were obtained. The gamma function
Ž .
model has also been used with success by Willis 1984 and Willis and Tattelman
Ž1989. to fit RSD measured by an airborne spectrometer in tropical storms and
Ž .
hurricanes. It has also been applied to surface RSD data by Fujiu et al. 1996 in China
Ž .
and by Richter and Goddard 1996 in Southern England.
Ž .
Mazin and Shmeter 1977 used a power function model to fit RSD, measured in
Ž .
warm cumulus clouds with Nevzorov’s large particle airborne spectrometer LPS . Their spectra, with maximum diameters close to 3 mm, for the deepest clouds, looked linear in a log–log plot, but they would have looked concave upward, if plotted in a log–linear system the proposed distribution has the form:
N D
Ž .
saDyb.Ž .
52. Instrumentation and data
The dataset used in the present work was collected during the 1986 and 1987 seasons
Ž .
of the Cuban Weather Modification Program PCMAT , run jointly by the Cuban
Ž .
Institute of Meteorology INSMET and the Russian Central Aerological Observatory
ŽCAO . Field experiments, including cloud physics observations, were accomplished in. Ž .
the Camaguey Experimental Area CEA , which is located in the central–eastern part of
¨
Cuba, and is limited by a circumference of 80 km of radius, centered at the
Meteorologi-Ž X X
.
cal Center of Camaguey City 21
¨
825 N and 77810 W . The observed RSD correspond to the interior of summer convective clouds, measured well below the freezing level byŽ .
Nevzorov’s large particle spectrometer LPS , installed in the instrumented Aero-caribbean, INSMET IL-14. The LPS is an optical probe, developed in the Russian
Ž .
Central Aerological Observatory Mazin and Shmeter, 1977; Nevzorov, 1996 . It is intended for measuring particles in a range of diameters from 0.2 to more than 6 mm. It has 12 channels, whose resolution decreases with diameter, as shown in Table 1. Its working principle may be summarized as follows. A collimated light beam passes
Ž .
through two narrow slits 0.12 mm wide and is focused on a photodetector. The cloudy air crosses the beam axis, forming a sample volume of 25=28=0.12 mm. Everytime that a particle intersects the measuring volume, the light flow on the photodetector decreases proportionally to the area covered by the particle, which is also nearly proportional to the particle size for the range of measurement, as the minimum diameter is nearly twice the slit width. This causes a response pulse that is subsequently amplified and sent to a 12 channel integral pulse amplitude analyzer.
Considering that the position of the sensor favors the measurement of the horizontal dimensions of the drops, which could have induced to overestimation of their sizes, a
Ž .
correction for deviation of sphericity Pruppacher and Klett, 1997, p. 399 is introduced in this work to calculate the equivalent drop diameter. The third row of Table 1 shows the results.
Ž .
The IL-14 was also equipped with an aircraft load complex ALC , including an analog integrator and the corrections to produce wind vertical velocity with an error of
Ž .
15% for vertical velocities w less than 10 mrs. For greater w, the error is estimated as 20%. Liquid water content from cloud droplets was measured with Nevzorov’s hot wire probe, with sensitivity from 0.003 to 0.01 g my3, depending on flight conditions. Work
principles and general characteristics of this equipment can be found in the works of
Table 1
Threshold values of diameter measurement for the 12 LPS channels
Channel 1 2 3 4 5 6 7 8 9 10 11 12
Ž .
dmi n mm 0.2 0.3 0.4 0.6 1.0 1.4 2.0 2.8 3.6 4.4 5.2 6.0
Ž .
Dmi n mm 0.2 0.3 0.4 0.6 1.0 1.4 1.9 2.7 3.4 4.1 4.7 5.3
dmi nrepresents minimum measured drop dimensions for each channel.
Dmi nrepresents minimum equivalent diameter for each channel.
Ž . Ž .
Mazin and Shmeter 1977 and Nevzorov 1996 . Intercomparisons between Nevzorov’s hot wire probe and the well-known PMS King probe have shown close agreement
ŽKorolev et al., 1996 ..
The dataset consists of 72 samples. Of them, 65 had altitudes near to 3 km and temperatures from 7 to 108C. It also includes six cloud base passes at altitudes close to 1.5 km and temperatures of 19–238C. According to the flight methodology, clouds should be penetrated in their central part so that the length of the in-cloud flight track corresponds roughly to the horizontal extension of the cloud. The cases for which this condition could not be fulfilled were excluded from the analysis. In the case that the measured cloud was part of a mesoscale system, and was merged at the base with other clouds, it was identified by its corresponding tower. Consequently, the volume of cloudy air in each individual sample depends of the horizontal dimensions of the cloud, which ranged from 0.8 to 7 km. As the LPS sampling area is of 7 cm2, this corresponds to a
range of sampling volumes of 0.6–5 m3.
Cloud top heights ranged from 4 to 12.5 km, with average of 7.7 km and standard deviation of 1.9 km. Cloud base heights ranged from 1.1 to 1.5 km, with an average of 1.2 km, and standard deviation of 0.1 km. Considering their dimensions and form, the measured clouds can be classified as cumuli congesti or cumulonimbi. Previous studies have shown that Camaguey convective clouds may be classified as nearer to continental
¨
that to maritime, considering their cloud base droplet spectra in early stages of
Ž
development, and their characteristic maximum vertical velocities Perez et al., 1992;
´
.Martınez, 1996 .
´
Every second of in-cloud flight, corresponding to nearly 80 m, a set of measurements was recorded. This was later used to calculate the averaged spectrum for each of the 72 cases, which will be called ‘cloud spectrum’. For a subset of 55 clouds, with
simultane-Ž .
ous measurements of vertical drafts and RSD, averaged spectra for updrafts w)1 and
Ž .
downdrafts w-y1 were calculated. These will be referred to as ‘draft spectra’. Rainfall rates, calculated from cloud spectra were used for data stratification, applying
Ž . Ž .
the criterion of Willis and Tattelman 1989 for high rainfall rate categories RRC . Two more categories were included to account for the lower rates. The definition of the applied RRC is shown in Table 2. No stratification was done according to flight height, as the cloud base spectra were only six cases, and they showed no outstanding differences with those measured higher in the clouds. An index was introduced to
Table 2
Ž . Ž .
Ranges of rainfall rate R , number of cases, and frequency distributions of top heights HT for the clouds of the dataset, stratified by RRC
Ž .
Ž . Ž .
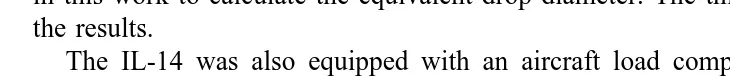
Fig. 1. General characterization of the dynamics of the clouds in each of the RRC. A Averaged mean w ,
Ž . Ž . Ž . Ž .
maximum wma x, and minimum wmin vertical velocities and absolute maximum wq and minimum wy
Ž .
vertical velocities against RRC. B Number of cases with DESs0 and DESs1 against RRC.
account for the stage of development of the clouds, to consider it in the analysis; it is called DES, for development stage index. It is simply defined as DESs1 when the averaged measured cloud air vertical velocity was positive, i.e., w)0, showing predominant upward motion, and DESs0 in the cases when wF0.
According to cloud top heights, whose frequency distributions are shown in Table 2, most of the measured clouds are mixed phase, as the freezing level ranged from 4 to 5 km, and they58C level ranged from 5 to 6 km. As can also be seen, all high rainfall
Ž y1.
rate cases R)25 mm h correspond to clouds with HTG6 km, all of them with cloud top temperatures belowy58C.
Most clouds of the dataset had well-defined updrafts and downdrafts, with
consider-Ž .
able vertical velocities This can be seen from Fig. 1, showing A the RRC average of the mean, maximum and minimum values of the 1 s values of w for each case, and the corresponding absolute maximum and minimum. Number of DESs0 and DESs1
Ž .
cases for each RRC are also shown B .
3. RSDs
3.1. RSDs in clouds
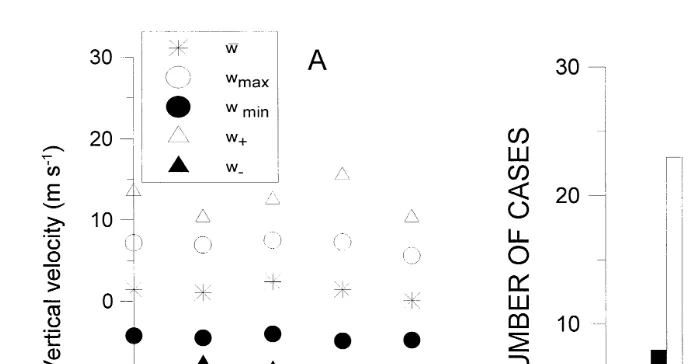
Typical cloud spectra for individual cases corresponding to each RRC are shown in Fig. 2. As can be seen from these examples, maximum diameter is larger for higher RRC spectra. The same holds for the large drop concentrations.
This can be better analyzed from Table 3. As can be seen, the range of variation of
Ž . Ž .
Fig. 2. Raindrop spectra for four typical cases, corresponding to different RRC. Filled squares represent data, and curves represent functional fits.
Ž .
rainfall rate spectra. This suggests that the presence of giant drops D)5 mm is related to the development of intense rainfall in convective clouds in Camaguey.
¨
Table 3
Ž .
Frequency distributions of maximum diameters Dma x for the clouds of the dataset, stratified by RRC
Ž .
RRC Dma x mm
0.4 0.6 1.0 1.4 1.9 2.7 3.4 4.1 4.7 5.3 5.9
1 1 4 10 8 3 8 0 0 0 0 0
2 0 0 0 0 2 3 5 1 2 0 0
3 0 0 0 0 0 0 0 0 1 3 5
4 0 0 0 0 0 0 0 1 1 1 5
5 0 0 0 0 0 0 0 1 0 1 6
Ž .
those reported by Willis 1984 for tropical storm clouds. For the high rainfall rate cases
ŽD and E , the upward concavity of the spectra is apparent, especially for small drop.
diameters.
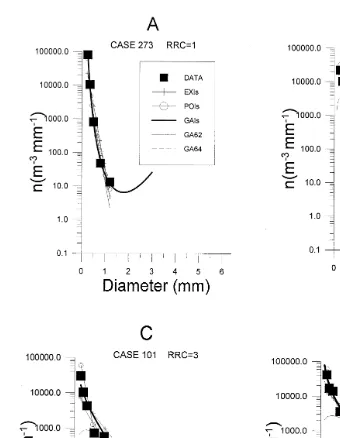
3.2. RSDs in updrafts and downdrafts
For the lowest rainfall rates, updraft and downdraft spectra were usually not very
Ž .
different Fig. 3 . The situation changes for the high rainfall rates, where drop sorting
Ž .
Fig. 3. Updraft and downdraft spectra for two typical low rainfall rate cases left and two typical high rainfall
Ž .
takes place, mainly for the larger drops. This is the cause of marked differences between updraft and downdraft spectra in their right zones, while the left parts of the two spectra are very close to each other.
In relation with this, the dependence of CWC on vertical velocity for updrafts and downdrafts, was investigated. For updrafts, a positive correlation was observed between
Ž .
vertical velocity and CWC mainly for developing clouds rs0.70 , as expected from the formation and growth of droplets by condensation. No correlation exists for downdrafts, but considerable, or even high CWC is present in most cases. The existence of significant CWC in downdrafts reveals the presence of cloud droplets, which is consistent with a low evaporation rate, and with the existence of high concentrations of small raindrops.
The sign of the difference in large drop concentration between updrafts and down-drafts depends on the cloud stage of development, as can also be seen from the typical
Ž
cases shown in Fig. 3. Updraft spectrum for case 53 corresponding to a developing
.
cloud , for example, is greater than downdraft spectrum for all drop sizes. The opposite occurs for case 277, which correspond to a mature cloud containing, at flight level, a powerful rainshaft and a weak updraft. This can be better understood from the analysis of a particular case. Fig. 4 shows the evolution of the spectrum and other characteristics for the cloud corresponding to cases 325–329. It was measured five times, on August 31, 1987, from 1713 to 1744 h. More penetrations could not be made for flight security
Ž .
reasons. The gradual development of the cloud spectrum A is due to the parallel
Ž . Ž .
evolution of RSD in updrafts B and downdrafts C . The maximum measurable diameter is first attained in the updrafts, but the large drops reach higher concentrations in the downdraft, in the last penetration. The main rainfall related integral parameters
Ž .
and cloud top height kept growing all the time D, E . The constant behavior of Dmax
Ž
after the third penetration is probably only an instrumental truncation see the note in
.
Table 1 . Mean vertical velocity remained positive in all passes. At the second penetration, a decrease of mean and maximum velocity was registered, but later they increased again. In the third pass, the ALC system got unbalanced and the register saturated, so that the vertical velocity values could not be measured, though the predominantly upward motion is certain.
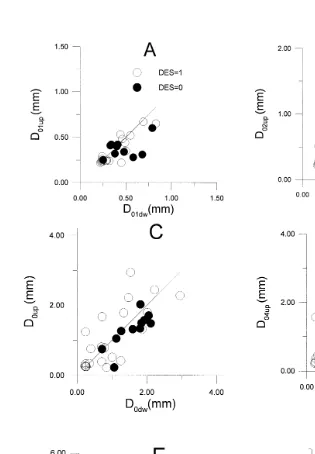
The difference between updraft and downdraft spectra appears not only in the values of maximum diameters, but also in the distribution of the different moments of the RSD between the smaller and larger drops. To analyze this effect, different weighted median diameters are used. The most extended in RSD formulations is the volume median diameter D , dividing the contribution to the RWC from left and right part of the RSD0
in two equal parts. The median reflectivity diameter D0 Z has also been used, because of the greatest weight given to larger drops. In general, a median diameter of order p can be defined as:
In Fig. 5, median diameters of order p for updraft spectra have been plotted against
Ž .
the same parameters for downdrafts, for ps1–4 and 6 A–E . Maximum diameters
Ž .
downdraft spectra is given by the larger drops and depends on the cloud development stage, is well expressed in the graphs. The distribution of points at both sides of the
ysx line is quite symmetric. Increasing the order, the separation between filled and
Ž .
hollow circles respectively corresponding to DESs0 and DESs1 increases. The value of the diameter for which this separation is noticeable also increases with order. This means that higher order moments, being the most affected by large drop concentra-tions, show the greatest dependence on vertical velocity and cloud development stage. Note that the strictly symmetric disposition of the points corresponding to the greater
Ž .
values of maximum diameter, either in updrafts or downdrafts Fig. 5F may be an artifact, due to the open maximum limit of the LPS 12th channel.
4. Functional fits to RSDs in clouds
4.1. Functional fits to indiÕidual cases
Ž .
The observation of individual cloud spectra Fig. 2 shows that, with some excep-tions, they do not look linear in log–linear coordinates, and they are generally concave
Ž .
upward. Log–log plots, not shown resulted linear in some cases. This suggests a gamma distribution, but does not allow discarding the possibility of exponential or power fits in certain cases. Thus, the three models were tried and compared.
For different purposes, such as parameterization in cloud models, or remote sensing applications, the estimation of RSD functional form from calculated or measured
Ž
integral parameters is desirable. This approach has been called ‘analytical’ Waldvogel,
.
1974; Willis, 1984 . In the present section, a variant of this method will be followed to obtain additional gamma fits for individual cloud spectra, and the results will be compared with the least squares estimations. The method consists in obtaining the form factor m of the gamma distribution, by applying the following relation, developed by
Ž .
Ulbrich 1983 , after calculating the Joss–Gori form parameter SP Q from the experimen-tal DSD.
pqq
ms
Ž .
7pqqq2m
As the choice of P and Q depends in general on the particular task, five
combina-w x w x w x w x w x w x Ž . Ž .
tions were tested: p, q s 6,2 ; 6,3 ; 6,4 ; 4,3 and 3,2 . The relations 8 and 9 ,
Ž .
used to calculate Land N have also been taken from Ulbrich 1983 :g
LD0s3.67qm.
Ž .
8G
Ž
pqmq1.
pqmq1Psap pqmq1N Dg 0
Ž .
93.67qm
Ž
.
Fig. 4. Evolution of spectra in a developing cloud measured on August 8, 1987. The five passes correspond to
Ž . Ž . Ž . Ž . Ž . Ž . Ž . Ž .
17:13 1 , 17:21 2 , 17:28 3 , 17:37 4 and 17:44 5 . A Cloud spectra; B updraft spectra; C downdraft
Ž . Ž .
Ž . Ž .
Ž .
D is available from data, but it was calculated from 10 , as a function of D , the so0 m
Ž .
called mass-weighted average diameter Ulbrich, 1983 , a quantity close to D both in0
value and physical meaning, but statistically more representative and depending only on the moments of the distribution.
Three independent criteria were applied for goodness of fit evaluation: the
logarith-Ž .
mic mean squared error LMSE , given by:
n
1 2
LMSEs
Ý
log Ni obsŽ .ylog Ni fitŽ . ,Ž .
11n 1
Ž .
the relative mean error RME , given by:
n
1 NobsyNfit
RMEs
Ý
Ž .
12n 1 Nobs
and the relative error of estimation of the RWC, given by:
ABS RWC
Ž
obsyRWCfit.
dRW Cs ,
Ž .
13RWCobs
In the above equations, ‘obs’ refers to the observed RSD, ‘fit’ refers to its functional fit, N is the drop count of each channel, and ‘n’ is the number of LPS channels withi non zero drop counts.
Ž .
The advantage of LMSE as a criterion, used previously by Willis 1984 is that it gives equal weight to all parts of the spectrum, according to the approximately exponential dependence; so, it is a good indicator for the reproduction of the form of the
Ž .
original spectrum by the fit. The RME, used previously by Fujiu et al. 1996 , removes the dependence on the diameter by dividing the absolute error by the spectral density of each channel, and renders the error estimation independent from the integral character-istics of the spectrum.
Only those RSD with DmaxG1 mm were fitted, for having at least five spectral density estimations, implying more than two degrees of freedom in regression. Thus, a total of eight fits were tried for each of the 67 RSD fulfilling this condition. The exponential, power and gamma least squares fits will be denoted, respectively as EXls, POls and GAls. The analytical gamma fits corresponding to the SP Q parameters will be
Ž .
concentration. A preliminary analysis of the errors suggested searching differences in the performance of the models depending on RRC.
4.2. Functional fits to mean spectra for each rainfall rate category
Cloud RSD for individual cases, corresponding to the same RRC, were bin-averaged for each of the measured diameter intervals. For RRCs1, five clouds had Dma x-1 mm, and hence, less than five non-zero bins. They were excluded from the averaging. The largest drop bins in the averaged spectra were considered for curve fit only if they were represented in more than a fourth of the total number of clouds in the correspond-ing RRC.
Fig. 6 shows GAls fits for mean spectra for the five RRC. The slope of the right wing of the spectrum decreases with rainfall rate.
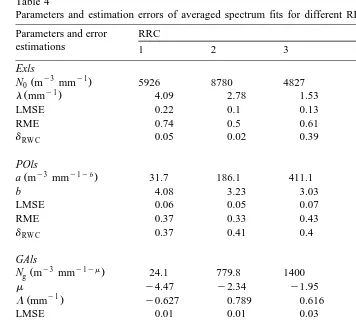
The numerical values of the parameters and the errors for the three least squares fits and the best performing analytical gamma fit are shown in Table 4. The analysis of the errors shows that the GAls fit has always the least LMSE, and RME. All five analytic fits give good predictions of RWC, but GA64 has very high LMSE, which is relatively
Ž .
high in GA63 too not shown . The power fit performs better than the exponential from the point of view of mean errors, particularly for the lower RRC, but the exponential proved very efficient in predicting LWC for mean spectra. In general, EXls performs better for mean spectra than for individual cases, as had been obtained by Joss and Gori
Ž1978 for surface rain..
The analysis of Table 4 shows that, although the different gamma fits have different parameters, this does not have so much influence in the fit error. The parameters can adjust themselves to a certain extent to provide a good fit. For example, the GAls and
Fig. 6. Bin averaged observed cloud spectra for the five RRC and the corresponding least squares gamma fit
Table 4
Parameters and estimation errors of averaged spectrum fits for different RRC for four functional fit models Parameters and error RRC
LMSE 0.22 0.1 0.13 0.12 0.12
RME 0.74 0.5 0.61 0.58 0.58
RME 0.37 0.33 0.43 0.38 0.44
dRW C 0.37 0.41 0.4 0.51 0.54
GAls
y3 y1ym
Ž .
Ng m mm 24.1 779.8 1400 2892 4505
m y4.47 y2.34 y1.95 y1.73 y1.64
y1
Ž .
L mm y0.627 0.789 0.616 0.682 0.599
LMSE 0.01 0.01 0.03 0.03 0.03
RME 0.19 0.23 0.32 0.31 0.36
dRW C 0.03 0.08 0.11 0.15 0.13
GA62
y3 y1ym
Ž .
Ng m mm 699 2490 1910 5237 7813
m y1.55 y1.01 y1.01 y0.73 y0.72
y1
Ž .
L mm 2.5 1.9 1.03 1.2 1.1
LMSE 0.14 0.06 0.07 0.06 0.06
RME 0.52 0.38 0.35 0.46 0.48
dRW C 0.26 0.21 0.13 0.11 0.13 LMSEslogarithmic mean squared error.
RMEsrelative mean error.
dRW Csrelative error of estimation of the RWC.
GA62 fits do not seem to differ drastically in the graphs, but the second one produces systematically lower absolute values of m.
5. Discussion of results
The characteristics observed in cloud and draft spectra cannot be totally explained with available data, and will be the subject for future research work. The first regularity to be explained is the lack of clear differences between concentrations of small raindrops
Ž . Ž .
small raindrops in updrafts and evaporation effects had caused a deficit of small raindrops in downdrafts. The first effect is clearly observed, while the second is not. The explanation may be related with small evaporation rate in downdrafts, which seem to be mostly precipitation-driven. The turbulent transport of water vapor, droplets and small raindrops at the boundaries between updrafts and downdrafts are also factors to be considered.
Essentially the same phenomenon of a high concentration of small raindrops has been
Ž .
observed in surface rain, for Mexico City by Garcıa and Montanez 1992 , in Shenyan,
´
˜
Ž . Ž .
China, by Fujiu et al. 1996 , and by Richter and Goddard 1996 for the case of warm air advection in Southern England. These latter underlined the decisive role of environ-mental air in drop size distribution characteristics. For in-cloud measurements in small
Ž . Ž .
and medium-sized cumuli, Klazura 1971 and Mazin and Shmeter 1977 found
Ž .
relatively high concentrations of small drops. Carbone and Nelson 1978 measured RSD in more developed convective clouds, with rainfall rates up to 40 mm hy1. Their
spectra are upwardly concave in their small drop part. They found small drop deficit, relative to the corresponding Marshall–Palmer distribution, for the value of R calculated from data, but not relative to an exponential least squares fit. Considering their form, the spectra could have been fitted to a gamma function distribution, with negative m.
Ž . Ž .
However, Willis 1984 and Willis and Tattelman 1989 obtained gamma fits with positive m, showing a deficit of small drops. Their sample included in-cloud air in tropical storms and hurricanes at different altitudes.
Another important regularity to be explained is the way in which large drop sorting takes place. In Section 3.1, the difference in Dmax between the lowest two RRC and the higher ones was emphasized. The fact that it is accompanied by a difference in cloud top height suggests the predominance of different mechanisms of rain formation for both groups of RRC.
As shown above, the first giant drops generally form in updrafts. They may be the result of an active collision–coalescence process, favored by the high humidity of the feeding air, and high vertical velocities. Recycling and continuous growth of large drops, previously present in the downdrafts and entrained to the updrafts, may also influence
Ž . Ž .
giant drop growth, as discussed in the work of Pruppacher and Klett 1997 p. 33 . However, as evidenced from Fig. 1A, vertical velocity does not vary drastically for the different RRC, but giant drops and high rainfall rates only occur for clouds, whose tops are higher than 6 km. The importance of the coalescence–riming–graupel mechanism of rain formation in deep tropical clouds with cloud base temperature above 108C is well
Ž .
known Silverman, 1986 . Consequently, formation and re-circulation of graupel, and possibly hail development may occur, favoring the formation of giant drops, after the melting of hail. This hypothesis cannot be conclusive because of the limited number of these small clouds in the dataset. Unfortunately, the LPS was unable to distinguish between large drops and hailstones. The only way to detect the presence of hail was the different sound of drops and hailstones hitting the aircraft fuselage. It was reported in some cases in the on-board diary, following this qualitative method.
On the other hand, observations of giant drops in tropical maritime warm clouds have
Ž . Ž .
the participation of the ice phase. However, previous research has shown that cloud base droplet spectra for Camaguey clouds in their earliest stages of development are much
¨
Ž .
narrower than those typical of maritime clouds Perez et al., 1992 .
´
6. Summary and conclusions
RSDs and other measured cloud physical parameters have been presented for a sample of 73 penetrations of convective clouds, most of them at an altitude close to 3 km, way below the freezing level. The measurements have been made over Camaguey,
¨
Cuba, in the summers of 1986 and 1987. A wide rainfall rate range, from almost 0 to 297 mm hy1 was studied. Five RRC were established to stratify the sample. Giant drops
are generally present in the high rainfall rate spectra, which never occurs in clouds with tops lower than 6 km, corresponding to they8ry108C isotherm. High concentrations of small drops are present in almost all cases, which causes upward concavity in the spectra. To consider the action of vertical drafts in drop sorting, separated mean RSD were calculated for the updraft and downdraft part of the clouds. The analysis showed that the high concentration of small drops is common to updrafts and downdrafts. Relatively high cloud water contents were also measured in both kinds of drafts.
Large drop sorting was detected for the high rainfall rates, in the sense of higher concentrations of large and giant drops in the updrafts of developing clouds and in the downdrafts of clouds with prevailing downward motions. This is consistent with the existence of a well-developed collision–coalescence process, possibly combined in some cases with graupel and hail formation, hailstone melting or partial melting and large drop recycling. Additional data analysis and modeling work would be needed to arrive to definitive conclusions in this sense.
Exponential, power and gamma least squares functional fits were applied to the observed spectra. Five additional analytical gamma function fits were obtained by deriving the gamma form factor from the previous calculation of the moments of the distribution and the Joss–Gori form parameters from observed data. The results for the bin averaged mean spectra were compared, using as criteria the logarithmic mean square error, the relative mean error and the error in RWC estimation. The traditionally used exponential model generally underestimates small drop concentrations, and neglects the concavity of the spectrum, and so, does not describe properly the form of the observed distributions. However, it predicts well the liquid water content for averaged spectra. Power function fits were also tried, but, although they perform properly for the low rainfall rate spectra and the small drop wing of higher rainfall rate spectra, they
Ž .
overestimate large drop concentrations. The least squares gamma fit GAls performs the best in most cases, according to two mean error criteria, and has also a relatively low error of RWC estimation. Raindrop spectra in Camaguey clouds are radically different
¨
Ž .
from those in tropical cyclone clouds, reported by Willis 1984 and Willis and
Ž .
Tattelman 1989 . This is not surprising, considering the differences in dynamics,
Ž .
pointed out by Jorgensen and LeMone 1989 , between oceanic and continental clouds, and the fact that Camaguey clouds are nearer to continental than to maritime, according
¨
Ž .
to their dynamical and microphysical characteristics, found by Perez et al. 1992 and
´
Ž .Acknowledgements
We are grateful to V. Petrov, V. Beliaev, C. Perez and M. Valdes, for their
´
´
participation in the experiments and preliminary data processing, and also to the rest of the colleagues of the Russian Central Aerological Observatory and the Cuban Institute of Meteorology and the piloting crews of Aerocaribbean, who participated in data collection. G. Angulo and C. Fernandez also participated in preliminary data processing.
´
We are especially grateful to A. Nevzorov, P. Willis, J. Joss, G. McFarquhar O. Nunnez,
´ ˜
and three anonymous reviewers for their valuable suggestions. The Governments of
Ž .
Cuba and the former USSR supported the experiments. One of us D. Martınez
´
acknowledges the International Center for Theoretical Physics Programme for Training and Research in Italian Laboratories, Trieste, for providing a grant for a research fellowship and the Instituto di Fisica dell’Atmosfera, Rome, for providing its installa-tions and general support.
References
Beard, K.V., Johnson, D.V., Baumgardner, D., 1986. Aircraft observations of large raindrops in warm, shallow, convective clouds. Geophys. Res. Lett. 13, 991–994.
Black, R.A., Willis, P.T., 1996. Giant drops observed from large aircraft. 12th International Conference on Clouds and Precipitation. Aug. 19–23, 1996. Proceedings, Vol. 1., Zurich, Switzerland, pp. 27–30.¨
Carbone, R.E., Nelson, L.D., 1978. The evolution of raindrop spectra in warm-based convetive storms as observed and numerically modeled. J. Atmos. Sci. 22, 2302–2314.
Fujiu, G., Jicheng, L., Zihua, L., Taoshi, L., 1996. Studies on the raindrop spectrum characteristics in three types of precipitus clouds. 12th International Conference on Clouds and Precipitation. Aug. 19–23, 1996. Proceedings. Vol. 1., Zurich, Switzerland, pp. 15–18.¨
Garcıa, F., Montanez, R.A., 1992. Ground-based raindrop spectra observations for the analysis of summer´ ˜
convective showers in Mexico City. 11th International Conference on Clouds and Precipitation. Aug. 17–21, 1992. Proceedings. Vol. 1., Montreal, Canada, pp. 151–153.
Jorgensen, D.P., LeMone, M.A., 1989. Vertical velocity characteristics of oceanic convection. J. Atmos. Sci. 46, 621–640.
Joss, J., Gori, E.G., 1978. Shapes of raindrop size distributions. J. Appl. Meteor. 17, 1054–1061.
Klazura, G.E., 1971. Measurements of precipitation particles in warm cumuli over Southeast Texas. J. Appl. Meteor. 10, 739–750.
Korolev, A.V., Strapp, W.J., Nevzorov, A.N., 1996. On the accuracy of Nevzorov airborne hot wire LWCrTWC probe. 12th International Conference on Clouds and Precipitation. Aug. 19–23, 1996. Proceedings, Vol. 1., Zurich, Switzerland, pp. 346–349.¨
Marshall, J.S., Palmer, W.M.K., 1948. The distribution of raindrops with size. J. Meteor. 5, 165–166. Martınez, D., 1996. Turbulence parameters and vertical drafts in tropical convective clouds over Camaguey,´ ¨
Cuba. 12th International Conference on Clouds and Precipitation. Aug. 19–23, 1996. Proceedings, Vol. 1., Zurich, Switzerland, pp. 566–569.¨
Ž .
Mazin, I.P., Shmeter, S.M. Eds. , 1977. Cumulus clouds and the deformation of the fields of meteorological
Ž .
elements related with them In Russian . Trudy TsAO, 134, 280 pp.
Nevzorov, A.N., 1996. CAO aircraft instrumentation for cloud physics. 12th International Conference on Clouds and Precipitation. Aug. 19–23, 1996. Proceedings, Vol. 1., Zurich, Switzerland, pp. 371–374.¨
Perez, C., Martınez, D., Petrov, V.V., 1992. Microstructure, mixing and turbulence in cumulus clouds over´ ´
Pruppacher, H.R., Klett, J.D., 1997. Microphysics of clouds and Precipitation. Kluwer Academic Publishers, 954 pp.
Richter, C., Goddard, J.W., 1996. The dependence of dropsize distribution shape factor on precipitation events. 12th International Conference on Clouds and Precipitation. Aug. 19–23, 1996. Proceedings, Vol. 1., Zurich, Switzerland, p. 61–64.¨
Ž .
Silverman, B.A., 1986. Static mode seeding of summer cumuli. A review. In: Braham, R.R. Ed. , Precipita-tion Enhancement. A Scientific Challenge. Meteorological Monograph No. 43. American Meteorological Society, pp. 7–24.
Ulbrich, C.W., 1983. Natural variations in the analytical form of the raindrop size distribution. J. Appl. Meteor. 22, 1764–1775.
Waldvogel, A., 1974. The N jump of raindrop spectra. J. Atmos. Sci. 31, 1067–1078.0
Willis, P.T., 1984. Functional fits to some observed drop size distributions and parameterizations of rain. J. Atmos. Sci. 41, 1648–1661.