AUTOMATIC BLOCKED ROADS ASSESSMENT AFTER EARTHQUAKE USING HIGH
RESOLUTION SATELLITE IMAGERY
H. Rastiveis a, *, E. Hosseini-zirdoo a, F.Eslamizadea
a Dept. of Geomatics Engineering, School of Eng., University of Tehran, [email protected]
KEY WORDS: High resolution Satellite Image, Earthquake, Classification, Texture Analysis, Roads damage map
ABSTRACT:
In 2010, an earthquake in the city of Port-au-Prince, Haiti, happened quite by chance an accident and killed over 300000 people. According to historical data such an earthquake has not occurred in the area. Unpredictability of earthquakes has necessitated the need for comprehensive mitigation efforts to minimize deaths and injuries. Blocked roads, caused by debris of destroyed buildings, may increase the difficulty of rescue activities. In this case, a damage map, which specifies blocked and unblocked roads, can be definitely helpful for a rescue team.
In this paper, a novel method for providing destruction map based on pre-event vector map and high resolution world view II satellite images after earthquake, is presented. For this purpose, firstly in pre-processing step, image quality improvement and co-coordination of image and map are performed. Then, after extraction of texture descriptor from the image after quake and SVM classification, different terrains are detected in the image. Finally, considering the classification results, specifically objects belong to “debris” class, damage analysis are performed to estimate the damage percentage. In this case, in addition to the area objects in the “debris” class their shape should also be counted. The aforementioned process are performed on all the roads in the road layer.In this research, pre-event digital vector map and post-event high resolution satellite image, acquired by Worldview-2, of the city of Port-au-Prince, Haiti's capital, were used to evaluate the proposed method. The algorithm was executed on 1200×800 m2 of the data set, including 60 roads, and all the roads were labelled correctly. The visual examination have authenticated the abilities of this method for damage assessment of urban roads network after an earthquake.
1. INTRODUCTION
Natural disaster always threat people life, property, etc. Among all, earthquake is important than the others and make irreparable damagebecause it's unpredictable and suddenly happened and population grows in city that has not suitable safety. Lifeline of urban infrastructure is the most sensitive because of the important role in rescue and assistance to the victims of an earthquake of great importance. Evaluating and identifying intact ways of damage and determining the degree of destruction is the most parts after the earthquake need to the rescue. Fast and accurate knowledge of the location of roads and the destruction of roads is valuable information for rescue and reconstruction work after the earthquake. A damage map contains information such as destruction of intact and damaged buildings or roads and, also may show the degree of destruction. For determining and identifying the destruction of roads and ways correctly can used object data and image. Depending on the type and quality of the object data, and image or a combination of both of them can be used. Image data contains aerial and satellite images and object data include vector map. The reason of time consuming ground working is not suitable in disaster management.Comprehensive information, complete and accurate geomantic knowledge after earthquake by data such as arial and satellite image, ground map data and LiDAR data. The goal of this research is offer algorithm in order to identify the intact and damaged roads, automatically, and determine damage degree, and at the end, generate the damage map. This research used pre-event vector data and post-event satellite image.
2. LITERATURE REVIEW
There are many researches for making damage map after earthquake in last three decades. These studies can be divide into
two groups of building damage map and road damage map. This paper work on damage road and more detailed overview on research of destruction road will be passed. Samadzadegan and Zarrinpanjeh used QuickBird satellite images before and after Bam earthquake for roads damage map generation. In this method, they used spectral and contextual information to identify earthquake effects on road surface like abrasion, extra objects, vegetation, obstruction by using classified algorithms. According to the existence of these effects of road surface they finally concludes that which road is intact and which one is blocked(Samadzadegan and Zarrinpanjeh 2008).
In one of the last researches, Bahr used WorldView satellite images and LiDAR coverage after the earthquake in Port-au-Prince, the city of Haiti, to reach Four Goals:1-Identifying the condition of homeless people who needs help, 2-locating the region. 3-Buildings existence and recognizing the buildings that has been ruined. 4-locating the roads through which the ground groups can transport. The role of analyses is an important issue in this study (Bahr 2014)
Another method that used both pre and post-event high resolution satellite image of QuickBird pre-event vector map in order to analyze the road image .. The aim of HaghighatTalab study is to introduce new method of automatic recognizing damage roads in urban area which uses genetic algorithm to find features of optimal texture. For the next step they attempted to determine the obstruction by one of supervise classification algorithms. Finally they analyzed the roads which were blocked by using Fuzzy Inference System and they also report 0.67 total accuracy and 0.67 Kappa(Haghighattalab, Mohammadzadeh et al. 2012).
3. BLOCKED ROADS DETECTION
Basically determining an undamaged road from damaged road is done by using satellite images in two automatic ways :using (processing image algorithms )and visual interpretation (observation is done by human operators).Everyday engineering science geomatic developments ,algorithm discovery ,new formula ,presenting new idea by the experts of discipline an one hand ,and problems like time -consuming and intolerable process and necessity of experienced faculty on the other hand make the visual interpretation be less attracted in contrast to other ways. Another problem of visual interpretation is the time-consuming and intolerable process and also human mistakes like tiredness and their inaccuracy. So they tried to do the process automatically by producing new techniques and idea and new seawares like digital image processing.
Among the information sources which are used for making damage map satellite images is more attracted by experts and damage manegment than other methods because of having constant region coverage and having no security limitation and quick access and having spatial resolution .Using this images in order to determine safe road from damaged roads ,the changes can be done through three ways: shadow analysis ,texture analysis and analysis of change detection which will be described one by one in the next paragraph.
3.1 Shadow Analysis
Shadow has an essential value in this method .In satellite image shadow is depend of the time of camerawork and the location of sun in the sky .shadow can be used as one data to determine the existence of debris in the road .So when the uniform shape and size of shadow has been changed it can be the sign debris of the building in that road .But shadow only can be the sign of building safety of one side of the road and the existence of shadow is not exactly shows the safety of the entire road.
In this study, the existence of shadow in one road is considered as the safety of only that part of the road.
3.2 Texture Analysis
Information of images of one object is divided into three groups:1-spectral data 2_textural data 3_structural data. Textural data is the most essential and powerful data among this three division .Textural data helps us to determine debris analysis .There is no actual definition for texture. But according to its different usages there is different meaning for texture. Texture is information more one pixel that shows the relation between the data of one pixel with its surrounding pixel .In other words pixel is not a texture per se, but it has grey degree. A texture can have features like grading, size, direction, density, equality, uniformity, harshness and non-roughness. So we can identify different damaging parts of the road like vehicle, raid surface safety, trees and also debris by texture analysis. In this study, textural data are used to determined earthquake effects in the surface of roads.
3.3 Changes Disclosure
Changes disclosure methods can be employed to determine destructed paths. Through these methods, two images from before and after the earthquake are compared against each other leading to determination of the changed terrains. Various algorithms including image difference and image classification difference are presented for changes disclosure using satellite
images. In order to distinguish blocked paths from un-blocked ones, these algorithms can be utilized as well.
Generally, calculation included in these methods can be conducted on pixel or object levels. Disclosure conducted on pixel level provides advantages such as more simple and less time consuming processing, while when object level is used, processing would be more complex due to segmentation step and pixel to image object conversion. The disadvantage of using the pixel level is the impact of co-coordination accuracy on the results which imposes the requirement of coordination with accuracy level pertinent to the pixel size.
4. PROPOSED METHOD
In this paper, a novel method for providing damage map based on surveying before the earthquake and high resolution WorldView II satellite images after it, is presented. As it is observable in flowchart 1, firstly in pre-processing step, image quality improvement and co-coordination of image and map are performed. In the second step, after extraction of texture descriptor from the image after earthquake and SVM classification, different terrains are detected in the image. Then based on available terrains on the surface of each path and extraction of candidate paths from the output of classification, the paths conditions in regard of getting blocked of remaining un-blocked is evaluated leading to providence of paths damage map. The following includes details on every mentioned step.
Fig.1: The flowchart of the suggested method for detection of un-blocked paths using satellite images with high separation capability
4.1 Pre-Processing
In order to improve the image quality, histogram balancing is conducted on the image from after earthquake situation, also in order to be able to relate the map and the image they are co-coordinated.
4.2 Image Classification
After pre-processing, in order to achieve terrain detection in the path area, image classification is conducted. Through this step, a set of educational data are selected for each class on the image under study. Then via extraction of pertinent texture descriptor and utilization of a proper classification algorithm, the image from after the earthquake is classified into six classes including path, building, shade, tree, debris, and vehicle. In the suggested method, texture and spectral descriptors are utilized in the
classification procedure. Texture descriptors include Haralick descriptors while spectral descriptors include three color bands of R, G, and B of the high resolution satellite image after the earthquake. The SVM approach is deployed for classification which is deemed to be a consummate tool for this problem. The following sections include the details on descriptor extraction and classification methods.
4.2.1 Descriptors Extraction
Various methods for texture analysis on images have been developed among which structural and statistical approaches can be referred to. In previous studies, satellite images are employed in destruction detection more than statistical approaches, however the capabilities of these methods is well established on a considerable level. Multiple texture descriptors can be extracted through statistical methods such as Co-occurrence matrices, Statistical moments, and Markov random fields.
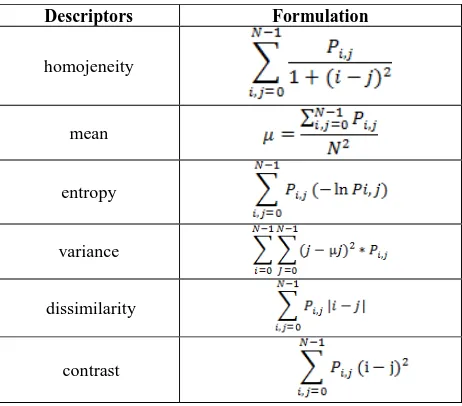
In this study, the parameters extracted from Co-occurrence matrices are utilized to demonstrate the texture behavior. Multiple texture parameters are extracted from this matrix among which six descriptors including contrastdissimilarity,variance, entropy,homogeneity andmean which provide more desirable capability level in separation between classes are employed. Table 1 presents the equations used for calculation of these parameters based on the Co-occurrence matrix. (1)
Descriptors Formulation
homojeneity
mean
entropy
variance
dissimilarity
contrast
Table 1. Extracted descriptors using the Co-occurrence matrix
In addition mentioned features in table 1, some of the texture descriptors from other methods can be utilized as well, also three color bands of R, G, and B of satellite images can be employed as a characteristic for classification.
4.2.2 SVM Classification
The SVM algorithm was developed by Vladimir Vapnik in 1963 and was extended to fit the nonlinear state by Corinna, Cortez, and Vapnik.(2,3) SVM employs a meta separator surface thorough maximization of the separator surface distance from each side on each class, a surface which is called the optimum separator surface. Fig.2 shows the separator line between two hypothetical classes.
b a
Fig 2. Meta Separator surface between two classes. A: Optimum separator surface. B: Meta Separator surfaces.
Postulate that n educational samples and two classes are available, in a manner that the following relation can be written for each sample:
D = ( �, �,) | �∈�� , � ∈ {-1 , 1}}�=1�
In this relation � is a real vector and � stands for each class output for the educational sample I, the objective is to find an optimum Meta separator surface which separates the two classes. The equation of this separator surface can be written as w.x-b=0 , and for the two classes under consideration the relations are presented in following form.
w.x-b=1 (1) w.x-b=0 (2) w.x-b=-1 (3)
In the following relation if Y is equal to one, the sample belongs to the first class, while if it is equal to minus one; the sample will be belonging to the second class. In order to prevent the points from getting to the peripheries relations 1, 2, and 3 are written as follows.
w.x-b≥1 (4)
w.x-b≤-1 (5)
Finally, relations 4 and 5 can be written as follows:
� (w. �-b )-1 ≥ 0 (6) � ( w. �--b ) ≥1-ξ_i (7)
With the conversion of equations 6 and 7 the problem of surface detection is conclusively reduced to minimization of Min[
ri
i
c
w
1 2
2
]
, in which C is the regulation parameter in optimization and
determines the level of imperfection in classification, which is defined through |w| minimization and Lagrange coefficient utilization(Gunn 1998)
4.3 Path Extraction
Considering the fact that in the pre-processing step, the maps are co-coordinated with the images from the condition after the earthquake, it is possible to transfer each coordinates from the map to image or vice versa. After classification, the points representing beginnings and ends of each path are detected in the image, and then through considering the buffer space equal to the width of the path, the path region is extracted from the classified image.
4.4 Path Blockage Analysis
In this step, after extraction of path region for each candidate path based on the number of pixels for each class, it is possible to evaluate the path blockage. In this study, the ratio between the amounts of debris on the path surface to the entirety of the path surface is employed as the detector parameter. If the ratio stands above a pre-defined amount the path is considered to be blocked while if this condition is not met the path is deemed to remain un-blocked. Eventually, the blocked paths can be shown with different colors in comparison with un-blocked paths and the path destruction path is provided.
5. TEST AND RESULTS ANALYSIS
The suggested algorithm is tested on the high resolution satellite image after Haiti quake in 2010 and the original maps of the region. In this section, firstly the characteristics of the under study region are presented and afterwards the obtained results are discussed.
5.1 The Case Study Region
In this study, high resolution satellite image after Haiti earthquake in 2010 and the vector data sets before the earthquake are utilized to evaluate the suggested algorithm. Within these data sets, the case study region with the area equal to 1200x800 square meters is selected and the paths contained in the region with the number equal to sixty are evaluated.
a
b
Fig 3. Study area. a. Post-event high resolution satellite imagery. b.Pre-event vector map
5.2 Obtained Results
After pre-processing, educational data sets are gathered from the under study region and pertinent descriptors are extracted to obtain desirable classification. In this study, 18 texture descriptors along with 3 spectral descriptors are used to form the description space in SVM classification method. In Fig.4 some of the extracted descriptors are depicted.
contrast dissimilarity
entropy variance
Fig 4. Some of the texture descriptors extracted from satellite images for classification
After extraction of pertinent descriptors, the image is classified into the mentioned six classes. The results of the classification are delineated in Fig.5.
Fig 5. Image classification after quake
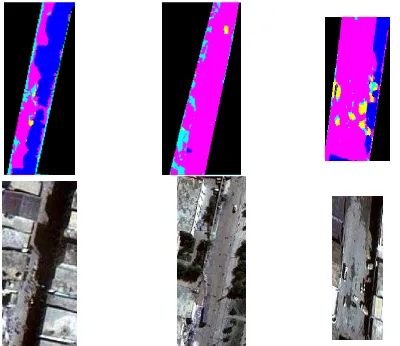
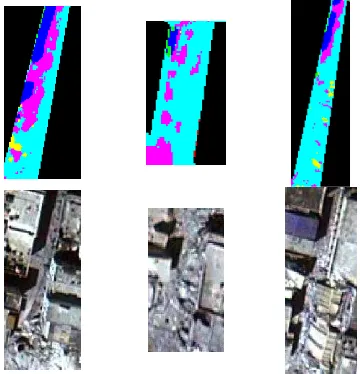
After classification and extraction of path regions based on the aforementioned approach, the potential blockage of paths is detected. Fig.6 shows some of the paths which are not considered blocked, while Fig.7 depicts the paths which are considered as blocked ones by the algorithm.
Fig 6. Some paths deemed un-blocked by the algorithm
Fig 7. Some paths deemed blocked by the algorithm
After running the algorithm for the entirety of the 60 selected paths, 23 were reported to remain un-blocked while the other 37 were detected as blocked paths; Fig.8 shows the obtained damage map from the algorithm.
Fig 8. The obtained destruction map from the suggested algorithm
5.2 Accuracy Evaluation
Two accuracy evaluation steps are presented; in the first step the validity of SVM classification is included. Conveniently, classification methods accuracy is evaluated via error matrices. Table 2, includes the resultant error matrix from the classification. The reported accordance percentage is around 83 percent with the Kappa coefficient equal to 75 percent.
Us
Table 2. Error matrix resulted from classification via SVM method
Table 3. Comparison between the destruction maps from visual interpretation and the suggested method.
Eventually, with a comparison between the destruction maps from actual surveying and the suggested method, an accordance percentage about 97 percent is achieved which is the result of only 2 paths detected not correctly. The evaluations further reveal that building regions lead to the majority of the occurred errors and the previously assessed classification error does not impose a considerable impact on the final results.
6. CONCLUSION AND PROPOSITIONS
In this paper, an algorithm is presented to distinguish between blocked and un-blocked paths using WorldView II satellite images with high separation capability after earthquake occurrence and original maps of the region. A validity percentage of 97 percent in path type detection demonstrates high capabilities of the developed algorithm, moreover, the capacity of the algorithm can be enhanced through increment in image separation level; thus, it is recommended that the algorithm be checked for other data sets as well. Furthermore, considering the importance of utilized descriptors in detection of different terrains, it is suggested that other type of descriptors be utilized for a comparison on final results.
REFERENCES
Shapiro, Linda, ed. Computer vision and image processing. Academic Press, 1992.
Karatzoglou, Alexandros, David Meyer, and Kurt Hornik. "Support vector machines in R." (2005).
Kavzoglu, T., and Colkesen, I., (2009) ‘A kernel functions analysis for support vector machines for land cover classification’, International Journal of Applied Earth Observation and Geoinformation, 11, (5), pp. 352-35
Bahr, T. (2014). Damage Assessment for Disaster Relief Efforts in Urban Areas Using Optical Imagery and LiDAR Data. EGU General Assembly Conference Abstracts.
Gunn, S. R. (1998). "Support vector machines for classification and regression." ISIS technical report 14.
Haghighattalab, A., A. Mohammadzadeh, et al. Post-earthquake road damage assessment using region-based algorithms from high-resolution satellite images. Remote Sensing, International Society for Optics and Photonics.
Samadzadegan, F. and N. Zarrinpanjeh (2008). "Earthquake destruction assessment of urban roads network using satellite imagery and fuzzy inference systems." The international archives of the photogrammetry, remote sensing and spatial information sciences 37(B8): 409-414.