EXTRACTION OF FOREST STANDS PARAMETERS FROM ASTER DATA IN OPEN
FOREST
M. Abbasia, H.R. Riyahi Bakhtyarib
aDepartment of Forestry, Faculty of Natural Resource and earth science, University of Shahre-kord, Charmahal & Bakhtyari, Iran. b
Desert Region Management Department, College of Agriculture, Shiraz University, Shiraz, Iran.
,
[email protected]Commission,9 : * IV/3
KEY WORDS: Forest inventory, Tree crown area, QuickBird, ASTER, Zagros, Iran
ABSTRACT:
Tree crown size (CS) and stem number per hectare (SN) has become increasingly important for forest management and ecosystem monitoring. Tree crown size is also strongly related to other canopy structural parameters, such as diameter at breast height, tree height and biomass. For both issues, remote sensing data are attractive for their large-area and up-to-date mapping capacities. The QuickBird and ASTER imagery used in this study was acquired over Zagros Forests in southern Zagros region, Fars province of Iran on 1 August 2005 and 1 July 2005, respectively. For the forest site investigated in this study, we concentrated on stands of Quercus Persica which is the dominant species in Zagros region. This study was conducted to investigate the capabilities of ASTER-L1B data to estimate some of forest parameters at individual tree and stand level in dry area. The forest stand parameters are crown area, crown density, average crown area. Obtaining the accuracy of classification the ground truth map was prepared by tree crown delineation using the panchromatic band of QuickBird data. Individual tree crowns were automatically delineated by color segmentation of QuickBird imagery. Simple linear regression procedure was used to show the relationships between spectral variables and the individual trees and forest stand parameters. With decreasing the crown density the effects of background will increase. Our results indicated that crown size could be accurately extracted from panchromatic band of QuickBird images especially for open forest stands. This paper demonstrates that using high-resolution satellite imagery in the open forest offers a unique opportunity for deriving single tree attributes and allowing reliable ground truth map to estimate stand structure.ASTER data and its indices showed good capability to estimate crown area in this study.
1 INTRODUCTION
There is a growing need to easily extract forest biophysical parameters, particularly for supporting sustainable forest management. These parameters are traditionally estimated using inventory data from field sample plots. However, the cost of conventional methods limits the intensity and frequency of the estimates over large areas. A potential solution to reduce high costs is application of remote sensing techniques to extract forest parameters. The increasing availability of high spatial resolution remotely sensed imagery provides viable opportunities for developing automatic forest inventories at fine scale. Delineation of the individual tree crowns is usable to estimate the tree crown size (CS) and stem number per hectare (SN). Tree crown size is also strongly related to other canopy structural parameters, such as diameter at breast height, tree height and biomass.
Manual interpretation of images is often labor and time consuming. Thus, automatic methods for interpretation can lower the work load and speed up the interpretation time (Eriksson, et al., 2006). Various studies have been done to delineate tree crowns using different methods such as valley following, template matching andregion growing (Pinz, 1989; Gougeon, 1995; Culvenor, 2002; Pouliot et al., 2002; Erikson, 2003). Most of these segmentation techniques have been applied in dense coniferous forests using black and with or gray images.
Eriksson (2004) in his study found that the delineation procedure often has difficulties when the forest is open and ground patches can be seen in the images since there is no reducing rule for non-treelike segments. To overcome this limitation, colour image segmentation gives access to colour space and leads to a robust approach to obtain accurate tree crown boundaries. Many vegetation indices (VIs) have been proposed to reduce non-vegetation effects and enhance the responsively to the variations of canopy biophysical characteristics (Wu et al., 2007). However, the stability and sensitivity of VIs are affected by soil optical properties (Huete, 1989) and illumination geometry. Soil optical properties may be well represented by defining a soil line with respect to the specific soil type (Richardson and Wiegand, 1977; Baret et al., 1989; Qi et al., 1994). Using multispectral images of the ASTER it is possible to use infrared bands to reduce the effect of non-vegetation or background
.
2 MATERIAL AND METHODS
2.1 Study area and satellite data
The study area is located in the Dasht-e Barm region (29° 33' 19'' N, 51° 53' 16''E) located in the Zagros forests, Fars province, Iran. High spatial resolution multispectral imagery was acquired over the study area by QuickBird sensor on 1 August 2005.
The QuickBird data set was composed of a panchromatic image (450 – 900 nm) with a GSD of 0.6 m, and 4-band multispectral imagery with 2.4 m GSD. The four bands include: blue (450 – 520 nm), green (520 – 600 nm), red (630 – 690 nm), and near-infrared (760 – 900 nm). The image was georeferenced to UTM zone 39N, WGS84 datum. The ASTER imagery was obtained on 1 July 2005 over the study area. Sub-images that covered the study site were extracted from the full images of the ASTER and QuickBird. Figure 1 demonstrated both subset images of the study site
2.2 Crown delineation
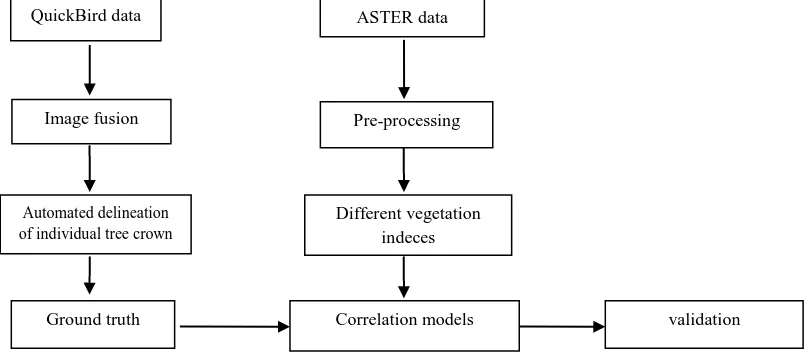
According to flowchart presented in Figure 2 this study composed of two main stages. The first part consists of individual tree crown delineation using QuickBird imagery. Achieving automated individual tree crown delineation, panchromatic band of QuickBird imagery was fused with multispectral bands using the PCA fusion technique. This step has been done to increase the spatial resolution of multispectral bands while preserving the spectral properties. Individual tree crowns were delineated using SMAP (Sequential Maximum A Posteriori) algorithm. SMAP combines an approach of Gaussian mixture model for classes distribution, to maximize separability among the classes and specialize each spectral signature, with a hierarchical multiscale segmentation method for contextual classification.
2.2.1Field data
Individual tree crowns were collected in frequent field visits in 2005-06 using DGPS Leica GS20. About 40 sample plots were measured during these field visits.
Figure 1. Illustration of images from ASTER (right image) yellow box and QuickBird (left image) showing study area of oak forest.
ASTER data
Pre-processing
Different vegetation indeces
Correlation models validation
Automated delineation of individual treecrown
QuickBird data
Image fusion
Figure 2. Framework of the study images, appropriate image enhancements were applied on the different spectral bands. To reduce the effects of the background reflectance, a variety of indices were examined and the most suitable indices identified among them.
The most known and widely used ratio-based index, Normalized Difference Vegetation Index (NDVI), which is sensitive to soil background, was used in this study. NDVI is calculated on a per-pixel basis as the normalized difference between the red and near infrared bands from an image:
NDVI= (NIR-RED)/ (NIR+RED)
Also three of the most commonly used and functionally different broadband soil VIs were selected (Bannari et al., 1995; Kasawani et al., 2010).
The VIs was calculated and analyzed using Spatial-Modeler module in ERDAS Imagine. The VIs involved in this study are as follows:
-PVI (Richardson and Wiegand 1977):
PVI = sin (a) NIR – cos (a) Red
L = 0.5 to minimize the soil influence, but the range of value is reduced. These values are depending on the red reflectance that has a coherent relation with soil influence.
- TSAVI (Baret and Guyot 1991):
TSAVI = a (NIR – aR – b)/ [Red + a (NIR – b) + 0.08 (1 + a2)] Where,
a = slope of soil line determine by NIR plot b = intercept of soil line
2.4 Preparing the crown area map
In order to preparing the crown area map, delineated individual tree crowns were used. About 30 plots were located randomly on the image with an area about 1 ha and then average crown area has been calculated for each plot.
Then, mean DNs of plots with vegetation indices, was calculated. simple linear regression was done between quantities of vegetation indices as dependent (Y) variable and same quantities of each plot in crown area as independent variable (Xi).
3 RESULTS AND DISCUSSION
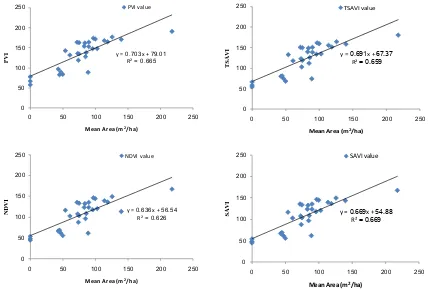
This paper applied color image segmentation to delineate individual tree crowns from QuickBird images to estimate mean tree per hectare for one of the most common tree species in Zagros forest in Iran. The results were compared with field data
in the crown by crown basis. No missing crown was found and the delineated crowns shoed perfect match with field measured crowns. The models were developed using single linear regression analysis, where the dependent variables were vegetation indices, and the independent variable was mean crown area per ha. The validation was carried out using paired t-Student test and standard error of estimation. The results indicated significant correlation between average crown area per ha and vegetation indices. Figure 3 illustrate the scatter plot and fitted line for each index. The scatter plots showed different crown area for the same value of VIs. That means several factors other than crown area contribute in creating surface reflectance of the area. To produce certain values of the VIs not only crown size is important but also tree spatial pattern is significant. Small scattered single trees make more mixed pixels in the border comparing to the one big tree with the identical crown area. Moreover, the ratio between crown area and pixel size is important. Many small crowns can be successfully delineated using QuickBird imagery while can have strong reflectance on the ASTER image.The investigation of several VIs to estimate mean crown area in open forests showed the estimate average crown area per ha in open forests of Iran. The presented results showed that spectral and spatial information of the ASTER imagery can be correlated with the biophysical forest parameters. At least spatial resolution more than the average crown diameter is needed for successful development of empirical relationships between remote sensing data and field measurements.
y = x +
Figure 3: The scatter plot, regressions models and correlation between the crown area (m2/ha) with the remotely sensed data (vegetation indices).
References
Apan, A., Young, F.R., Phinn, S., Held, A., and Favier, J., 2004. Mapping olive varieties and within-field spatial variability using high resolution QuickBird imagery. In Proceedings of 12th Australasian Remote Sensing and Photogrammetry Conference, Spatial Science Institute. (12th Australasian Remote Sensing and Photogrammetry Conference, 18-22 October 2004, Fremantle, Australia.)
Bannari, A., Morin, D., Bonn, F., Huete, A.R., 1995. A review of vegetation indices. Remote Sens. Rev. 13, pp. 95– 120.
Baret F, Guyot G, 1991. Potentials and limits of vegetation indices for LAI and PAR assessment. Remote Sensing of Environment, 35, pp. 161-173
Baret, F., Guyot, G., Major, D.J., 1989. TSAVI: a vegetation index which minimizes soil brightness effects on LAI and APAR estimation. In: Proceedings of the 12th Canadian Symposium on Remote Sensing IGARRS’90, Vancouver, Canada, pp. 1355–1358.
Qi, J., Chehbouni, A., Huete, A.R., Kerr, Y.H., Sorooshian, S. 1994. A modified soil adjusted vegetation index. Remote Sensing of Environment, 48, pp.119–126.
Culvenor, D. S. 2002. TIDA: An algorithm for delineation of tree crowns in high spatial resolution remotely sensed imagery. Computers & eosciences, 28(1), pp. 33– 44.
Erikson, M. 2003. Segmentation of individual tree crowns in color aerial photographs using region growing supported by
fuzzy rules. Canadian Journal of Forest Research, 33(8), pp. 1557–1563.
Erikson, M. 2004. Species classification of individually segmented tree crowns in high-resolution aerial images using radiometric and morphologic image measures. Remote Sensing of Environment, 91, pp. 469–477.
Eriksson, M., Perrin, G., Descombes, X., Zerubia, J. 2006. A comparative study of three methods for identifying individual tree crowns in aerial images covering different types of forests. (http://www-sop.inria.fr/ariana/)
Gougeon, F. A. 1995. A crown-following approach to the automatic delineation of individual tree crowns in high spatial resolution aerial images. Canadian Journal of Remote Sensing, 21(3), pp. 274–284.
Gougeon, F., Cormier, R., Labrecque, P., Cole, B., Pitt, D. and Leckie, D. 2003. Individual Tree Crown (ITC) Delineation on Ikonos and QuickBird Imagery: the Cockburn Island Study. In: 25th Canadian Symposium on Remote Sensing, Montréal (Québec), Canada, October 14-17.
Huete A.R, 1988. A soil-adjusted vegetation index (SAVI). Remote Sensing and Environment, 25, pp. 53-70
Huete, A.R., 1989. Soil influences in remotely sensed vegetation-canopy spectra. In: Asrar, G. (Ed.), Theory and Application of Optical Remote Sensing. Wiley, New York, pp. 107–141.
Applied Remote Sensing Journal, 1(1), pp. 25-31
Ke, Y., & Quackenbush, L.J. 2009. Individual tree crown detection and delineation from high spatial resolution imagery using active contour and hill-climbing methods. In: ASPRS 2009 Annual Conference Baltimore, Maryland, March, 9 – 13, 2009.
Pinz, A. 1989. Final results of the vision expert system VES: Finding trees in aerial photographs. In A. Pinz (Ed.), Wissensbasierte Masterkennung (Knowledge-based pattern recognition) OCG-Schriftenreiche, vol. 49 (pp. 90–111). Vienna: Oldenbourg Verlag.
Pouliot, D. A., King, D. J., Bell, F. W., & Pitt, D. G. 2002. Automated tree crown detection and delineation in high-resolution digital camera imagery of coniferous forest regeneration. Remote Sensing of Environment, 82, pp. 322– 334.
Richardson, A.J., Wiegand, C.L., 1977. Distinguishing vegetation from soil background information. Photogrammetry Engineer of Remote Sensing, 43, pp. 1541–1552.