THE CORRELATION ANALYSIS OF SUBSIDENCE MONITORING BY
D-INSAR AND THE CHANGE OF URBAN CONSTRUCTION LAND
KaiJun Yang
a, Xing Xiang Jiang
a, Li Cao
a, Fan Lei
a, Haibo Zeng
a, Zhe,Zhang
aHunan land and Resources Planning Institute, Hunan, People's Republic of China
[email protected]
KEY WORDS: DInSAR, subsidence, interferometry, correlation ABSTRACT:
The change of urban construction land affect the subsidence directly or indirectly, the method of D-InSAR has
centimeter level or even millimeter accuracy that can provide a reliable and accurate data for the research of
correlation analysis of subsidence monitoring by D-InSAR and the change of urban construction land. This article
takes Guiyang, Nanning city as example, using 3m level TerraSAR data to construct the Subsidence model by
interferometric measurement, then compared with the Chinese national land use change remote sensing survey
database at the same measure time to have a correlation analysis GIS research between subsidence and the change
of urban construction land. The results shows that the integral correlation coefficient achieved 0.78 between
subsidence and the change of urban construction land, the major construction area and the high density
construction area are with severe land subsidence. In addition, the correlation coefficient increased from the main
city to the suburbs, indicates that some of the main city causes permanent settlement and is difficult to recover. It
also shows that some area subsidence caused by long-term mining or other natural factors has no strong correlation
with the change of urban construction land, therefore, the results of D-InSAR subsidence monitoring have a
reaction on urban construction planning, guiding urban planning to high stability, low settlement area.
1. INTRODUCTION
The routine monitoring ways of ground
subsidence is mainly by levelling, GPS measurement,
stratified standard measurement and so on. These
ground measurements can only measure subsidence
information at sparse points on the ground, lack of
spatial density, difficult to cover large areas and
higher cost. Satellite Synthetic Aperture Radar
Interferometry(INSAR) is internationally recognized
as the most effective and advanced ways of ground
subsidence monitoring. At present, TerraSAR,
Sentinel-1, EnviSat satellites and GF3 provide reliable
protection data sources for large-scale urban
settlement monitoring. Many scholars in the world
have done a lot of research by INSAR technology.
However, due to the lack of official urban land change
data, the correlation analysis between urban land
change data and D-InSAR surface subsidence still in a
relatively vacant state, cannot be used for the city
planning, stable development pattern to provide a
scientific basis for analysis of relevance.
Based on this situation, this paper measure the
surface subsidence of Nanning area by using the
TerraSAR-X data from January 2016 to August 2016.
Then made a correlation study combined with the land
and resources data by remote sensing of People's
Republic of China Ministry of Land and Resources.
Based on the correlation results, the reason of the
settlement were analysed, and some suggestions are
put forward for the urban settlement control policy
and the development pattern.
1. INSAR SETTLEMENT MONITORING TECHNOLOGY
INSAR is an active remote sensing method by using
synthetic aperture radar on satellites, and it is a
method of extracting the three-dimensional
information and changing information of the surface
by using the phase information extracted from the
composite aperture radar data. The INSAR obtains a
pair of complex images of the same landscape by
observing the two antennas simultaneously (monorail
orbital mode). Due to the geometric relationship
between the target and the two antenna positions, a
phase difference is generated on the complex image to
form an interference pattern. The interference pattern
contains accurate information about the difference
between the point up the slope and the position of the
two antennas.
The geometrical relative relationship between the
satellite orbit and the ground target of the repeated
orbital interference is shown as below:
Figure 1. Figure of "Double track" method
In the figure, A1 and A2 represent the positions of the
two antennas respectively; B represent the distance
between the antennas base line; the angle between the
baseline and the horizontal direction is α; H is the
height of the platform; θis the reference line angle of
the first sub antenna , terrain elevation is z.
The interference phase at point P is:
4
=-
Bsin(
)
;
z
H
R
cos
(1)
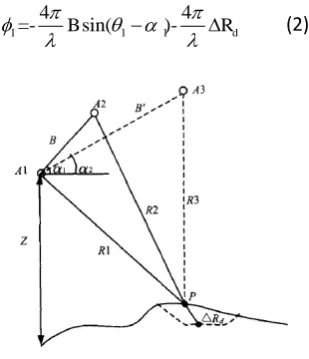
Differential interferometry (DINSAR) imaging
geometry (in the case of a three-track method) is
shown as below, ΔRd is the line of sight to the
deformed. A1 and A2 are the two satellite locations
where the satellite is imaged in the same area. The
first SAR image is obtained before the surface
deformation occurs, and the second SAR image is
obtained after the surface deformation. The phase of
the interference pattern formed by the two SAR
images both contains the terrain information of the
area and the observation during the deformation of the
surface information.
1=-4 Bsin( 1 1)-4 Rd
(2)
Figure 2. Figure of "Three-track" method
It is necessary to eliminate the terrain information of
the area before get the deformation information of the
surface, we then use the third SAR image to eliminate
the impact of terrain by interference methods. It is
known as the "three-track method".
The third image is acquired before the deformation
occurs, the interference pattern formed by the third
image and the first image, and the interference phase
contains only terrain information.
'
2 2 2
4
-
Bsin(
)
(3)
The phase caused by the line of sight to the
deformation ΔRd is:
d
4
=-
R
d
(4)
The amount of the left side of the above formula can
be calculated from the phase and orbital parameters of
the interference pattern, and then the line of sight of
each point of view to the deformation variable ΔRd is obtained, then the entire area of the surface
deformation is calculated.
2. EXPERIMENTAL STUDY
2.1 General Situation and Data Preparation
Nanning City is located in the southwest of China, is
the capital of Guangxi Province, it is the northern Gulf
Economic Zone and the core cities in southern China.
lot of groundwater exploitation in the old city. The
crust is relatively stable in the area, but there is a lot
of groundwater exploitation in the old city.
All-weather remote sensing monitoring is a project
carried out by the Ministry of Land and Resources to
monitor annual changes in urban construction data
changes, the development of city border. Aiming to
analyse the technical results of the land use credit file
by analysing the monitoring results of each city. In the
case of SAR orthographic imaging monitoring in
Nanning area, the two time nodes monitoring are
distributed in January 2016 and August 2016, and
more than 500 urban construction spot are extracted
through the refinement of human-computer interaction
work.
In order to analyse the correlation between the data
results, the TerraSAR-X monitoring data with the
resolution of 3m at same period with the monitoring
spot were selected. The incident angle was 33 degrees,
and the experiment was selected The Nanning area in
January and August, a total of six high-repeat
coverage of the same track TerraSAR data for
differential interference measurement.
2.2 Data Processing
Firstly, estimate the baseline image of the pairs
SAR image to be processed, he spatial baseline length
of the three pairs of images is 24m, 57m, 46m, the
time baseline length is 204 days, 211 days, 213 days.
The SRTM 90m grid is selected as the base DEM data.
The specific solution flow is Interferogram
Generation-> Adaptive Filter and Coherenace
Generation-> Phase Unwrapping-> GCP Selection->
Refinement and Reflattening-> Phase Dispalcement
and Conversion and Geocoding.
The Principal Parameters is as follows:
Range Looks:1,
Azimuth Looks:1,
Grid Size for Suggested Looks:3m,
Filter Method:Goldstein,
Unwrapping Method:Minimum Cost Flow,
Unwrapping Coherence Threshold:0.20,
Refinement Res Phase Poly Degree:3
In order to eliminate the influence of orbit error,
the DEM registration strategy is taken into account in
the spectral offset calculation to ensure that the local
terrain information.
Figure 3.
Interference fringe results
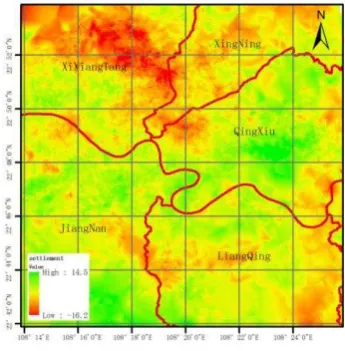
3. RESULT ANALYSIS
The experiment got the settlement results of Nanning
city (as shown below), The maximum settlement of
the area reached 14.5 mm, and the maximum lifting of
the surface reached 16.2 mm, with an average value of
0.62 mm, and the standard deviation is 3.94mm, It is
found that there is a large settling funnel in the
northwest of the region which is located in
Xixiangtang area of Nanning city, and the average
settlement of the core area is 10.6mm. There is a
significant uplift in the middle and southwest of the
study area.
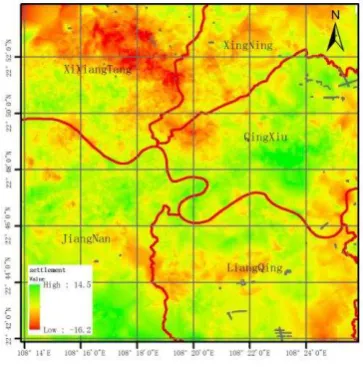
In order to study the correlation between the
all-weather remote sensing monitoring plots and the
regional subsidence, the spot of new construction and
the subsidence were superimposed (as shown below),
In the figure, the fragmented spots shows the new
construction land data of the all-weather change
survey, and it is found that the core construction area
appears positively correlated with the degree of
settlement, especially like XiXiangTang District in the
northwest and LiangQing District in the south, Both
of the settlement funnel with a higher higher
construction intensity. In order to express the
correlation between the data objectively, the mean
settlement value covered by the spot represent the
degree of subsidence of the plots, the density of the
plots in the radius of 500 m near the plots is taken as
the concentration of the plots, then obtain the
correlation between the degree of subsidence and the
degree of plot concentration.
Figure 5.Construction monitoring spots and
settlement result
the degree of plot settlement:
D 0
si represents the settlement value of a pixel in the area
covered by the spot,n indicates the number of pixels
within the spot。
The degree of plot concentration:
0
Ai represents the area of the spot,k represents the
number of plots in the radius range of 500 m,Area
represents the area of the circle with a radius of 500
m.
Through the above calculation method, the correlation
between the the degree of plot settlement and the
degree of concentration is 0.78, which is close to the
high correlation.
District correlation
Table 1. Distribution of correlation index
It is also found that Xixiangtang District is the old city
of Nanning City, and occurred many cracking events
by settlement, this place is also one of the most
serious areas of groundwater exploitation. High
positive correlation shows that the urban planning
decision-making does not take the surface subsidence
factor into consideration. There will be a hidden
danger of settlement prevention and control work with
sustained high-intensity construction. The city's urban
development should focus on the smaller settlement of
the study results, rather than strengthen the
construction in the settlement funnel,In addition,
governance work should be taken into account of two
larger sedimentation funnel areas in XiXiangTang
District and LiangQing District, forming a scientific
4. CONCLUSIONS AND PROSPECTS
In this experiment, the settlement results of January
2016 to August 2016 in Nanning area were calculated
by DInSAR. Two large settling funnels were found in
the northwest and southern regions, and there is a high
positive correlation with all-weather city change
monitoring spots, indicates that the planning and
construction work in the region is towards to the
wrong spatial orientation. We will explore the reasons
for the formation of sedimentation funnel in the future,
control the settlement from the source.
REFERENCES
Rodriguez E, Martin JM . Theory and Design of Interferometric Synthetic Aperture Radars[J].
IEEProc.-F, 1992, 139(2): 147- 159.
Hebble White B , Waddington A,Wood JH .Regional
Horizontal Surface Displacements Due to Mining
Beneath Severe Surface To-pography [A]. 19th
Conference on Ground Control in Mining [C].
Morgan town, West Virginia, USA, 2000.
Massonnet D, Rossi M. The Displacement Field of the
Landers Earthquake Mapped by Radar Interferometry
[J]. Nature, 1993, 364(6 433): 138-142
Amelung F, Jónssen S, Zebker H, et al. Wide-spread
Uplift and Trap Door Faulting on Gal Pagos
Volcanoes Observed with Radar Interferometry [J].
Nature,2000,407(6 807):993-996
Hanssen R H. Radar Interferometer-Data
Interpretation and Error Analysis[ M]. Netherlands:
Kluwer Academic Publishers, 2001
LIUG.X.,CHENY.Q.,DING X.L ., etal., 2002.
Monitoring Ground Settlement in HongKong with
Satellite SAR Interferometry, FIG XXII International
Congress, Washington,D.C,USA, 19~26.
Zhao Chaoying,Ding Xiaoli,Zhang Qin,et
al.Monitoring of Recent Land Subsidence and
Ground Fissures in Xi’an with SAR
Interferometry[C].ISPRS, Beijing,2008.
Hooper A, Zebker H A.Phase Unwrapping in Three
Dimensions with Application to InSAR Time
Series[J].J Opt Soc Am.A: Opt.Image Sci.
Vis.,2010,24(9):2 737-2 747
Li Z,Fielding E J,Cross P,et al.Interferometric
Synthetic Aperture Radar Atmospheric Correction:
GPS Topography-dependent Turbulence Model[J]. J
Geophys Res,2006,111(B2):B02404
GE L,CHANG H C,RIZOS C. Mine subsidence
monitoring using multi-source satellite SAR
images[J].Photogrammetric Engineering and Remote
Sensing,2007,73(3):259-266.
HAYMAN A,GE L,YAN Yueguan.Mapping
accumulated mine subsidence using small stack of
SAR differential interferograms in the Southern
coalfield of New South Wales,Australia[J].